Abstract
Unlike most other tissues, the colon epithelium is exposed to high levels of H2S derived from gut microbial metabolism. H2S is a signaling molecule that modulates various physiological effects. It is also a respiratory toxin that inhibits complex IV in the electron transfer chain (ETC). Colon epithelial cells are adapted to high environmental H2S exposure as they harbor an efficient mitochondrial H2S oxidation pathway, which is dedicated to its disposal. Herein, we report that the sulfide oxidation pathway enzymes are apically localized in human colonic crypts at the host–microbiome interface, but that the normal apical-to-crypt gradient is lost in colorectal cancer epithelium. We found that sulfide quinone oxidoreductase (SQR), which catalyzes the committing step in the mitochondrial sulfide oxidation pathway and couples to complex III, is a critical respiratory shield against H2S poisoning. H2S at concentrations ≤20 μm stimulated the oxygen consumption rate in colon epithelial cells, but, when SQR expression was ablated, H2S concentrations as low as 5 μm poisoned cells. Mitochondrial H2S oxidation altered cellular bioenergetics, inducing a reductive shift in the NAD+/NADH redox couple. The consequent electron acceptor insufficiency caused uridine and aspartate deficiency and enhanced glutamine-dependent reductive carboxylation. The metabolomic signature of this H2S-induced stress response mapped, in part, to redox-sensitive nodes in central carbon metabolism. Colorectal cancer tissues and cell lines appeared to counter the growth-restricting effects of H2S by overexpressing sulfide oxidation pathway enzymes. Our findings reveal an alternative mechanism for H2S signaling, arising from alterations in mitochondrial bioenergetics that drive metabolic reprogramming
Keywords: cell metabolism, hydrogen sulfide, bioenergetics, colorectal cancer, cell signaling, redox signaling, colonocytes, gut epithelium, metabolic reprogramming, microbiome
Introduction
Microbes that liberate substantial quantities of H2S via sulfate reduction or desulfuration of sulfur-containing amino acids (1) are among the ∼100 trillion gut-resident organisms (2). The adaptive mechanisms used by the colonic epithelium to counter exposure to potentially high luminal H2S, estimated to range from ∼0.2 to 2.4 mm (3, 4) in different parts of the colon, are largely unknown. Mitochondrial sulfide quinone oxidoreductase (SQR)4 catalyzes the first step in the canonical sulfide oxidation pathway and utilizes coenzyme Q (CoQ) as an electron acceptor (Fig. 1, a and b) (5, 6). High sulfide oxidation flux can potentially perturb mitochondrial bioenergetics by limiting the pool of oxidized CoQ, which accepts electrons from complexes I and II, and also supports other metabolic pathways. Furthermore, high H2S exposure can inhibit respiration by poisoning complex IV in the electron transfer chain (ETC) (7). There is limited understanding of the metabolic impacts of high mitochondrial H2S oxidation flux in colonocytes, resulting from their exposure to this respiratory toxin. Furthermore, antithetical findings on H2S (e.g. that it is proliferative versus antiproliferative or pro- versus anti-inflammatory) confound our understanding of its biological effects (8).
Figure 1.
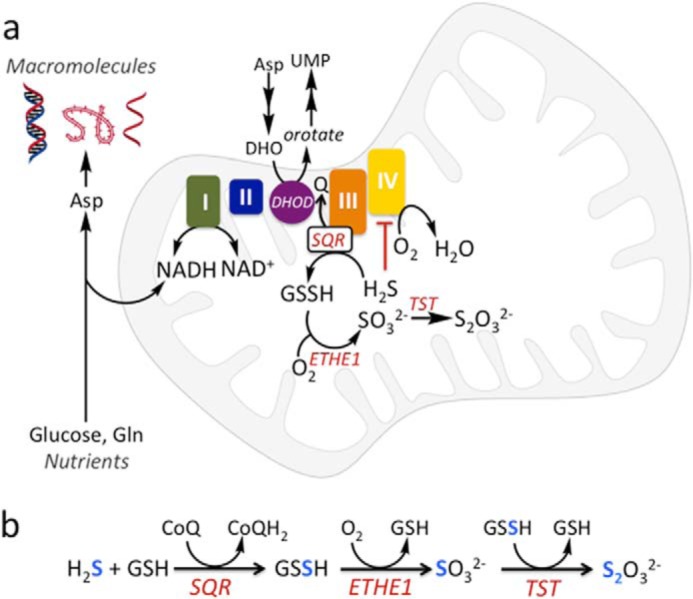
Schematic diagram showing the intersection between sulfide oxidation and energy metabolism. a, in proliferating cells, oxidation of nutrients for biomass synthesis leads to electron capture by NAD+ and other cofactors, which are recycled by the ETC. An H2S-induced ETC backup leads to a shortage of uridine and aspartate. DHO and DHOD, dihydroorotate and dihydroorotate dehydrogenase, respectively. b, reactions catalyzed by the sulfide oxidation pathway enzymes.
A critical function of mitochondrial respiration in proliferating cells is to recycle reduced cofactors (e.g. NADH and FADH2) and maintain a supply of electron acceptors. Rapidly proliferating cells faced with an insufficiency of electron acceptors due to mitochondrial dysfunction become auxotrophic for uridine and pyruvate (9). Whereas uridine deficiency is explained by the CoQ dependence of dihydroorotate dehydrogenase in the de novo pyrimidine synthesis pathway, electron acceptor deficiency, which creates a growth-restricting aspartate shortage, can be alleviated by exogenous pyruvate (10, 11). Aspartate is needed for nucleotide and protein synthesis (Fig. 1a). Because aspartate is more oxidized than the nutrients from which it is derived (i.e. glucose and glutamine), its synthesis requires a steady supply of NAD+.
Epithelial cells generally retain the capacity to proliferate through adulthood, and epithelial cancers are common (12). Whereas most cancer cells exhibit the Warburg effect (i.e. increased glycolysis in the presence of oxygen (13)), mitochondrial respiration is needed to support rapid growth; respiration inhibitors block cell proliferation (14, 15). It is not known how colorectal cancer (CRC) cells surmount the potentially growth-inhibiting effect of luminal H2S.
We hypothesized that exposure of colonocytes to high levels of H2S simultaneously stimulates sulfide oxidation flux and inhibits the ETC, leading to a functional insufficiency of electron acceptors. We demonstrate herein that the growth restriction imposed by H2S can be alleviated by exogenous uridine and aspartate and is partially circumvented by elevated expression of the sulfide oxidation pathway enzymes in CRC. We report that several H2S-induced metabolite changes in central carbon metabolism map to redox reactions, which are sensitive to perturbations in the NAD+/NADH ratio. Our study provides novel insights into an alternative mechanism of H2S signaling (i.e. via redox-linked metabolic reprogramming that emanates from the changes in the mitochondrial ETC).
Results
Localization of the sulfide oxidation pathway enzymes in normal and CRC tissue
The localization and expression levels of the sulfide oxidation pathway enzymes in normal and malignant human colonic tissue were compared. In normal colon epithelium, SQR, TST (rhodanese), and ETHE1 exhibited strong apical localization in colonic crypts (i.e. at the host–microbiota interface) (Fig. 2a). A similar localization pattern has been reported for the human sulfurtransferase, TSTD1 (16). In contrast, CRC tissue showed diffuse localization of all three enzymes, whereas the intensity of staining suggested higher expression levels (Fig. 2b).
Figure 2.
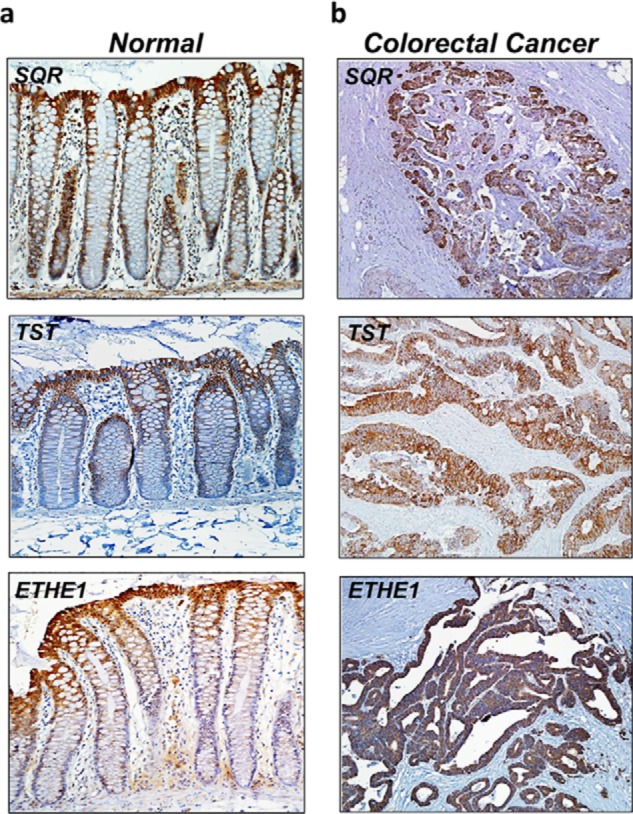
Localization of sulfide oxidation pathway enzymes in human colon tissue. Immunohistochemical staining of human SQR, TST (rhodanese), and ETHE1 reveals a strongly apical (surface) localization in normal colon (a) but diffuse localization in CRC epithelium (b). The panels are shown at ×20 magnification and are representative of two independent experiments, each performed in triplicate.
Next, the expression levels of the sulfide oxidation pathway enzymes were examined in seven resected CRC tissue specimens and patient-matched normal tissues. Western blot analysis revealed significant differences in enzyme levels in five of seven CRC samples, while the remaining two CRC samples showed expression levels that were similar to normal tissue (Fig. 3). Elevated expression of SQR and ETHE1 was observed in all six CRC cell lines that were studied (HT29, LoVo, Caco-2, RKO, DLD-1, and HCT116) compared with the nonmalignant colon cell line, human colonic epithelial cells (HCECs) (Fig. 4, a and b). The increase in SQR and ETHE1 protein levels was not due to increased mitochondrial density, as the cardiolipin content in CRC cells and HCECs was comparable (Fig. 4c).
Figure 3.
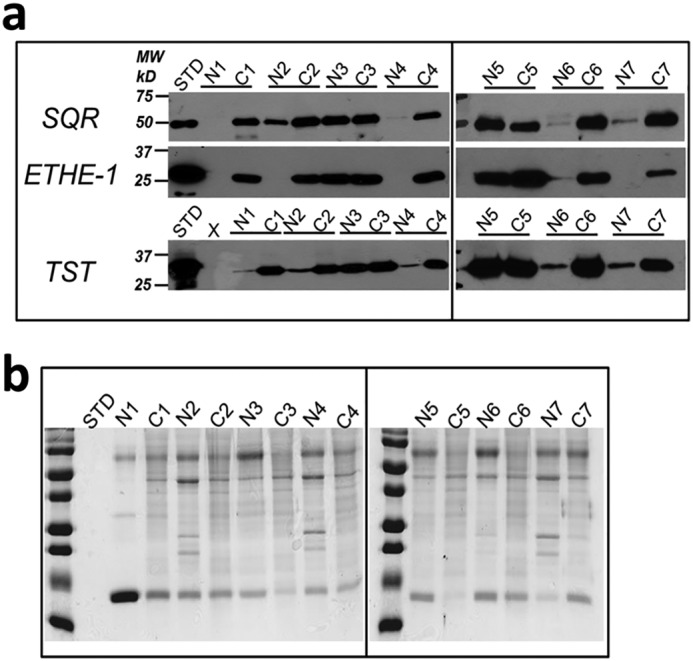
Sulfide oxidation pathway enzymes are up-regulated in human CRC samples. a, representative Western blot analysis of the sulfide oxidation pathway enzymes (SQR, ETHE1, and TST) in paired normal and cancer tissues from seven patients with CRC. STD denotes purified protein standards, and the numbered N/C pairs denote normal margin versus cancer tissue for each matched sample. b, protein loading control for colon tissue samples as visualized by Coomassie Blue staining. The data are representative of three independent experiments.
Figure 4.
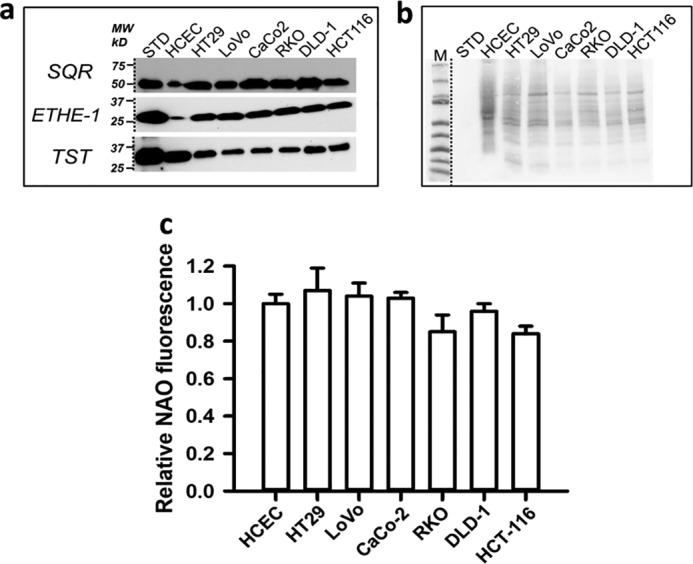
Sulfide oxidation pathway enzymes are up-regulated in human CRC cell lines. a, representative Western blot analysis of SQR, ETHE1, and TST in six human CRC cell lines and nonmalignant HCECs. Note that the HCEC lane was loaded with 120 μg of protein, whereas the others had 30 μg of protein each. b, protein-loading control for colon cell lysate samples in a as visualized by Ponceau S staining. The HCEC lane was loaded with 120 μg of protein, whereas the others had 30 μg of protein each. The data are representative of three independent experiments. c, mitochondrial content was assessed by NAO fluorescence of cells sorted by FACS in nonmalignant HCECs and the indicated CRC cell lines. The data represent the mean fluorescence ± S.D. (error bars) of two independent experiments, each performed in quadruplicate. The mean fluorescence of HCECs was arbitrarily set to 1.
SQR is a respiratory shield against H2S
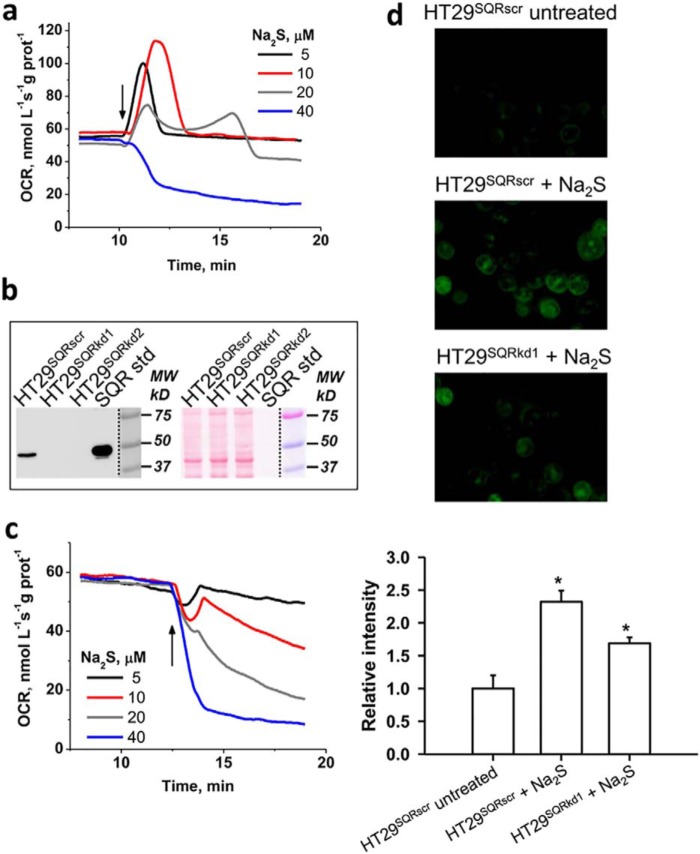
Sulfide concentrations below ∼20 μm stimulated the O2 consumption rate (OCR) in human colon cell lines but inhibited OCR at concentrations >30 μm (Fig. 5a and Fig. S1), presumably as complex IV inhibition became more dominant. The recovery time for return to the basal OCR increased as the H2S concentration increased.
Figure 5.
SQR dependence of H2S-induced OCR and sulfane sulfur formation. a, changes in OCR in a suspension of HT29 cells (HT29SQRscr) following addition (arrow) of varying Na2S concentrations. b, SQR expression in HT29SQRscr and two independent SQR knockdown lines, HT29SQRkd1 and HT29SQRkd2 (left). Right, equal loading of the same membrane as visualized by Ponceau S staining. c, representative data from one of two SQR knockdown cell lines (HT29SQRkd1) showing that they failed to activate OCR at any Na2S concentration. Similar results were obtained with HT29SQRkd2. d, representative images of HT29SQRscr cells that were untreated (top) or treated with 0.1 mm Na2S for 1 h (middle) compared with HT29SQRkd1 cells (bottom) treated with 0.1 mm Na2S. Cells were labeled with SSP4, which emits a green fluorescence in the presence of sulfane sulfur species (excitation, 482 nm; emission, 515 nm). Semiquantitative analysis of the microscopic data (bottom) represents the mean ± S.D. (error bars) of three independent experiments, each performed in duplicate (*, p < 0.001).
Whereas SQR overexpression in Chinese hamster ovary cells was reported to increase H2S-dependent OCR (17), the effect of attenuating SQR expression on the sensitivity of the ETC to H2S has not been assessed. Compared with HT29 CRC cells transfected with a scrambled shRNA sequence (HT29SQRscr), SQR expression was markedly diminished in two HT29SQRkd knockdown cell lines as assessed by Western blot analysis (Fig. 5b). SQR activity was measured in these cell lines as described (5). Activity was significantly diminished in the two HT29SQRkd cell lines (4–5 nmol of product min−1 mg−1 protein) compared with the control HT29SQRscr line (134 nmol of product min−1 mg−1 protein), confirming successful knockdown of SQR protein levels.
Both HT29SQRkd cell lines were highly sensitive to H2S poisoning, and OCR activation was not observed at any sulfide concentration (Fig. 5c). Inhibition of oxygen consumption was observed even at 5 μm H2S, revealing a key role for SQR in shielding cells from respiratory poisoning by H2S.
The sulfide oxidation pathway generates reactive sulfur species that could be important in signaling (18, 19). We therefore used the fluorescent SSP4 probe (20) to examine whether SQR activity modulates sulfane sulfur levels. Persulfide labeling was reduced in HT29SQRkd1 compared with control HT29SQRscr cells (Fig. 5d), consistent with the postulated role of the sulfide oxidation pathway in potentiating small molecule and protein persulfidation (18).
SQR knockdown–sensitive changes in reactive cysteine modifications in the mitochondrial proteome
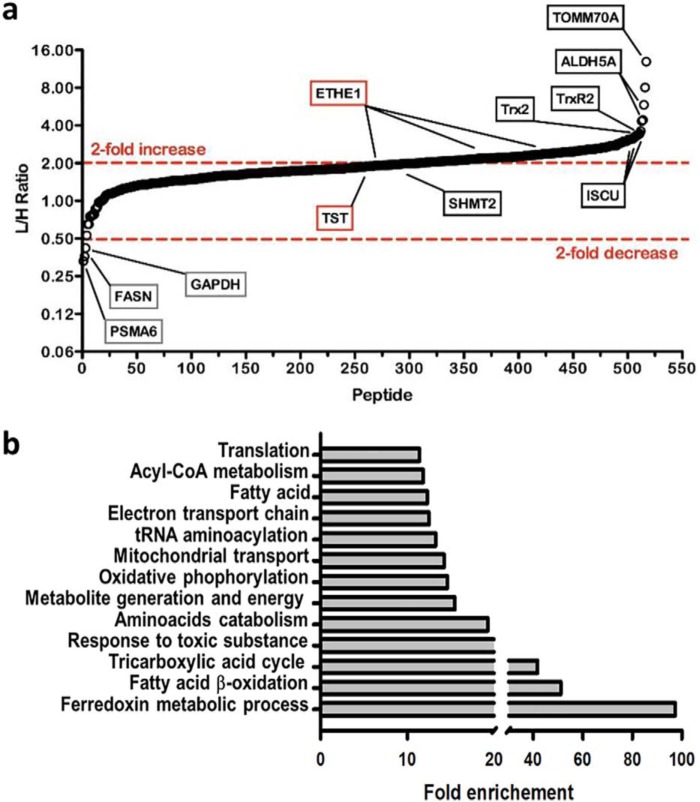
We identified changes in oxidative cysteine modifications in the mitochondrial proteome, which are sensitive to the presence or absence of SQR. For this, HT29SQRkd cells were labeled with standard amino acids, whereas HT29SQRscr cells were labeled with heavy isotopic amino acids ([6-13C,4-15N]arginine and [6-13C]lysine) (Fig. S2). Following mitochondrial enrichment and iodoacetamide-alkyne treatment, mitochondria from both cell lines were mixed, and a cleavable azo-tag was introduced via click chemistry to enrich for reactive cysteines that were subsequently identified by MS/MS analysis as described previously (21). Most modified cysteines in HT29SQRscr (heavy, H) cells displayed a decrease in cysteine thiol reactivity relative to HT29SQRkd (light, L) cells (i.e. higher L/H ratios). To account for differences in protein levels between HT29SQRkd and HT29SQRscr, cysteine reactivity changes were corrected for protein abundance to focus on cysteine modifications that were sensitive to the presence or absence of SQR.
Peptides identified with higher L/H isotope ratios indicated cysteines with higher reactivity (i.e. due to decreased posttranslational modification) in the absence of SQR, potentially implicating them as targets of GSSH (a product of the SQR reaction) or as targets of an enzymatic reaction downstream of SQR (e.g. a sulfurtransferase). From >250 mitochondrial proteins, >500 cysteine residues could be quantified, of which >200 had L/H ratios >2, indicating a widespread SQR-sensitive decrease in mitochondrial cysteine reactivity (Table S1).
Proteins with the highest cysteine L/H ratios included TOMM70A (translocase of outer mitochondrial membrane 70A) with an L/H of ∼13, ISCU (iron-sulfur cluster assembly enzyme) with an L/H of ∼3.25, and the mitochondrial antioxidant enzymes Txn2/Txnrd2 (thioredoxin 2/thioredoxin reductase 2) with an L/H of ∼3.5. TST, which forms a persulfide intermediate with GSSH as a substrate, showed an L/H ratio of 2.1 for the active site Cys248-containing peptide (Fig. 6a). Only three proteins had cysteines with a >2-fold decrease in their L/H ratio, including glyceraldehyde-3-phosphate dehydrogenase, previously identified as a persulfidation target (22), and fatty acid synthase. Because both these proteins are cytosolic, their identification indicated that some carryover of abundant cytoplasmic proteins had occurred in our mitochondrial preparation. Pathway enrichment analysis of proteins with L/H ratios >2 identified a number of processes involved in energy metabolism, as expected for the mitochondrial proteome (Fig. 6b).
Figure 6.
Effect of SQR on reactive cysteine modifications in the mitochondrial proteome. a, differential effects on cysteine reactivity in mitochondrial proteins modulated by SQR activity. L/H ratios for all identified mitochondrial cysteine-containing peptides corrected for changes in protein expression are shown; a subset is highlighted. Peptides with high levels of modified cysteine residues in the heavy sample (HT29SQRscr) display high L/H ratios. The data are the average of two independent experiments. b, pathway enrichment analysis of cysteine-containing peptides with L/H >2. Pathways exhibiting a >10-fold enrichment included several involved in energy metabolism.
H2S-induced metabolite changes map onto energy metabolism
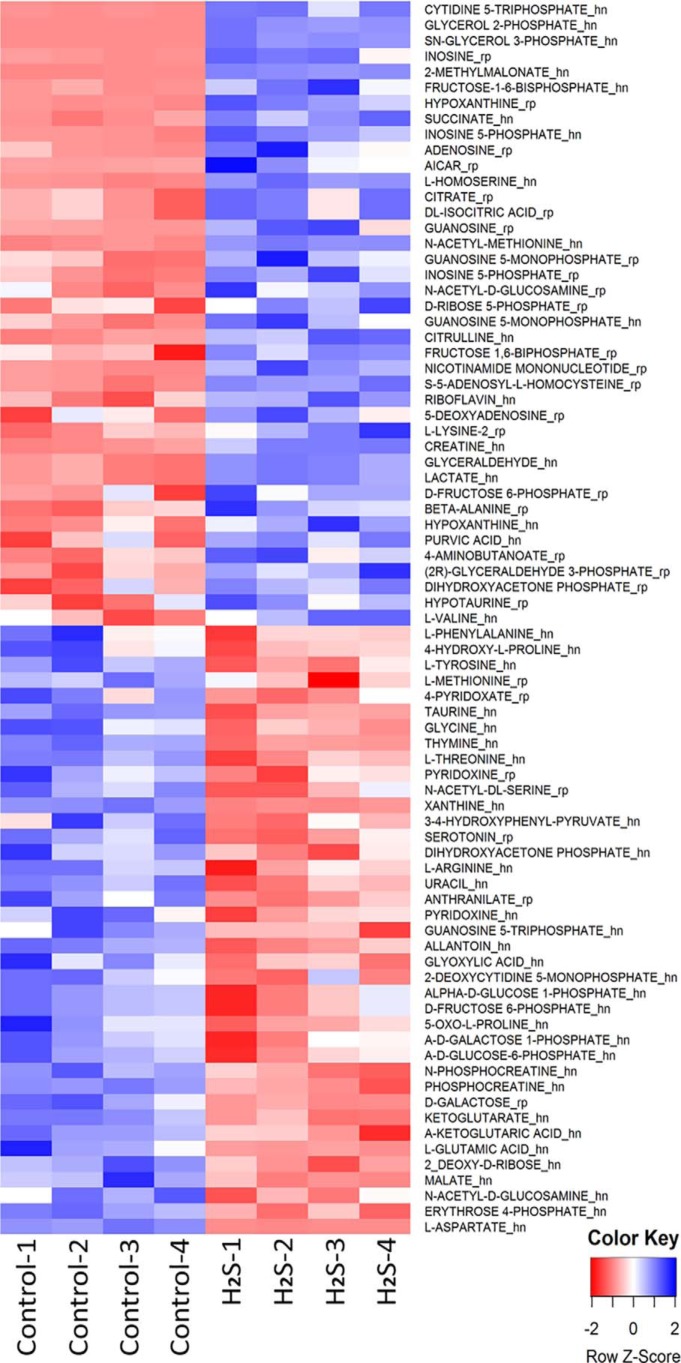
We used LC-MS–based metabolomics analysis to identify changes induced in HT29 CRC cells upon exposure to 0.1 mm H2S for 1 h. Both increases and decreases were observed with a subset of metabolites mapping either directly or indirectly onto central carbon and energy metabolism (Fig. 7). The majority of the glycolytic and TCA cycle metabolites that exhibited significant (p < 0.05) H2S-sensitive changes were substrates or products of redox cofactor–dependent enzymes, suggesting that H2S induces a perturbation in redox homeostasis (Fig. 8).
Figure 7.
Metabolomic changes elicited by H2S. The heat map shows differential changes (p < 0.05, CV < 1) in metabolites in HT29 cell lysates exposed for 1 h to 0.1 mm H2S. Metabolites are ordered by -fold change. The samples were run in quadruplicate. The suffixes “rp” and “hn” in the metabolite names represent measurements using reversed-phase LC in the positive mode and hydrophilic interaction LC in the negative mode, respectively, as described under “Experimental procedures.”
Figure 8.
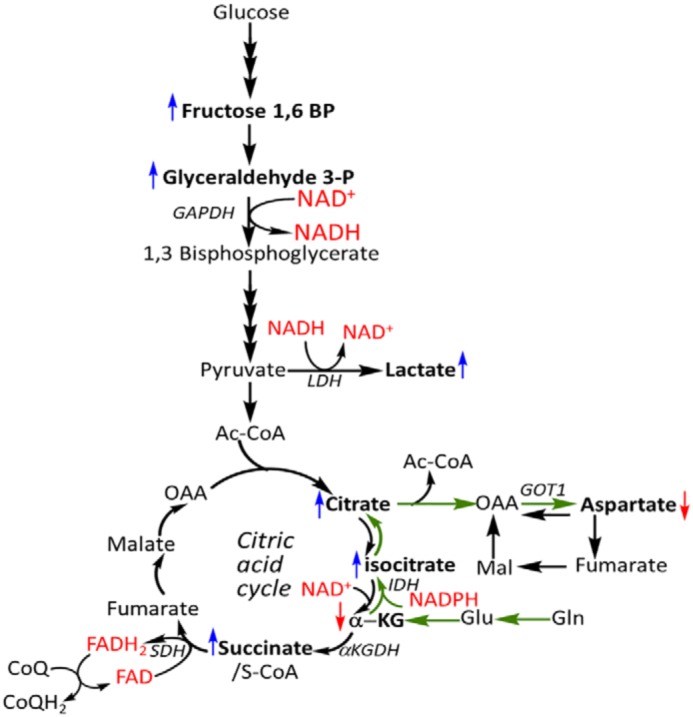
Several H2S-sensitive metabolite changes map to redox active nodes in central carbon metabolism. Shown is a schematic of central carbon metabolism, including the glutamine-dependent reductive carboxylation pathway (green arrows) that is stimulated by H2S. Changes in metabolites are denoted by the same color scheme used in Fig. 7 (i.e. blue and red arrows represent increases and decreases, respectively).
H2S restricts proliferation
OCR experiments revealed that H2S concentrations >30 μm inhibited respiration in intact cells (Fig. 5a and Fig. S1) and that the basal rate was recovered at longer times (60 min, not shown). Because cell proliferation is monitored over longer time periods and because H2S is volatile and lost from culture dishes, monitoring the effects of H2S on proliferation necessitated the use of a different study design. Thus, repeated bolus administration of H2S (0.1 or 0.3 mm) over 72 h was used as described under “Experimental procedures.” At a concentration of 0.3 mm, HT29 CRC cells were more resistant to the antiproliferative effects of H2S compared with the noncancer HCECs (Fig. 9a). At a lower concentration (i.e. 0.1 mm) only HCECs exhibited growth restriction compared with the four CRC cell lines that were tested (Fig. 9b).
Figure 9.
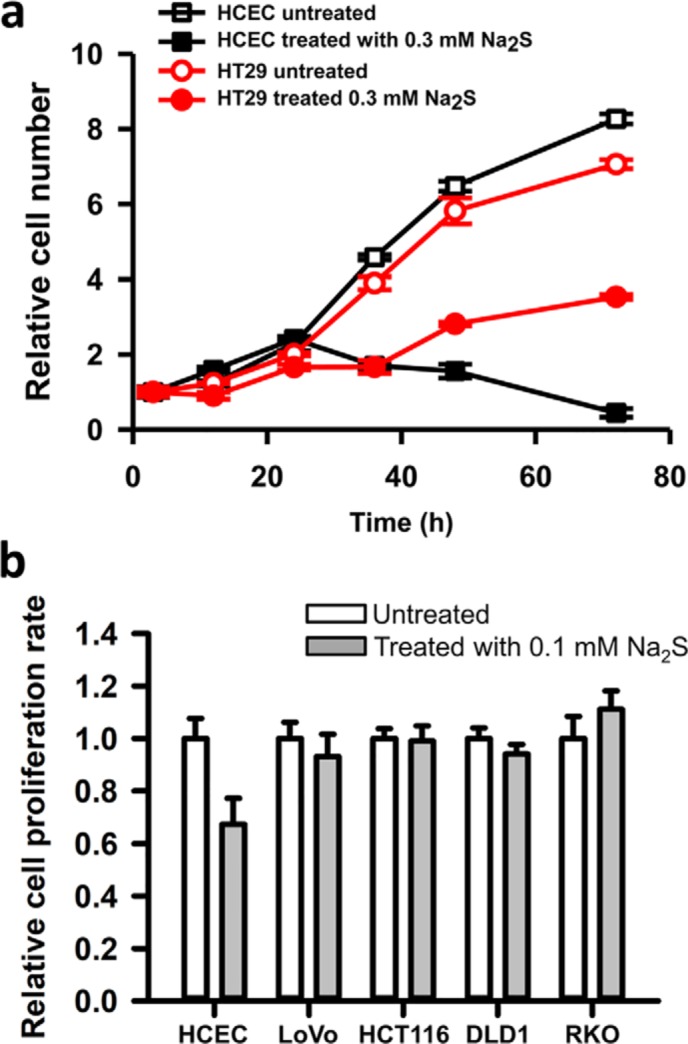
CRC cells are more resistant than a nonmalignant colon cell line to the antiproliferative effect of H2S. a, effect of H2S (0.3 mm) on the proliferation of HCECs and HT29 cells. Values for untreated HCECs and HT29 cells at t = 0 h were set at 1. The data (mean ± S.D. (error bars)) are representative of three independent experiments, each performed in triplicate. b, the proliferation rate of HCECs was compared with that of four other colon cancer cell lines as indicated in the absence (white bars) or presence of Na2S (gray bars). Cells were treated with 0.1 mm Na2S at time 0 and every 12 h, and the medium was changed every 24 h for a total treatment time of 72 h, as described under “Experimental procedures.” Proliferation was measured using the MTT assay. The data are representative of three independent experiments, each performed in triplicate, and represent the mean ± S.D.
H2S causes electron acceptor insufficiency
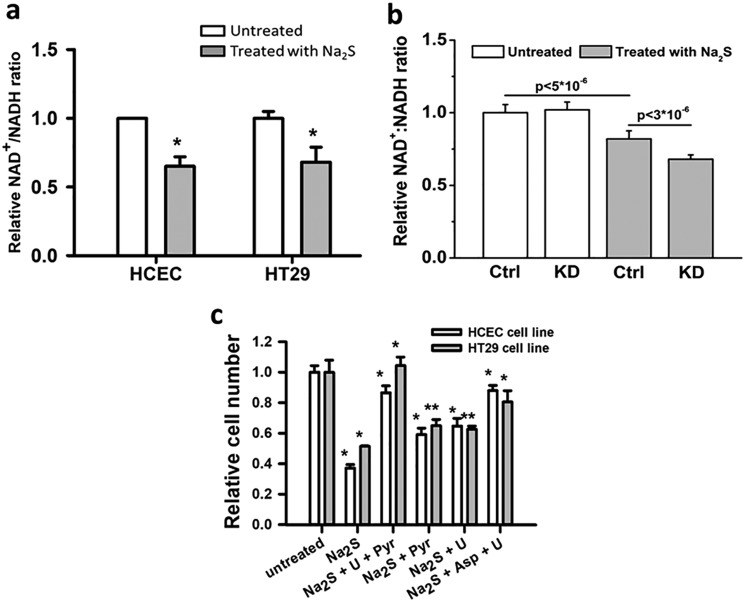
The dual effects of H2S on the ETC (i.e. stimulation of O2 consumption by the sulfide oxidation pathway and inhibition of complex IV) predicts that H2S exposure would lead to an over-reduced CoQ pool. Thus, the antiproliferative effect of H2S could result in part from a general insufficiency of electron acceptors that are regenerated by the ETC, which, in turn, restricts aspartate and uridine pools needed for biomass production (Fig. 1a). Consistent with this prediction, a decrease in the NAD+/NADH ratio was observed in cells exposed to H2S (Fig. 10a). A further reduction in the NAD+/NADH ratio was seen in H2S-treated HT29SQRkd1 cells compared with HT29SQRscr cells (Fig. 10b), consistent with their greater sensitivity to H2S, resulting in ETC inhibition (Fig. 5c).
Figure 10.
Growth restriction by H2S is due to electron acceptor insufficiency. a, a change in the NAD+:NADH ratio was observed in the presence of 0.1 mm Na2S (gray) compared with its absence (white). The NAD+:NADH ratios for untreated HCECs and HT29 cells were set at 1. The data are representative of five independent experiments, each performed in triplicate (*, p < 0.001). b, a difference in the NAD+:NADH ratio was observed in HT29SQRscr (Ctrl) and HT29SQRkd1 (KD) cells in the absence (white) and presence of 0.1 mm Na2S (gray). The NAD+:NADH ratio for untreated HT29SQRscr cells was set at 1. The data are representative of mean ± S.D. (error bars) of three independent experiments, each performed in triplicate. The p values are shown for the difference between HT29SQRscr cells with and without H2S and between Na2S-treated HT29SQRscr and HT29SQRkd1 cells. The difference between untreated HT29SQRscr and HT29SQRkd1 cells was not significant (p > 0.3). c, proliferation of HCECs (white) and HT29 cells (gray) at 48 h following culture in the absence or presence of 0.3 mm Na2S, uridine (U), pyruvate (Pyr), and aspartate (Asp) added at concentrations specified under “Experimental procedures.” The data are representative of four independent experiments, each performed in triplicate, and represent the mean ± S.D. (*, p < 0.001; **, p < 0.01).
As a further test of our model, we assessed the ability of pyruvate and/or uridine to alleviate H2S-imposed growth restriction. Proliferation of HT29 cells and HCECs was fully rescued by uridine and pyruvate and partially rescued when either nutrient was supplied individually (Fig. 10c). Furthermore, aspartate, combined with uridine, also rescued growth, demonstrating that aspartate could effectively substitute for pyruvate to relieve the growth-limiting effect of H2S.
H2S stimulates reductive carboxylation
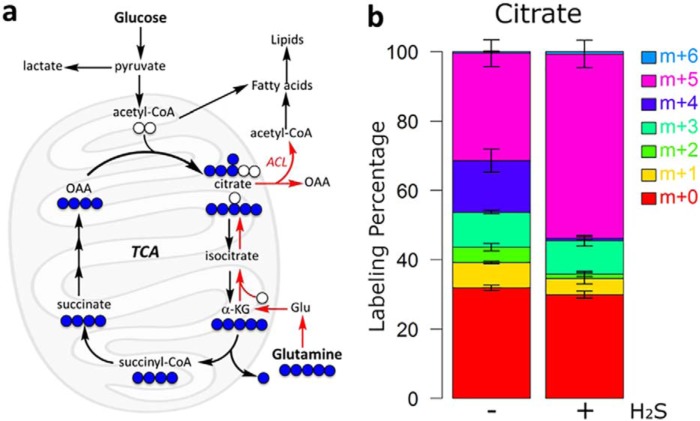
A signature metabolic response in cells experiencing ETC restriction is stimulation of the reductive carboxylation of glutamine-derived α-ketoglutarate to drive citrate synthesis (23, 24). Reductive carboxylation relies on NADPH-dependent isocitrate dehydrogenase 1 and 2 to generate citrate, which can be distinguished from the TCA cycle–dependent oxidative decarboxylation by the pattern of label incorporation from [U-13C]glutamine into citrate (Fig. 11a). Mass isotopomer analysis revealed an increase in the fractional enrichment of M+5 citrate and a decrease in M+4 citrate in H2S-treated versus untreated controls, supporting an increased flux of glutamine-derived α-ketoglutarate into citrate via reductive metabolism (Fig. 11b).
Figure 11.
H2S induces a metabolic shift toward the reductive TCA cycle. a, schematic representation of the fate of l-[U-13C]glutamine (blue) metabolized in the oxidative (black arrows) versus reductive (red arrows) directions. Unlabeled atoms are shown in white. ACL, ATP citrate lyase. b, fractional labeling isotopologue distribution of citrate in HT29 cells labeled with l-[U-13C]glutamine in the absence or presence of 0.1 mm Na2S. Samples were analyzed by MS, and the values were normalized to total protein as described under “Experimental procedures.” The analysis was performed in quadruplicate, and the data represent mean ± S.D. (error bars).
Discussion
Whereas most mammalian cells synthesize H2S and maintain low steady-state levels (10–80 nm (25, 26)) of this respiratory toxin (27, 28), epithelial cells in tissues like colon are also routinely exposed to high levels of exogenous H2S (3). It is not known whether H2S is a mediator of productive mutualism at the host–microbiota interface or a byproduct of such an interaction. Strikingly, the sulfide oxidation pathway enzymes are heavily localized at the surface of colonic crypts (i.e. at the host–microbiota interface) (Fig. 2). In contrast, these enzymes are diffusely distributed and, as discussed below, overexpressed in CRC tissue.
The metabolic response of colon epithelial cells to potentially high chronic H2S exposure is not known. In this study, acute responses to H2S were monitored in OCR experiments at relatively low concentrations of H2S (5–40 μm). Our longer-term studies (e.g. proliferation and metabolic labeling assays) used higher concentrations of H2S (0.1–0.3 mm) due to its volatility and rapid loss from the medium under cell culture conditions. We note, however, that these concentrations are likely to be at the low end of endogenous luminal H2S concentrations, which are reported to range from ∼0.2 to 2.4 mm (3, 4).
Short-term exposure of colon cell lines to H2S (>30 μm) inhibited respiration (Fig. S1), which was reversible (17) (data not shown). The presence of SQR was critical for shielding the ETC from H2S. When SQR was knocked down, cells became very sensitive to respiratory inhibition, which was observed even at 5 μm H2S concentration (Fig. 5c). These results indicate that SQR levels are likely to be an important determinant of tissue sensitivity to H2S.
Repeated and longer-term exposure to H2S restricted growth (Fig. 9) and limited regeneration of oxidized cofactors that are needed for nutrient oxidation. This was reflected in a reductive shift in the NAD+/NADH ratio (Fig. 10a). In SQR knockdown cells, the magnitude of the reductive shift was greater, as expected from their greater sensitivity to ETC inhibition by acute H2S exposure (Fig. 10b). Notably, the SQR knockdown cells did not exhibit a lower NAD+/NADH ratio in the absence of exogenous H2S. Thus, the residual SQR levels were sufficient to clear H2S derived via endogenous synthesis, and/or endogenous H2S synthesis was negligible under our growth conditions.
H2S-induced redox perturbation (i.e. as indicated by the altered NAD+/NADH ratio) is expected to have pleiotropic metabolic effects. Thus, the cytosolic aspartate transaminase GOT1, which typically consumes aspartate and α-ketoglutarate, forming oxaloacetate and glutamate, reverses direction when the ETC is inhibited (11). GOT1 is a component of the malate–aspartate shuttle that moves reducing equivalents into the mitochondrion. In response to a drop in aspartate levels, due to ETC inhibition, GOT1 reversal opens a route for cytoplasmic aspartate synthesis (Fig. 8, green arrows). Under these conditions, glutamine is the major carbon source for aspartate synthesis driven via the reductive carboxylation pathway (10, 11). Thus, glutamine-derived citrate is cleaved to oxaloacetate, which in turn, is transaminated by GOT1 to form aspartate. Our finding that H2S-induced growth restriction is alleviated by exogenous uridine and aspartate (Fig. 10c) is consistent with the model that repeated H2S exposure inhibits the ETC. Increased M+5 labeling of citrate from [U-13C]glutamine further supported increased reductive carboxylation activity under these conditions (Fig. 11b).
The antiproliferative effect of H2S raised the obvious question of how CRC cells overcome this restriction. We found a correlation between malignancy and overexpression of sulfide oxidation pathway enzymes for clearing H2S in human CRC tissue and cell lines (Figs. 3 and 4). Increased levels of SQR and ETHE1 relative to the levels in normal colon epithelium were observed in five of seven CRC patient samples compared with normal tissue margins and in all six malignant cell lines compared with a nonmalignant colon-derived cell line. Whereas TST was also increased in 5/7 CRC samples, a change was not consistently seen in the CRC cell lines compared with the nonmalignant cell line. Increased levels of these enzymes should increase H2S oxidation capacity and confer protection against its inhibitory effects. Consistent with the lower expression levels of SQR and ETHE1, the nonmalignant HCECs were more sensitive to growth restriction by H2S than the malignant cell lines (Fig. 9).
What is the mechanism by which H2S induces metabolic reprogramming? H2S is widely assumed to signal via cysteine persulfidation (22), a posttranslational modification of cysteine residues. As discussed below, this mechanism fails to explain how specific cysteines are targeted for persulfidation and how this highly reactive modification is stabilized to have a lifetime that is sufficient for transducing the signal (18). We posit that H2S signals via changes in the ambient or local redox state. In this mechanism, H2S induces alterations in mitochondrial bioenergetics that can trigger retrograde metabolite signaling, beginning with metabolic reprogramming in the mitochondrion.
Oxidative cysteine modifications have emerged as second messengers for transducing oxidant signals into cellular responses (29). Whereas the types of regulatory cysteine modifications continue to grow, insight into how target specificity is achieved in all such redox signaling pathways is limited. Furthermore, it is challenging to separate modifications that are functionally consequential from those that are likely to be solely collateral effects of an oxidant signaling response. Similarly, the mechanism for achieving target specificity during formation of a cysteine persulfide, presumably via the reaction of an oxidized cysteine (e.g. cysteine sulfenic acid) with H2S (30), is not known. In addition, the potential involvement of low-molecular-weight persulfide donors (e.g. GSSH, a product of the SQR reaction) (5, 31) in protein persulfidation is not known.
Our analysis of changes in oxidative cysteine modifications in the mitochondrial proteome that are sensitive to SQR revealed a large number of targets, of which some (e.g. TST) are known to be persulfidated (32) (Table S1). A very large number of persulfidation targets have also been reported in other studies that specifically identified persulfidated proteins (33, 34). However, characterization of H2S signaling via persulfidation, which is a labile and reactive modification, remains to be rigorously demonstrated. Our study establishes an alternative mechanism by which H2S signals (i.e. via reprogramming energy metabolism, which is initiated by a shift in mitochondrial bioenergetics with consequent effects in the cytoplasm). A fundamental open question is why eukaryotic cells produce H2S at all. A provocative implication of our study is that metabolic modulation by H2S might be a key regulatory strategy that is used by cells under certain conditions.
Experimental procedures
Immunohistochemistry
Formalin-fixed paraffin-embedded colon tissue cross-sections from three patients were performed as described previously using the avidin–biotin complex (ABC) technique (16, 35). Briefly, human colon tissue was mounted on glass slides in pairs (normal and cancer tissue), and the slides were completely deparaffinized by immersion in xylene twice for 10 min each and rehydrated with water following incubation in graded ethanol (100, 90, and 70%). The antigen retrieval step was performed before immunostaining by microwaving the slides for 10 min in citrate buffer (pH 6.0; Biogenex, San Ramon, CA) followed by incubation in 3% H2O2 in methanol to block endogenous tissue peroxidase activity. The sections were blocked with 1.5% rabbit (for SQR and TST staining) or mouse (for ETHE1 staining) serum for 1 h and incubated with the specific antibody overnight at 4 °C. Rabbit anti-ETHE1 (Abcam, EPR11697 ab174302), rabbit anti-SQR (Proteintech, 17256-1-AP) and mouse anti-TST (Proteintech, 66018-1-Ig) antibodies were used. Slides were washed with PBS and incubated with a biotinylated secondary antibody for 30 min at room temperature. The antigen signal was amplified using the ABC method (Vectastain ABC kit, catalogue no. PK-6105, Vector Laboratories, Burlingame, CA). The antigen–antibody–avidin complex was detected using the chromogenic substrate 3,3-diaminobenzidine, which produced a dark brown color. Immunostained sections were counterstained with hematoxylin and examined by light microscopy. pTNM pathological classification was used to stage tumor tissues (36).
Western blot analysis
Pieces of frozen human colon tissue (obtained from the Tissue and Molecular Pathology Core, University of Michigan) were disrupted in RIPA lysis and extraction buffer (100 mm Tris, pH 7.5, 150 mm NaCl, 2 mm EDTA, 1% Triton X-100, 25 mm deoxycholic acid, 0.5% Nonidet P-40, 2 tablets/100 ml of cOmpleteTM mini, EDTA-free protease inhibitor mixture (Roche Applied Science), and 25 μg/ml phenylmethylsulfonyl fluoride) using a glass homogenizer. Cell cultures were washed twice with cold PBS, and then the plates (with cells) were frozen on dry ice. Then cells were scraped off the plates in RIPA buffer followed by three cycles of freezing and thawing. The lysates were incubated on ice for 30 min followed by centrifugation at 14,000 × g for 10 min at 4 °C. The supernatant was collected, and the protein concentration was determined using the Bradford reagent (Bio-Rad) and BSA as a standard. Cell lysates were separated on SDS-polyacrylamide gels along with known amounts of purified recombinant proteins used as standards, and the proteins were transferred to polyvinylidene difluoride membranes. The antibodies used for the immunohistochemistry experiments described above were also used for Western blot analysis. Tomm20 was detected in colon cell lines using a rabbit polyclonal antibody from Proteintech (11802-1-AP). Rabbit or mouse secondary antibodies conjugated to horseradish peroxidase were used to visualize signals using the chemiluminescent peroxidase substrate kit SuperSignal West Dura (Thermo Scientific). Equal loading of the samples was verified by staining the polyvinylidene difluoride membranes with Ponceau S or Coomassie Blue.
Gene silencing
Gene silencing was performed using shRNA vectors containing SQR-targeting shRNA sequences were purchased from Sigma (clone ID: NM_021199.1-1306s1c1 and NM_021199.1-838s1c1, Mission shRNA Library). For the negative control, an shRNA vector with scrambled sequence was used (Sigma). Lentiviral particles containing the shRNA-targeting or scrambled sequences were obtained by transfecting HEK293T cell lines with packaging plasmids and the shRNA vector. Viral particles were added to HT29 cells, and the transfected cells were selected with 1 μg/ml puromycin.
OCR measurements
O2 consumption by cell suspensions was measured using a respirometer (Oroboros Instruments Corp., Innsbruck, Austria) equipped with two polarographic oxygen-sensing electrodes in two 2-ml chambers. For this, confluent cells (70–80%) in 10-cm plates were trypsinized and suspended in cell culture medium. Cells were pelleted by centrifuging at 2,000 × g for 5 min at 4 °C, the medium was aspirated, and the cells were suspended in 2.2 ml of DPBS (PBS plus CaCl2 and MgCl2 (Gibco)) supplemented with 20 mm HEPES, pH 7.4, and 5 mm glucose, and stored on ice. The cell suspension was diluted 2-fold inside the chambers of the respirometer and stirred at 25 °C. The rate of O2 consumption by cells was stabilized within 5–10 min, and then known concentrations of Na2S were added using a Hamilton gas-tight syringe. OCRs were normalized to protein concentration in the cell suspension. For protein analysis, cell suspensions were diluted 1:1 with lysis buffer (20 mm HEPES, pH 7.4, 25 mm KCl, 0.5% Nonidet P-40 (v/v), protease inhibitor mixture for mammalian tissue (Sigma), 1% (v/v)). The cells were disrupted by repeated freeze/thaw cycles and centrifuged, the supernatant was collected, and protein concentration in the supernatant was measured using the Bradford reagent (Bio-Rad).
Persulfide analysis in live cells
HT29 cells were cultured in RPMI 1640 medium supplemented with 10% FBS, 1% penicillin/streptomycin, and 2 mm glutamine in a 37 °C incubator with an atmosphere of 5% CO2, 95% air. To assess persulfide levels in live cells in response to exogenous Na2S, the fluorescent probe SSP4 (Sulfane Sulfur Probe 4, Dojindo Molecular Technologies) was used. Cells were plated on 35-mm glass-bottom dishes (MatTek Corp.) and cultured overnight. Then cells were either untreated or treated with 0.1 mm Na2S for 1 h followed by 15-min incubation in serum-free medium containing the surfactant hexadecyltrimethylammonium bromide (0.5 mm) and 10 μm SSP4. Analysis of cell fluorescence was carried out using an IX70 inverted fluorescence microscope (Center for Live Cell Imaging, University of Michigan), equipped with a ×100 magnification oil immersion objective (excitation, 482 nm; emission, 515 nm). Images were post-processed, and the fluorescence intensity was quantified using ImageJ software.
SILAC labeling and SQR-sensitive reactive cysteine modification
Metabolically light HT29SQRkd1 and heavy HT29SQRscr cells were generated by 6× passaging in SILAC DMEM (minus l-lysine and l-arginine) supplemented with 10% dialyzed FBS and 1% penicillin/streptomycin and either l-arginine (84 μg/ml), l-lysine (146 μg/ml) (light medium) or l-[6-13C,4-15N]arginine (84 μg/ml), l-[6-13C]lysine (146 μg/ml) (heavy medium). Complete isotopic incorporation was confirmed by MS. HT29 cells were grown at 37 °C under 5% CO2 in the appropriate SILAC medium supplemented with 10% FBS (Gibco) and 25 μg/ml amphotericin B, 10,000 units/ml penicillin, and 10,000 μg/ml streptomycin (Gibco). Once cells reached 100% confluence, they were harvested by scraping followed by centrifugation at 1,000 × g. The cell pellet was washed with PBS and then with roughly one pellet volume of mitochondrial isolation buffer (10 mm Tris (diluted from 100 mm Tris stock adjusted to pH 7.4 with MOPS powder), 1 mm EDTA (diluted from 100 mm EDTA stock adjusted to pH 7.4 with Tris powder), 200 mm sucrose, pH 7.4). Mitochondria were isolated as described previously (37). Briefly, cell pellets were resuspended in 10 volumes of mitochondrial isolation buffer and homogenized with 30 strokes of a Teflon pestle in a prechilled glass homogenizer. The homogenate was centrifuged at 600 × g for 10 min at 4 °C. The supernatant was collected and centrifuged twice at 600 × g for 10 min at 4 °C, discarding the pellet between spins. The supernatant was then spun at 12,500 × g for 10 min at 4 °C. The pellet was collected and washed two times in 1–2 pellet volumes of mitochondrial isolation buffer with a 10-min, 10,500 × g centrifugation at 4 °C after each wash.
For analysis of cysteine reactivity, purified mitochondria were treated with 100 μm IA-alkyne in PBS for 1 h at 25 °C and then lysed by sonication and appended with a chemically cleavable diazobenzene biotin-azide tag (Click Chemistry Tools, Scottsdale, AZ) by copper-assisted azide-alkyne cycloaddition chemistry as described previously (21). Light HT29SQRkd1- and heavy HT29SQRscr-labeled mitochondrial lysates were then combined pairwise and centrifuged for 10 min at 4 °C to pellet precipitated protein. The pellet was resuspended by sonication in ice-cold methanol. After centrifugation, a second ice-cold methanol wash was performed, and the protein pellet was then resuspended by sonication in 1 ml of 1.2% SDS in PBS. Samples were heated for 5 min at 80 °C to fully solubilize protein and then centrifuged to remove copper. The solubilized protein samples were then combined with 5 ml of PBS (0.2% final SDS concentration) and 100 μl of streptavidin-agarose beads. Samples were incubated at 4 °C overnight and then at 25 °C for 2–3 h. The samples were centrifuged at 1,400 × g for 3 min and resuspended in 500 μl of 6 m urea and 10 mm DTT and heated at 65 °C for 15 min. Iodoacetamide (20 mm) was added, and the samples were incubated at 37 °C for 30 min. The urea concentration was adjusted to 2 m with PBS, and the beads were centrifuged and resuspended in 200 μl of 2 m urea in PBS, 1 mm CaCl2 and 2 μg of trypsin. Protein digestion was allowed to proceed overnight at 37 °C. The unlabeled peptide digests were discarded, and the beads were washed three times in PBS and three times in water. The beads were then incubated with 50 μl of 50 mm sodium dithionite in PBS, at 25 °C for 1 h with gentle agitation by rotation. After centrifugation, the supernatant was collected and saved. The beads were washed twice more with 75 μl of 50 mm sodium dithionite, and all of the collected supernatant fractions were combined. The beads were washed twice more with 75 μl of water, and the supernatant fractions were combined with the previous fractions for a total sample volume of 350 μl. To the combined supernatant fractions, 17.5 μl of formic acid was added, and the samples were stored at −20 °C.
For determination of protein abundance, 50 μg each of light HT29SQRkd1 and heavy HT29SQRscr mitochondrial lysate was combined and precipitated by the addition of 5 μl of 100% TCA and incubation at −80 °C for 1 h. The protein pellet was collected by centrifugation and, after being washed with 500 μl of ice-cold acetone, was resuspended in 30 μl of 8 m urea in PBS, 70 μl of 100 mm ammonium bicarbonate, and 1.5 μl of 1 m DTT. The sample was heated at 65 °C for 15 min, after which 2.5 μl of 500 mm iodoacetamide was added, and the sample was incubated at 25 °C for 30 min. After incubation, 120 μl of PBS, 2 μg of trypsin, and 2.5 μl of 100 mm CaCl2 was added to the protein sample. Protein digestion was allowed to proceed overnight at 37 °C with gentle shaking. The solution was acidified with 10 μl of formic acid and undigested protein precipitated by centrifugation before the sample was stored at −20 °C.
MS analysis was performed using a Thermo LTQ Orbitrap Discovery mass spectrometer coupled to an Agilent 1200 series HPLC. Labeled peptide samples were pressure-loaded onto a 250-μm fused silica desalting column packed with 4 cm of Aqua C18 reverse phase resin (Phenomenex). Peptides were eluted onto a 100-μm fused silica biphasic column packed with 10-cm C18 resin and 4-cm Partisphere strong cation-exchange resin (SCX, Whatman), using a five-step multidimensional LC/LC-MS/MS protocol (MudPIT) (38, 39). Each of the five steps used a salt push (0, 50, 80, 100, and 100% for labeled peptides and 0, 25, 50, 80, and 100% for tryptic peptides), followed by a gradient of 5–100% buffer B (20% water, 80% acetonitrile, 0.1% formic acid) in Buffer A (95% water, 5% acetonitrile, 0.1% formic acid). The flow rate through the column was ∼0.25 μl/min, with a spray voltage of 2.75 kV. One full MS1 scan (m/z 400–1,800) was followed by eight data-dependent scans of the nth most intense ion. Dynamic exclusion was enabled.
The tandem MS data, generated from the five MudPIT runs, was analyzed by the SEQUEST algorithm (40). Static modification of cysteine residues (+57.0215 m/z, iodoacetamide alkylation) was assumed with no enzyme specificity. The precursor ion mass tolerance was set at 50 ppm, whereas the fragment ion mass tolerance was set to 0 (default setting). Data were searched against a human reverse-concatenated nonredundant FASTA database containing Uniprot identifiers. For tryptic protein abundance data, independent searches for SILAC static modifications on lysine and arginine for either light (0.0 and 0.0) or heavy (6.02013 and 10.00826) peptides were performed. MS2 spectra matches were assembled into protein identifications and filtered using DTASelect2.0 (41) to generate a list of protein hits with a peptide false discovery rate of <5%. For cysteine-targeted data, a differential cysteine modification was allowed for the commercial diazo biotin-azide tag (+258.1481), with peptides restricted to fully tryptic (−y 2) with a found modification (−m 0) and a ΔCN score greater than 0.06 (−d 0.06). Single peptides per locus were also allowed (−p 1), as were redundant peptide identifications from multiple proteins, but the database contained only a single consensus splice variant for each protein. L/H ratios were calculated using the cimage quantification package described previously (42).
Label-free targeted triple-quadrupole (QqQ) metabolomics analysis
Targeted metabolomics was performed as described (43). Briefly, an Agilent 1290 UHPLC and 6490 QqQ mass spectrometer (LC-MS) were used for label-free targeted metabolomics. Agilent MassHunter Optimizer and Workstation Software LC/MS Data Acquisition for 6400 Series Triple Quadrupole B.08.00 were used for standard optimization and data acquisition. Agilent MassHunter Work station Software Quantitative Analysis version B.0700 for QqQ was used for raw data processing and initial analysis.
For reversed-phase chromatography, a Waters Acquity UPLC BEH TSS C18 column (2.1 × 100 mm, 1.7 μm) was used with mobile phase A consisting of 0.5 mm NH4F and 0.1% formic acid in water; mobile phase B consisted of 0.1% formic acid in acetonitrile. The following gradient was used: mobile phase B was held at 1% for 1.5 min, increased to 80% in 15 min and then to 99% in 17 min, and held for 2 min before returning to the initial conditions and held for 10 min. For hydrophilic interaction chromatography, a Waters Acquity UPLC BEH amide column (2.1 × 100 mm, 1.7 μm) was used with mobile phase A consisting of 20 mm ammonium acetate in water at pH 9.6; mobile phase B consisted of acetonitrile. The following gradient was used: mobile phase B was held at 85% for 1 min, decreased to 65% in 12 min and then to 40% in 15 min, and held for 5 min before returning to the initial conditions and held for 10 min.
Both columns were at 40 °C, and 3 μl of each sample was injected into the LC-MS with a flow rate of 0.2 ml/min. Calibration of TOF MS was achieved through Agilent ESI-Low Concentration Tuning Mix. Optimization was performed on the 6490 QqQ in the positive or negative mode for the reversed-phase chromatography or hydrophilic interaction chromatography, respectively, for each of 220 standard compounds to get the best fragment ion and other MS parameters for each compound. Retention time for each of the 220 standards was measured from a pure standard solution or a mixture of standards. The LC-MS/MS method was created with dynamic multiple-reaction monitoring with retention times, retention time windows, and multiple-reaction monitoring for all 220 standard compounds. Key parameters of AJS ESI in both the positive and the negative acquisition modes are as follows: Gas temperature, 275 °C; gas flow, 14 liters/min; nebulizer at 20 p.s.i.; SheathGasHeater, 250 °C; SheathGasFlow, 11 liters/min; and capillary, 3000 V. For MS, Delta EMV 200 or 350 V for the positive or negative acquisition mode, respectively, and cycle time of 500 ms and Cell accelerator voltage 4 V for both modes were used.
For data analysis, the preprocessed data with Agilent MassHunter Workstation Software Quantitative Analysis were postprocessed for further quality control in the programming language R. We calculated the coefficient of variation (CV) across replicate samples for each metabolite given a cut-off value of peak areas in both the positive and the negative modes. We then compared distributions of CVs for the whole data set for a set of peak area cut-off values of 0, 1,000, 5,000, 10,000, 15,000, 20,000, 25,000, and 30,000 in each mode. A noise cut-off value of peak areas in each mode was chosen by manual inspection of the CV distributions. Each sample was then normalized by the total intensity of all metabolites to reflect the same protein content as a normalization factor. We then retained only those metabolites with at least two replicate measurements. The remaining missing value in each condition for each metabolite was filled with the median of the other replicate measurements. Finally, each metabolite abundance value in each sample was divided by the mean of all abundance values across all samples for statistical analyses and visualizations among metabolites. The statistical significance test was done by a two-tailed t test with a significance threshold of 0.05 for those metabolites filtered with CV <1 for all conditions. The p values were not adjusted in favor of more flexible biological interpretation for downstream analysis.
NAD+/NADH measurement
The NAD+/NADH ratio in HT29 cells (in control, HT29SQRkd1, and HT29SQRscr) and HCECs was measured using the NAD/NADH-Glo Assay (Promega) luminescence assay with slight modifications. Briefly, cells were plated in 12-well plates and grown overnight in an atmosphere containing 2% O2, 5% CO2, and 93% N2 at 37 °C. Then the medium was changed before the cells were treated with 0.1 mm Na2S at 0 and 3 h and harvested at 4 h. The untreated and Na2S-treated cells were quickly washed twice with cold PBS. Then 200 μl of ice-cold lysis buffer containing 1% hexadecyltrimethylammonium bromide in 0.2 n NaOH diluted 1:1 with cold PBS was added, and the samples were divided into two equal aliquots for NAD+ and NADH analysis.
For NAD+ measurement, samples were diluted 1:1 with 0.4 n HCl solution and incubated at 60 °C for 15 min to degrade NADH. To measure NADH, the samples were heated at 60 °C for 15 min to selectively degrade NAD+. Then NADH and NAD+ samples were incubated at room temperature for 10 min and mixed 1:1 with 0.25 m Tris base in 0.2 n HCl for the NADH sample and 1:1 with 0.5 m Tris base for NAD+. The NAD/NADH-Glo detection reagent was added to each sample (1:1 v/v) and incubated at room temperature for 30 min. A luminometer was used to record luminescence.
Cell proliferation assay
Cell proliferation rate was assessed in an oxygen-regulated incubator containing an atmosphere of 2% O2, 5% CO2 and 93% N2. Briefly, 5 × 10⁴ cells were cultured in 6-well plates containing RPMI 1640 medium with 2 mm glutamine, 10% FBS, and 1% penicillin/streptomycin. After 15 h, 0.1 or 0.3 mm Na2S (as specified in the figure legend) was added every 12 h for 72 h. The culture medium was changed every 24 h. To rescue cells from Na2S-dependent growth restriction, the culture medium was supplemented with 100 μm uridine, pyruvate, and/or 10 mm aspartate as specified in the figure legend. Cells proliferation was measured using the colorimetric 3-(4,5-dimethylthiazol-2-yl)-2,5-diphenyltetrazolium (MTT) assay. For this, MTT (5 mg/ml in PBS) was added at the desired time point to each well at a dilution of 1:10, and incubation was continued at 37 ºC for 30 min. Then the medium was aspirated, and 1 ml of DMSO was added per well to dissolve formazan, formed by MTT reduction. The optical density of formazan in DMSO, proportional to cell number, was measured at 553 nm. Absorption was normalized to cell number in each well at the time of seeding.
Tracing citrate formation from [U-13C]glutamine
HT29 cells were grown to ∼80% confluence in 6-well plates in RPMI 1640 medium (2 mm glutamine, 10% FBS, 1% penicillin/streptomycin) and then transferred to glutamine-free DMEM containing 10% dialyzed FBS, 1% penicillin/streptomycin and supplemented with 2 mm [U-13C]glutamine (Cambridge Isotope Laboratories). Cells were cultured in an incubator with an atmosphere of 2% O2, 5% CO2, and 93% N2. Cells were either untreated or treated at 0, 3, 6, 9, and 12 h with 0.1 mm Na2S. After 13 h of incubation, 1 ml of 80% cold methanol (−80 °C) was added to each well, and the cells were incubated at −80 °C for 10 min followed by centrifugation at 14,000 × g for 10 min at 4 °C. The supernatants were lyophilized in a SpeedVac and resuspended in 20 μl of LC-MS grade water for LC-MS analysis.
For LC-MS analysis, an Agilent 1260 UHPLC and 6520 Accurate-Mass Q-TOF LC/MS were used as described previously (44). Agilent MassHunter Workstation Software LC/MS Data Acquisition for 6200 series TOF/6500 series Q-TOF (B.06.01) was used for calibration and data acquisition. In the negative ion MS acquisition mode, a Waters Acquity UPLC BEH amide column (2.1 × 100 mm, 1.7 μm) was used with mobile phase A consisting of 20 mm NH4OAc in water at pH 9.6 and mobile phase B consisting of acetonitrile. The gradient program was as follows: mobile phase B held at 85% for 1 min, decreased to 65% in 12 min and then to 40% in 15 min, and held for 5 min before going to the initial condition and held for 10 min. The column was maintained at 40 °C, and 3 μl of each sample was injected into the LC-MS with a flow rate of 0.2 ml/min. Calibration of TOF MS was achieved through Agilent ESI-Low Concentration Tuning Mix. Key parameters were as follows: acquisition rate, 1 spectrum/s; mass range, 100–1200 Da; gas temperature, 350 °C; fragmentor, 150 V; skimmer, 65 V; drying gas, 10 liters/min; nebulizer at 20 p.s.i.; and Vcap = 3,500 V. Reference ions of 119.0363 and 980.01637 Da were used for real time mass calibration with a nebulizer at 4 psi. The reference solution comprised 10 μm purine and 1 μm HP0921.
In the positive MS acquisition mode, a Waters Acquity UPLC BEH TSS C18 column (2.1 × 100 mm, 1.7 μm) was used with mobile phase A consisting of 0.5 mm NH4F and 0.1% formic acid in water and mobile phase B consisting of 0.1% formic acid in acetonitrile. The gradient program was as follows: mobile phase B held at 1% for 1.5 min, increased to 20% in 15 min and then to 99% in 17 min, and held for 2 min before going to the initial condition and held for 10 min. The column was maintained at 40 °C, and 3 μl of each sample was injected into the LC-MS with a flow rate of 0.2 ml/min. Calibration of TOF MS was achieved through Agilent ESI-Low Concentration Tuning Mix. Key parameters were as follows: mass range, 100–1200 Da; gas temperature, 350 °C; fragmentor, 150 V; skimmer, 65 V; drying gas, 10 liters/min; nebulizer at 20 p.s.i.; Vcap = 3,500 V. Reference ions of 121.0509 and 922.0098 Da were used for real-time mass calibration with the nebulizer at 4 p.s.i. For data analysis, Agilent MassHunter Workstation Software Profinder B.08.00 with Batch Targeted Feature Extraction and Batch Isotopologue Extraction and Qualitative Analysis B.07.00 were used. Various parameter combinations (e.g. mass and RT tolerance) were used to find best peaks and signals by manual inspection. Key parameters were as follows: mass tolerance = 20 or 10 ppm and retention time tolerance of 1 or 0.5 min. For isotopologue ion thresholds, the anchor ion height threshold was set to 250 counts, and the threshold of the sum of ion heights was set to 500 counts. The coelution correlation threshold was set to 0.3.
Measurement of cardiolipin content
Mitochondrial cardiolipin content was determined using nonyl acridine orange (NAO) (AnaSpec, San Jose, CA). Briefly, 1 × 10⁶ cells were grown in phenol-free DMEM and were treated with 100 nm NAO for 30 min. Cells were washed with cold PBS and trypsinized with phenol-free trypsin, centrifuged at 500 × g for 5 min, resuspended in cold PBS on ice, and analyzed by FACS.
Author contributions
M. L. performed IHC, proliferation, SQR knockdown, and metabolic labeling experiments; M. L. and V. V. analyzed NAD+/NADH; T. B. and V. V. performed the OCR experiments; D. B. and E. W. performed and analyzed the mitochondrial oxidative cysteine-labeling experiments; H. J. L. and C. L. analyzed the metabolomics data; N. S. and E. F. assisted with the human colonic IHC and SQR knockdown experiments; M. L. and R. B. designed the study and co-wrote the manuscript, which was edited by the coauthors.
Supplementary Material
Acknowledgments
We acknowledge Dr. Thomas Giordano (Tissue and Molecular Pathology Core, University of Michigan) for the human colon samples. We also acknowledge Dr. Li Zhang (University of Michigan) for the metabolomics analysis.
This research was supported in part by National Institutes of Health Grant GM130183 (to R. B). Metabolomics studies performed at the University of Michigan were supported by National Institutes of Health Grant DK097153, the Charles Woodson Research Fund, and the University of Michigan Pediatric Brain Tumor Initiative. The authors declare that they have no conflicts of interest with the contents of this article. The content is solely the responsibility of the authors and does not necessarily represent the official views of the National Institutes of Health.
This article contains Table S1 and Figs. S1 and S2.
- SQR
- sulfide quinone oxidoreductase
- CoQ
- coenzyme Q
- CRC
- colorectal cancer
- ETC
- electron transfer chain
- OCR
- oxygen consumption rate
- HCEC
- human colonic epithelial cell
- TCA
- tricarboxylic acid
- ABC
- avidin–biotin complex
- RIPA
- radioimmune precipitation assay
- DMEM
- Dulbecco's modified Eagle's medium
- CV
- coefficient of variation
- MTT
- 3-(4,5-dimethylthiazol-2-yl)-2,5-diphenyltetrazolium
- NAO
- nonyl acridine orange
- QqQ
- triple-quadrupole.
References
- 1. Magee E. A., Richardson C. J., Hughes R., and Cummings J. H. (2000) Contribution of dietary protein to sulfide production in the large intestine: an in vitro and a controlled feeding study in humans. Am. J. Clin. Nutr. 72, 1488–1494 10.1093/ajcn/72.6.1488 [DOI] [PubMed] [Google Scholar]
- 2. Turnbaugh P. J., and Gordon J. I. (2009) The core gut microbiome, energy balance and obesity. J. Physiol. 587, 4153–4158 10.1113/jphysiol.2009.174136 [DOI] [PMC free article] [PubMed] [Google Scholar]
- 3. Macfarlane G. T., Gibson G. R., and Cummings J. H. (1992) Comparison of fermentation reactions in different regions of the human colon. J. Appl. Bacteriol. 72, 57–64 10.1111/j.1365-2672.1992.tb04882.x [DOI] [PubMed] [Google Scholar]
- 4. Deplancke B., Finster K., Graham W. V., Collier C. T., Thurmond J. E., and Gaskins H. R. (2003) Gastrointestinal and microbial responses to sulfate-supplemented drinking water in mice. Exp. Biol. Med. (Maywood) 228, 424–433 10.1177/153537020322800413 [DOI] [PubMed] [Google Scholar]
- 5. Libiad M., Yadav P. K., Vitvitsky V., Martinov M., and Banerjee R. (2014) Organization of the human mitochondrial H2S oxidation pathway. J. Biol. Chem. 289, 30901–30910 10.1074/jbc.M114.602664 [DOI] [PMC free article] [PubMed] [Google Scholar]
- 6. Hildebrandt T. M., and Grieshaber M. K. (2008) Three enzymatic activities catalyze the oxidation of sulfide to thiosulfate in mammalian and invertebrate mitochondria. FEBS J. 275, 3352–3361 10.1111/j.1742-4658.2008.06482.x [DOI] [PubMed] [Google Scholar]
- 7. Nicholls P., and Kim J. K. (1982) Sulphide as an inhibitor and electron donor for the cytochrome c oxidase system. Can. J. Biochem. 60, 613–623 10.1139/o82-076 [DOI] [PubMed] [Google Scholar]
- 8. Linden D. R. (2014) Hydrogen sulfide signaling in the gastrointestinal tract. Antioxid. Redox Signal. 20, 818–830 10.1089/ars.2013.5312 [DOI] [PMC free article] [PubMed] [Google Scholar]
- 9. King M. P., and Attardi G. (1989) Human cells lacking mtDNA: repopulation with exogenous mitochondria by complementation. Science 246, 500–503 10.1126/science.2814477 [DOI] [PubMed] [Google Scholar]
- 10. Sullivan L. B., Gui D. Y., Hosios A. M., Bush L. N., Freinkman E., and Vander Heiden M. G. (2015) Supporting aspartate biosynthesis is an essential function of respiration in proliferating cells. Cell 162, 552–563 10.1016/j.cell.2015.07.017 [DOI] [PMC free article] [PubMed] [Google Scholar]
- 11. Birsoy K., Wang T., Chen W. W., Freinkman E., Abu-Remaileh M., and Sabatini D. M. (2015) An essential role of the mitochondrial electron transport chain in cell proliferation is to enable aspartate synthesis. Cell 162, 540–551 10.1016/j.cell.2015.07.016 [DOI] [PMC free article] [PubMed] [Google Scholar]
- 12. Koppenol W. H., Bounds P. L., and Dang C. V. (2011) Otto Warburg's contributions to current concepts of cancer metabolism. Nat. Rev. Cancer 11, 325–337 10.1038/nrc3038 [DOI] [PubMed] [Google Scholar]
- 13. Warburg O., Posener K., and Negelein E. (1924) On the metabolism of carcinoma cells. Biochem. Z. 152, 309–344 [Google Scholar]
- 14. Harris M. (1980) Pyruvate blocks expression of sensitivity to antimycin A and chloramphenicol. Somatic Cell Genet. 6, 699–708 10.1007/BF01538969 [DOI] [PubMed] [Google Scholar]
- 15. Löffer M., and Schneider F. (1982) Further characterization of the growth inhibitory effect of rotenone on in vitro cultured Ehrlich ascites tumour cells. Mol. Cell Biochem. 48, 77–90 [DOI] [PubMed] [Google Scholar]
- 16. Libiad M., Motl N., Akey D. L., Sakamoto N., Fearon E. R., Smith J. L., and Banerjee R. (2018) Thiosulfate sulfurtransferase-like domain-containing 1 protein interacts with thioredoxin. J. Biol. Chem. 293, 2675–2686 10.1074/jbc.RA117.000826 [DOI] [PMC free article] [PubMed] [Google Scholar]
- 17. Lagoutte E., Mimoun S., Andriamihaja M., Chaumontet C., Blachier F., and Bouillaud F. (2010) Oxidation of hydrogen sulfide remains a priority in mammalian cells and causes reverse electron transfer in colonocytes. Biochim. Biophys. Acta 1797, 1500–1511 10.1016/j.bbabio.2010.04.004 [DOI] [PubMed] [Google Scholar]
- 18. Mishanina T. V., Libiad M., and Banerjee R. (2015) Biogenesis of reactive sulfur species for signaling by hydrogen sulfide oxidation pathways. Nat. Chem. Biol. 11, 457–464 10.1038/nchembio.1834 [DOI] [PMC free article] [PubMed] [Google Scholar]
- 19. Vitvitsky V., Miljkovic J. L., Bostelaar T., Adhikari B., Yadav P. K., Steiger A. K., Torregrossa R., Pluth M. D., Whiteman M., Banerjee R., and Filipovic M. R. (2018) Cytochrome c reduction by H2S potentiates sulfide signaling. ACS Chem. Biol. 13, 2300–2307 10.1021/acschembio.8b00463 [DOI] [PMC free article] [PubMed] [Google Scholar]
- 20. Zhang D., Macinkovic I., Devarie-Baez N. O., Pan J., Park C. M., Carroll K. S., Filipovic M. R., and Xian M. (2014) Detection of protein S-sulfhydration by a tag-switch technique. Angew. Chem. Int. Ed. Engl. 53, 575–581 10.1002/anie.201305876 [DOI] [PMC free article] [PubMed] [Google Scholar]
- 21. Qian Y., Martell J., Pace N. J., Ballard T. E., Johnson D. S., and Weerapana E. (2013) An isotopically tagged azobenzene-based cleavable linker for quantitative proteomics. Chembiochem 14, 1410–1414 10.1002/cbic.201300396 [DOI] [PubMed] [Google Scholar]
- 22. Mustafa A. K., Gadalla M. M., Sen N., Kim S., Mu W., Gazi S. K., Barrow R. K., Yang G., Wang R., and Snyder S. H. (2009) H2S signals through protein S-sulfhydration. Sci. Signal. 2, ra72 10.1126/scisignal.2000464 [DOI] [PMC free article] [PubMed] [Google Scholar]
- 23. Mullen A. R., Wheaton W. W., Jin E. S., Chen P. H., Sullivan L. B., Cheng T., Yang Y., Linehan W. M., Chandel N. S., and DeBerardinis R. J. (2011) Reductive carboxylation supports growth in tumour cells with defective mitochondria. Nature 481, 385–388 10.1038/nature10642 [DOI] [PMC free article] [PubMed] [Google Scholar]
- 24. Metallo C. M., Gameiro P. A., Bell E. L., Mattaini K. R., Yang J., Hiller K., Jewell C. M., Johnson Z. R., Irvine D. J., Guarente L., Kelleher J. K., Vander Heiden M. G., Iliopoulos O., and Stephanopoulos G. (2011) Reductive glutamine metabolism by IDH1 mediates lipogenesis under hypoxia. Nature 481, 380–384 10.1038/nature10602 [DOI] [PMC free article] [PubMed] [Google Scholar]
- 25. Furne J., Saeed A., and Levitt M. D. (2008) Whole tissue hydrogen sulfide concentrations are orders of magnitude lower than presently accepted values. Am. J. Physiol. Regul. Integr. Comp. Physiol. 295, R1479–R1485 10.1152/ajpregu.90566.2008 [DOI] [PubMed] [Google Scholar]
- 26. Vitvitsky V., Kabil O., and Banerjee R. (2012) High turnover rates for hydrogen sulfide allow for rapid regulation of its tissue concentrations. Antioxid. Redox Signal. 17, 22–31 10.1089/ars.2011.4310 [DOI] [PMC free article] [PubMed] [Google Scholar]
- 27. Kabil O., and Banerjee R. (2010) The redox biochemistry of hydrogen sulfide. J. Biol. Chem. 285, 21903–21907 10.1074/jbc.R110.128363 [DOI] [PMC free article] [PubMed] [Google Scholar]
- 28. Kabil O., and Banerjee R. (2014) Enzymology of H2S biogenesis, decay and signaling. Antioxid. Redox Signal. 20, 770–782 10.1089/ars.2013.5339 [DOI] [PMC free article] [PubMed] [Google Scholar]
- 29. Paulsen C. E., and Carroll K. S. (2013) Cysteine-mediated redox signaling: chemistry, biology, and tools for discovery. Chem. Rev. 113, 4633–4679 10.1021/cr300163e [DOI] [PMC free article] [PubMed] [Google Scholar]
- 30. Filipovic M. R., Zivanovic J., Alvarez B., and Banerjee R. (2018) Chemical biology of H2S signaling through persulfidation. Chem. Rev. 118, 1253–1337 10.1021/acs.chemrev.7b00205 [DOI] [PMC free article] [PubMed] [Google Scholar]
- 31. Landry A. P., Ballou D. P., and Banerjee R. (2017) H2S oxidation by nanodisc-embedded human sulfide quinone oxidoreductase. J. Biol. Chem. 292, 11641–11649 10.1074/jbc.M117.788547 [DOI] [PMC free article] [PubMed] [Google Scholar]
- 32. Libiad M., Sriraman A., and Banerjee R. (2015) Polymorphic variants of human rhodanese exhibit differences in thermal stability and sulfur transfer kinetics. J. Biol. Chem. 290, 23579–23588 10.1074/jbc.M115.675694 [DOI] [PMC free article] [PubMed] [Google Scholar]
- 33. Gao X. H., Krokowski D., Guan B. J., Bederman I., Majumder M., Parisien M., Diatchenko L., Kabil O., Willard B., Banerjee R., Wang B., Bebek G., Evans C. R., Fox P. L., Gerson S. L., et al. (2015) Quantitative H2S-mediated protein sulfhydration reveals metabolic reprogramming during the integrated stress response. Elife 4, e10067 10.7554/eLife.10067 [DOI] [PMC free article] [PubMed] [Google Scholar]
- 34. Dóka É., Pader I., Bíró A., Johansson K., Cheng Q., Ballagó K., Prigge J. R., Pastor-Flores D., Dick T. P., Schmidt E. E., Arnér E. S., and Nagy P. (2016) A novel persulfide detection method reveals protein persulfide- and polysulfide-reducing functions of thioredoxin and glutathione systems. Sci. Adv. 2, e1500968 10.1126/sciadv.1500968 [DOI] [PMC free article] [PubMed] [Google Scholar]
- 35. Ramsden J. D., Cocks H. C., Shams M., Nijjar S., Watkinson J. C., Sheppard M. C., Ahmed A., and Eggo M. C. (2001) Tie-2 is expressed on thyroid follicular cells, is increased in goiter, and is regulated by thyrotropin through cyclic adenosine 3′,5′-monophosphate. J. Clin. Endocrinol. Metab. 86, 2709–2716 10.1210/jcem.86.6.7552 [DOI] [PubMed] [Google Scholar]
- 36. Edge S. B., Byrd D. R., Compton C. C., Fritz A. G., Greene F. L., and Trotti A. (2010) AJCC Cancer Staging Manual, 7th Ed., 143–164, Springer, New York [Google Scholar]
- 37. Bak D. W., Pizzagalli M. D., and Weerapana E. (2017) Identifying functional cysteine residues in the mitochondria. ACS Chem. Biol. 12, 947–957 10.1021/acschembio.6b01074 [DOI] [PMC free article] [PubMed] [Google Scholar]
- 38. Weerapana E., Speers A. E., and Cravatt B. F. (2007) Tandem orthogonal proteolysis-activity-based protein profiling (TOP-ABPP)–a general method for mapping sites of probe modification in proteomes. Nat. Protoc. 2, 1414–1425 10.1038/nprot.2007.194 [DOI] [PubMed] [Google Scholar]
- 39. Speers A. E., and Cravatt B. F. (2005) A tandem orthogonal proteolysis strategy for high-content chemical proteomics. J. Am. Chem. Soc. 127, 10018–10019 10.1021/ja0532842 [DOI] [PMC free article] [PubMed] [Google Scholar]
- 40. Eng J. K., McCormack A. L., and Yates J. R. (1994) An approach to correlate tandem mass spectral data of peptides with amino acid sequences in a protein database. J. Am. Soc. Mass Spectrom. 5, 976–989 10.1016/1044-0305(94)80016-2 [DOI] [PubMed] [Google Scholar]
- 41. Eng J. K., Fischer B., Grossmann J., and Maccoss M. J. (2008) A fast SEQUEST cross correlation algorithm. J. Proteome Res. 7, 4598–4602 10.1021/pr800420s [DOI] [PubMed] [Google Scholar]
- 42. Weerapana E., Wang C., Simon G. M., Richter F., Khare S., Dillon M. B., Bachovchin D. A., Mowen K., Baker D., and Cravatt B. F. (2010) Quantitative reactivity profiling predicts functional cysteines in proteomes. Nature 468, 790–795 10.1038/nature09472 [DOI] [PMC free article] [PubMed] [Google Scholar]
- 43. Lee H.-J., Kremer D. M., Sajjkulnukit P., Zhang L., and Lyssiotis C. A. (2019) Meta-analysis of targeted metabolomics data from heterogeneous biological samples provides insights into metabolite dynamics. bioRXiv 509372 10.1101/509372 [DOI] [PMC free article] [PubMed] [Google Scholar]
- 44. Ying H., Kimmelman A. C., Lyssiotis C. A., Hua S., Chu G. C., Fletcher-Sananikone E., Locasale J. W., Son J., Zhang H., Coloff J. L., Yan H., Wang W., Chen S., Viale A., Zheng H., et al. (2012) Oncogenic Kras maintains pancreatic tumors through regulation of anabolic glucose metabolism. Cell 149, 656–670 10.1016/j.cell.2012.01.058 [DOI] [PMC free article] [PubMed] [Google Scholar]
Associated Data
This section collects any data citations, data availability statements, or supplementary materials included in this article.


