

SUMMARY
SETTING:
Accurate testing and treatment for latent tuberculosis infection is necessary for tuberculosis elimination. Certain parasite infections are associated with increased tuberculin skin test positivity; species-specific effects on QuantiFERON-TB Gold In-Tube (QGIT) are not yet described.
OBJECTIVE:
We sought to determine whether infection with helminths or protozoa affects QGIT results.
DESIGN:
We retrospectively analyzed QGIT and parasite testing results for immigrants screened in Boston from 2012–2017. We also prospectively measured cytokines in QGIT supernatants for a subset (n=68) with 1) helminths, 2) Blastocystis hominis, 3) other protozoa, and 4) no parasites.
RESULTS:
Of 527 immigrants screened, 141 (26.8%) had a positive QGIT and 229 (43.4%) had parasites detected: 27/527 (5.1%) helminths and 202/527 (38.3%) protozoa. Cytokine analysis revealed increased IL-10 concentrations with protozoa (p=0.04), and non-significantly higher Th2 concentrations with helminths compared to no parasites. No significant differences emerged in QGIT positivity or interferon-gamma concentrations in any group.
CONCLUSION:
This study supports use of QGITs in parasite-endemic settings.
Keywords: Interferon-gamma release assays, Mycobacterium tuberculosis, tuberculosis diagnosis, cytokines, host-parasite interactions
INTRODUCTION
In 2015, the World Health Organization (WHO) released a blueprint for tuberculosis (TB) elimination worldwide1. Pillars of this proposal included improving diagnosis and treatment of TB disease and latent tuberculosis infection (LTBI). Addressing the LTBI reservoir requires understanding whether comorbidities (e.g., diabetes mellitus, parasite infections) increase LTBI risk or progression from LTBI to TB. To evaluate such associations, we must assess the accuracy of diagnostic tests for LTBI in the presence of conditions that may affect host immune response and diagnostic test function.
Helminths are prevalent in 28/30 high TB-burden countries, and studies have suggested parasites affect tuberculin skin test (TST) positivity2–7. Increased odds of TST positivity was observed with hookworm-infected individuals and decreased odds with non-invasive Trichuris trichiura and Giardia lamblia3,4. Less is known about other protozoa such as Blastocystis hominis. The potential association between parasites and LTBI may reflect host immune response8–10. Tissue-invasive helminths, including Strongyloides stercoralis, promote a T-helper 2 (Th2) response and suppress the Th1 response needed to control Mycobacterium tuberculosis (MTB) infection8. This cytokine response reverts after treatment for S. stercoralis9,11. In mice, the lung Th2 response induced by invasive Nippostongylus brasiliensis enhanced susceptibility to MTB by promoting MTB-permissive M2 macrophages10. Mice infected with non-invasive Heligmosomoides polygyrus had no such differential disease burden or regulatory cell responses.
Most low-incidence countries have shifted from TST towards interferon gamma release assays (IGRAs) such as QuantiFERON-TB Gold In-Tube (QGIT) for LTBI screening, especially in individuals with BCG exposure1,12. Studies are needed to identify conditions associated with false negative IGRAs such as human immunodeficiency virus (HIV), diabetes mellitus, low body mass index (BMI), and older age13–15. Strong induction of Th2 response and inhibition of Th1 in helminth-infected individuals could affect interferon gamma (IFN-γ) levels and IGRA reliability. The impact of parasites on IGRA testing remains unknown and is relevant in endemic countries and for immigrant screening. We sought to 1) investigate the epidemiologic association between QGIT results and parasite infections in a retrospective review and 2) in a prospective study characterize cytokine response to MTB with helminth and protozoal infections.
STUDY POPULATION AND METHODS
Epidemiologic Study
We retrospectively reviewed de-identified data for all refugees and asylum-seekers (henceforth collectively referred to as immigrants) seen at Boston Medical Center (BMC) and screened through Massachusetts Department of Public Health Refugee Health Assessment Program (RHAP) from October 2012-July 2017. Laboratory tests performed through RHAP include complete blood count (CBC) with differential and screening for HIV and LTBI. QGIT replaced TST in late 2012 and was used routinely starting January 2013. All immigrants were screened for parasites with stool antigen testing for Cryptosporidium parvum and G. lamblia; stool microscopy was performed before 2014, after which it was used selectively because of increased pre-departure parasite treatment16,17. If prompted by suggestive signs or symptoms (e.g., eosinophilia), clinicians could order parasite serologic testing, performed preferentially at the National Institutes of Health (NIH) for filaria and the Centers for Disease Control and Prevention (CDC) for other helminths.
We collected demographic, medical, and laboratory data for eligible individuals through the electronic health record. Data included countries of birth and residence, days from arrival in the United States (U.S.) until first RHAP visit, documented pre-departure anti-helminthic therapy, BMI, and tobacco and alcohol use. We excluded individuals without QGIT or stool microscopy results.
Immunology Study
For inclusion in the immunology study, we prospectively recruited individuals from January 2016-November 2017 from primary care and specialty clinics at BMC that see many immigrants. Inclusion criteria were: 1) non-US born, 2) screened with QGIT 3) screened for parasitic infections with stool testing, and 4) language fluency in English or any of ten languages*. Individuals were excluded for 1) age <five years (as QGITs were not recommended), 2) failure to complete QGIT or parasite screening, or 3) QGIT collected >21 days prior (due to sample processing limitations). Stool ova and parasite microscopy was performed, if not already completed. Relevant results were reported to the patient’s physician for treatment.
Measurement of Outcomes:
We classified QGIT results as positive (IFN-γ ≥0.35 IU/mL) or negative (<0.35 IU/mL), and as a continuous variable12. The laboratory reports exact results to 10 IU/mL and higher values as >10 IU/mL (which were assigned a value of 11).
We defined eosinophilia as absolute eosinophil count ≥500 cells/μL and TB incidence by country of origin18. For pre-departure anti-helminthic treatment, missing values were imputed from CDC country-specific policy for refugees16,17. We assumed individuals arriving in the US ≥12 weeks before their first visit were asylum seekers and not refugees, as RHAP visits occur within 12 weeks of immigration for refugees16. We assumed asylees were not empirically treated for helminthic infections as most asylum-seekers do not have pre-immigration health screening. We categorized BMI as underweight (<18.5 kg/m2 for adults, <5th percentile by CDC age- and sex-specific growth curves for children <18 years), normal weight (18.5–25 kg/m2 or 5th-85th percentile), and overweight (>25 kg/m2 or >85th percentile).
Cytokine Analysis:
Supernatants of QGIT samples from nil (control) and MTB antigen-stimulated tubes were stored at −80° C. Cytokines in the supernatants were measured using a multiplex cytokine panel (V plex pro-inflammatory panel 1 human kit) from Meso Scale Discovery (MSD) (Rockville, MD, USA). Plates were read on the MSD detector (MESO Quickplex SQ120). Calibration curve and analyte concentration calculations were performed using MSD DISCOVERY WORKBENCH® analysis software.
Statistical Analysis:
Data were analyzed using SAS 9.4 (SAS Institute Inc., Cary, NC, USA). We used the Student t-test or one-way analysis of variance (ANOVA) to describe continuous, normally distributed and χ2 or Fisher’s exact test for categorical normally distributed demographic characteristics, and Kruskal-Wallis or Wilcoxon Rank Sum for non-normally distributed variables and cytokine distributions given small sample sizes. For the epidemiology study, we employed multivariable logistic regression to examine the association between parasites and QGIT results, retaining variables causing change in effect size >10% for final model selection. For this model and immunology analyses, we compared those with: 1) helminths, 2) B. hominis, 3) other protozoa, and 4) no parasites. Those with indeterminate QGITs (n=5) or mixed B. hominis and other protozoa (n=51) were excluded from the model to isolate the effect on immune response. Given missing observations for alcohol and tobacco use, HIV, and pregnancy, we performed multiple imputation analysis using fully conditional specification creating 20 imputed datasets from all Table 1 variables to predict missing values. We separately performed multiple logistic regression on imputed data.
Table 1:
Demographic characteristics for epidemiology study of immigrants with completed QuantiFERON-TB Gold In-Tube and parasite screening, October 2012 - July 2017, Boston
| Characteristic | QGIT positive |
QGIT negative |
QGIT indeterminate |
Total | p-value† |
|---|---|---|---|---|---|
| n=141 (%) | n=381 (%) | n=5 (%) | n=527 (%) | ||
| Mean age, years (SD) | 36.2 (13.9)* | 28.0 (14.5) | 25.8 (11.5) | 30.2 (14.8) | <0.0001 |
| Age | |||||
| Children (<18yo) | 7 (5.0) | 103 (27.0) | 1 (20) | 111 (21.1) | <0.0001 |
| Adults (≥18yo) | 134 (95.0) | 278 (73.0) | 4 (80) | 416 (78.9) | |
| Time since arrival in US | |||||
| <12 weeks | 126 (89.4) | 353 (92.6) | 4 (80) | 483 (91.7) | 0.22 |
| ≥12 weeks | 15 (10.6) | 28 (7.4) | 1 (20) | 44 (8.3) | |
| Sex | |||||
| Male | 93 (66.0) | 212 (55.6) | 2 (40) | 307 (58.2) | 0.03 |
| Female | 48 (34.0) | 169 (44.4) | 3 (60) | 220 (41.7) | |
| BMI (N=526) | |||||
| Underweight‡ | 6 (4.3) | 28 (7.4) | 1 (20) | 35 (6.6) | 0.002 |
| Normal weight | 55 (39.3) | 204 (53.5) | 2 (40) | 261 (49.6) | |
| Overweight/Obese | 79 (56.4) | 149 (39.1) | 2 (40) | 230 (43.7) | |
| Alcohol use (N=451) | |||||
| Yes | 18 (14.9) | 22 (6.8) | 0 | 40 (8.9) | 0.008 |
| No | 103 (85.1) | 303 (93.2) | 5 (100) | 411 (91.1) | |
| Tobacco use (N=490) | |||||
| Yes | 17 (12.6) | 25 (7.1) | 0 | 42 (8.5) | 0.06 |
| No | 118 (87.4) | 325 (92.9) | 5 (100) | 448 (91.4) | |
| WHO region | |||||
| Africa | 41 (29.1) | 98 (25.7) | 1 (20) | 140 (26.6) | 0.43 |
| Americas | 38 (27.0) | 114 (29.9) | 1 (20) | 153 (29.0) | |
| Eastern Mediterranean | 58 (41.1) | 143 (37.5) | 0 | 201 (38.1) | |
| Europe | 0 | 7 (1.8) | 0 | 7 (1.3) | |
| Southeast Asia | 1 (0.7) | 7 (1.8) | 1 (20) | 9 (1.7) | |
| Western Pacific | 3 (2.1) | 12 (3.2) | 2 (40) | 17 (3.2) | |
| Mean TB incidence, country of origin, cases per 100,000 (SD)§ | 195 (95) | 154 (106) | 176 (123) | 165 (104) | <0.0001 |
| TB incidence, country of origin§ | |||||
| <100/100,000 | 27 (19.2) | 152 (39.9) | 2 (40) | 181 (34.3) | <0.0001 |
| 100–200/100,000 | 56 (39.7) | 123 (32.3) | 1 (20) | 180 (34.2) | |
| >200/100,000 | 58 (41.1) | 106 (27.8) | 2 (40) | 166 (31.5) | |
| Pre-departure anti-helminthic treatment | |||||
| Yes | 76 (53.9) | 196 (51.4) | 2 (40) | 274 (52.0) | 0.62 |
| No | 65 (46.1) | 185 (48.6) | 3 (60) | 253 (48.0) | |
| HIV (N=485) | |||||
| Yes | 5 (4.0) | 3 (0.8) | 1 (33.3) | 9 (1.9) | 0.03 |
| No | 120 (96.0) | 354 (99.2) | 2 (66.7) | 476 (98.1) | |
| Pregnant (N=448)¶ | |||||
| Yes | 1 (0.8) | 7 (2.2) | 1 (33.3) | 9 (2.0) | 0.45 |
| No | 123 (99.2) | 314 (97.8) | 2 (66.7) | 439 (98.0) | |
| Diabetes mellitus | |||||
| Yes | 7 (5.0) | 8 (2.1) | 0 | 15 (2.8) | 0.13 |
| No | 134 (95.0) | 373 (97.9) | 5 (100) | 512 (97.2) | |
| Absolute eosinophil count (mean, [SD]), cells/μL) (N=521) | 185 (19) | 199 (24) | 180 (22) | 195 (22) | 0.56 |
| Eosinophilia (N=521) | |||||
| Yes (≥500 cells/μL) | 10 (7.2) | 34 (9.0) | 1 (20) | 45 (8.6) | 0.51 |
| No (<500 cells/μL) | 129 (92.8) | 343 (91.0) | 4 (80) | 476 (91.4) | |
No. (%) unless otherwise indicated; for each variable with any missing data, total No. without missing data indicated.
p-values indicate comparison between QGIT positive and QGIT negative individuals, using Student t-test for continuous, normally distributed variables (age), Kruskal-Wallis for continuous, non-normally distributed variables (TB incidence, absolute eosinophil count) and χ2 or Fisher’s Exact test for categorical variables.
For adults: underweight denotes BMI <18.5 kg/m2, normal weight 18.5–25 kg/m2, and overweight/obese >25 kg/m2. For children, underweight denotes CDC BMI percentile <5th percentile, normal 5th−85th percentile, and overweight >85th percentile by age and sex.
Denotes TB incidence by 2016 WHO statistics for primary country of residence prior to the United States, by cases per 100,000 population and divided into lower and higher categories of TB incidence (17).
By pregnancy test or diagnosis in medical record. Not pregnant indicates either negative pregnancy test or not a female of reproductive age (13–50 years). The 79 women of reproductive age without documented negative pregnancy tests were considered as having missing data.
Abbreviations: QGIT QuantiFERON-TB Gold In-Tube SD Standard Deviation BMI Body Mass Index WHO World Health Organization TB Tuberculosis HIV Human Immunodeficiency Virus
For the immunology study, to achieve 80% power to detect an effect size of 1.3 (large in the nomenclature of Cohen19,20) for 2 group comparisons and 0.55 for 4 group comparisons, we aimed to include 10 individuals with positive and 10 with negative QGITs in each of the 4 groups noted above. The first 10 eligible participants were recruited into each group (where possible, without immunocompromising conditions, pregnancy, or pre-departure anti-parasitic therapy). We compared distributions of log-transformed concentrations of Th1 and Th2 cytokines. We examined nil tube Th2 cytokine concentrations for all samples and the difference between MTB antigen-stimulated and nil tube concentrations for QGIT-positive samples. For IFN-γ, we compared MTB antigen-stimulated minus nil tube concentrations among individuals with positive and negative QGITs. Finally, we compared continuous QGIT results among study groups combining individuals from epidemiology and immunology studies.
Ethics Statement
BMC and Rutgers New Jersey Medical School Institutional Review Boards (IRB) approved the protocol. All participants in the immunology study provided informed consent; the IRB waived consent for obtaining de-identified data for the epidemiology study.
RESULTS
Epidemiology Study
Of 1040 patients ≥5 years old screened through RHAP, 883 had QGITs performed; of those, 784 completed any stool testing, and 527 had stool microscopy and/or parasite serology (99 did not return stool samples, 257 only had G. lamblia/C. parvum antigen testing). The 527 analyzed individuals included 307 (58.2%) males; mean age was 30.2 years (range 5–86) (Table 1). Subjects emigrated most frequently from Haiti (n=118; 22.4%), Iraq (n=85; 16.1%) and Somalia (n=67; 12.7%); 29% were from the Americas, 26.6% from Sub-Saharan Africa, and 65.7% from a country with TB incidence ≥100/100,000 population. Thirty-five (6.6%) were underweight, 15 (2.8%) had diabetes mellitus, 9/485 (1.7%) tested for HIV had positive results, and none had immunocompromising conditions. Approximately half had pre-departure anti-helminthic treatment.
Stool testing revealed protozoa in 202/527 (38.3%) individuals and helminths in 3 (0.6%) (Table 2). Protozoa identified most frequently were B. hominis (n=126, 23.9%), Endolimax nana (n=66, 12.5%), and G. lamblia (n=29, 5.5%). Fifty individuals had helminth serologic testing, which revealed helminth infections in 24 (4.6% of study population): S. stercoralis in 15, Schistosoma spp in 13, and filaria in 2 (not mutually exclusive; Table 2).
Table 2:
Parasite testing results for epidemiology study of immigrants with completed QuantiFERON-TB Gold In-Tube and parasite screening, October 2012 - July 2017, Boston
| Parasites detected | All n=522 (%) |
QGIT positive n=141 (27%) |
QGIT negative* n=381 (73%) |
p-value† |
|---|---|---|---|---|
| None | 293 (56.1) | 79 (27) | 214 (73) | |
| Any Protozoa: | 202 (38.7) | 56 (27.7) | 146 (72.3) | 0.85 |
| Blastocystis hominis‡ | 70 (13.4) | 21 (30) | 49 (70) | |
| Dientamoeba | 1 (0.2) | 0 | 1 (100) | |
| Endolimax nana | 17 (3.3) | 6 (35.3) | 11 (64.7) | |
| Entamoeba coli | 8 (1.5) | 2 (25) | 6 (75) | |
| Entamoeba hartmanni | 5 (1.0) | 3 (60) | 2 (40) | |
| Entamoeba histolytica/dispar | 4 (0.8) | 2 (50) | 2 (50) | |
| Giardia lamblia | 20 (3.8) | 3 (15) | 17 (85) | |
| Iodamoeba butschlii | 3 (0.6) | 1 (33.3) | 2 (66.7) | |
| Mixed Protozoa | 74 (14.2) | 18 (24.3) | 56 (75.7) | |
| Any Helminth: | 27 (5.2) | 6 (22.2) | 21 (77.8) | 0.59 |
| Strongyloides stercoralis | 10 (1.9) | 2 (20) | 8 (80) | |
| Schistosoma spp. | 9 (1.7) | 3 (33.3) | 6 (66.7) | |
| Schistosoma spp. & S. stercoralis | 3 (0.6) | 1 (33.3) | 2 (66.7) | |
| Hymenolepsis nana | 2 (0.4) | 0 | 2 (100) | |
| Hookworm | 1 (0.2) | 0 | 1 (100) | |
| Schistosoma spp. & S. stercoralis & Filaria | 1 (0.2) | 0 | 1 (100) | |
| S. stercoralis & Filaria | 1 (0.2) | 0 | 1 (100) | |
Individuals with indeterminate QGITs not shown in this table (n=5), as all individuals with an indeterminate result had no parasites detected.
p-values reflect χ2 test comparing QGIT positivity for any protozoa detected compared with no parasites detected and for any helminths detected compared with no parasites detected.
Counts of protozoa denote indicated organism alone was isolated; mixed infections are included in ‘Mixed Protozoa’ category.
Abbreviations: QGIT QuantiFERON-TB Gold In-Tube
Of 527 subjects, 141 (26.8%) had positive QGITs, which were observed more frequently in adults than children (p<0.0001), males (p=0.03), overweight/obese individuals (vs. normal/underweight, p=0.002), those from countries with higher TB-incidence (p<0.0001), those with HIV (p=0.03) or reporting alcohol (p=0.008) or tobacco use (p=0.06) (Table 1). Five subjects had indeterminate QGITs; one was underweight, one pregnant and one had HIV (Table 1).
The proportion of positive QGIT tests among those with protozoa ranged from 15% (3/20) with G. lamblia to 60% (3/5) of those with E. hartmani (Table 2). Positive QGITs occurred in 6/27 (22.2%) with helminths and 79/293 (27%) without parasites (Table 3).
Table 3:
Odds of positive QuantiFERON-TB Gold-in-Tube by parasite group, epidemiologic study
| Characteristic | Crude OR |
95% CI | aOR† | 95% CI | aOR‡ | 95% CI |
|---|---|---|---|---|---|---|
| Parasites Detected | ||||||
| None (n=293) | Ref | Ref | Ref | Ref | Ref | Ref |
| B. hominis (n=70) | 1.16 | (0.66, 2.06) | 1.12 | (0.49, 2.56) | 1.19 | (0.65, 2.18) |
| Other Protozoa (n=81) | 1.28 | (0.75, 2.18) | 1.44 | (0.70, 2.98) | 1.46 | (0.82, 2.60) |
| Helminth (n=27) | 0.77 | (0.30, 1.99) | 0.47 | (0.10, 2.19) | 0.61 | (0.23, 1.64) |
| Age | ||||||
| Children (<18yo) | Ref | Ref | Ref | Ref | Ref | Ref |
| Adults (≥18yo) | 7.25 | (3.08, 17.0) | 8.44 | (2.81, 25.4) | 9.19 | (3.80, 22.2) |
| Time since arrival to US | ||||||
| <12 weeks | Ref | Ref | ||||
| ≥ 12 weeks | 1.26 | (0.63, 2.53) | ||||
| Sex | ||||||
| Male | Ref | Ref | ||||
| Female | 0.63 | (0.41, 0.96) | ||||
| BMI | ||||||
| Underweight | Ref | Ref | ||||
| Normal Weight | 1.94 | (0.92, 4.08) | ||||
| Overweight/Obese | 3.59 | (1.73, 7.44) | ||||
| Alcohol use | ||||||
| Yes | 2.67 | (1.32, 5.38) | 1.43 | (0.60, 3.40) | ||
| No | Ref | Ref | Ref | Ref | ||
| Tobacco use | ||||||
| Yes | 1.94 | (1.00, 3.77) | 2 | (0.79, 5.04) | ||
| No | Ref | Ref | Ref | Ref | ||
| Mean TB incidence, country of origin, cases per 100,000 | 1.004 | (1.002, 1.006) | 1.006 | (1.003, 1.009) | 1.01 | (1.003, 1.007) |
| Pre-departure anti-helminthic treatment | ||||||
| Yes | 1.11 | (0.74, 1.66) | ||||
| No | Ref | Ref | ||||
| HIV | ||||||
| Yes | 4.69 | (1.10, 19.9) | 10.24 | (1.01, 104) | ||
| No | Ref | Ref | Ref | Ref | ||
| Pregnant | ||||||
| Yes | 0.4 | (0.05, 3.37) | 0.4 | (0.04, 3.58) | ||
| No | Ref | Ref | Ref | Ref | ||
| Diabetes Mellitus | ||||||
| Yes | 2.66 | (0.91, 7.72) | ||||
| No | Ref | Ref | ||||
| Absolute Eosinophil Count (cells/hpf) | 0.68 | (0.26, 1.80) | 0.3 | (0.04, 2.10) | ||
Total No. for this table is 471 (Those with mixed B. hominis and other protozoa detected [n=51] or indeterminate QGIT results [n=5] were excluded from multivariable analysis).
OR of positive compared to negative QGIT adjusted for age (≥18 vs. <18), alcohol use, tobacco use, tuberculosis incidence of country of origin, absolute eosinophil count, pregnancy, and HIV.
Using multiple imputation analysis to account for all missing data, OR of positive vs. negative QGIT adjusted for age (≥18 vs. <18) and tuberculosis incidence of country of origin.
Abbreviations: QGIT QuantiFERON-TB Gold In-Tube aOR Adjusted Odds Ratio CI Confidence Interval
In univariate and multivariate analyses of individuals with B. hominis, other protozoa, and helminth infections, no group had significantly increased odds of positive QGIT compared to individuals without parasites (Table 3). Only age, HIV, and country-specific TB-incidence remained significant predictors of QGIT positivity in multivariable analyses. Results did not substantially differ after multiple imputation analysis (Table 3).
Immunology study
We assessed 557 patients for inclusion in the immunology study. Of 386 eligible participants who had appropriate laboratory tests ordered, 265 (68.9%) consented to participate. Of these, 179 (67.5%) completed the necessary laboratory tests. Of the 49/179 (27.4%) with positive QGITs, results were analyzed for 4 with helminths, 8 with B. hominis, 6 other protozoa, and 10 with no parasites; among QGIT-negatives, we analyzed ten in each of the four groups (Table 4).
Table 4:
Demographic characteristics for immigrants included in immunologic analysis, January 2016 - November 2017, Boston
| Characteristic | All | No parasites |
B. hominis | Other protozoa |
Helminth | p-value† |
|---|---|---|---|---|---|---|
| n=68 (%)* | n=20 (%) | n=18 (%) | n=16 (%) | n=14 (%) | ||
| Mean age, years (SD) | 29.6 (13.6) | 31.4 (8.7) | 24.8 (15.0) | 25.1 (9.5) | 38.4 (17.5) | 0.01 |
| Age | ||||||
| Children (<18yo) | 13 (19.1) | 0 (0) | 7 (38.9) | 4 (25) | 2 (14.3) | 0.009 |
| Adults (≥18yo) | 55 (80.9) | 20 (100) | 11 (61.1) | 12 (75) | 12 (85.7) | |
| Time since arrival to US | ||||||
| <12 weeks | 48 (70.6) | 9 (45) | 17 (94.4) | 14 (87.5) | 8 (57.1) | 0.002 |
| ≥ 12 weeks | 20 (29.4) | 11 (55) | 1 (5.6) | 2 (12.5) | 6 (42.9) | |
| Sex | ||||||
| Male | 39 (57.4) | 11 (55) | 9 (50) | 9 (56.2) | 10 (71.4) | 0.66 |
| Female | 29 (42.6) | 9 (45) | 9 (50) | 7 (43.8) | 4 (28.6) | |
| BMI (N=67) | ||||||
| Underweight‡ | 3 (4.5) | 0 | 1 (5.6) | 1 (6.2) | 1 (7.7) | 0.85 |
| Normal weight | 28 (41.8) | 9 (45) | 7 (38.9) | 8 (50) | 4 (30.8) | |
| Overweight/Obese | 36 (53.7) | 11 (55) | 10 (55.6) | 7 (43.8) | 8 (61.5) | |
| Alcohol use (N=64) | ||||||
| Yes | 9 (14.1) | 3 (15) | 3 (17.6) | 1 (7.1) | 2 (15.4) | 0.89 |
| No | 55 (85.9) | 17 (85) | 14 (82.4) | 13 (92.9) | 11 (84.6) | |
| Tobacco use (N=66) | ||||||
| Yes | 5 (7.6) | 2 (10) | 1 (5.6) | 1 (6.7) | 1 (7.7) | 0.96 |
| No | 61 (92.4) | 18 (90) | 17 (94.4) | 14 (93.3) | 12 (92.3) | |
| WHO region | ||||||
| Africa | 20 (29.4) | 3 (15) | 5 (27.8) | 6 (37.5) | 6 (42.9) | 0.32 |
| Americas | 35 (51.5) | 14 (70) | 7 (38.9) | 8 (50) | 6 (42.9) | |
| Eastern Mediterranean | 13 (19.1) | 3 (15) | 6 (33.3) | 2 (12.5) | 2 (14.3) | |
| Europe | 0 | 0 | 0 | 0 | 0 | |
| Southeast Asia | 0 | 0 | 0 | 0 | 0 | |
| Western Pacific | 0 | 0 | 0 | 0 | 0 | |
| Mean TB incidence, country of origin per 100,000 (SD)§ | 157 (79) | 185 (65) | 120 (91) | 184 (72) | 135 (71) | 0.09 |
| TB incidence, country of origin, cases per 100,000§ | ||||||
| <100/100,000 | 17 (25) | 2 (10) | 8 (44.4) | 2 (12.5) | 5 (35.7) | 0.19 |
| 100–200/100,000 | 33 (48.5) | 12 (60) | 6 (33.3) | 10 (62.5) | 5 (35.7) | |
| >200/100,000 | 18 (26.5) | 6 (30) | 4 (22.2) | 4 (25) | 4 (28.6) | |
| Pre-departure anti-helminthic treatment | ||||||
| Yes | 14 (20.6) | 0 | 5 (27.8) | 6 (37.5) | 3 (21.4) | 0.01 |
| No | 54 (79.4) | 20 (100) | 13 (72.2) | 10 (62.5) | 11 (78.6) | |
| HIV (N=61) | ||||||
| Yes | 3 (4.9) | 0 | 1 (5.9) | 1 (6.2) | 1 (11.1) | 0.47 |
| No | 58 (95.1) | 19 (100) | 16 (94.1) | 15 (93.8) | 8 (88.9) | |
| Pregnant¶ (N=63) | ||||||
| Yes | 2 (3.2) | 2 (11.1) | 0 | 0 | 0 | 0.24 |
| No | 61 (96.8) | 16 (88.9) | 17 (100) | 16 (100) | 12 (100) | |
| Eosinophilia (N=63) | ||||||
| Yes (≥500 cells/μL) | 12 (19) | 1 (5.3) | 1 (5.6) | 2 (13.3) | 8 (72.7) | <0.0001 |
| No (<500 cells/μL) | 51 (81) | 18 (94.7) | 17 (94.4) | 13 (86.7) | 3 (27.3) | |
| Diabetes mellitus | ||||||
| Yes | 0 | 0 | 0 | 0 | 0 | -- |
| No | 68 (100) | 20 (100) | 18 (100) | 16 (100) | 14 (100) | |
No. (%) unless otherwise indicated; for each variable with any missing data, total No. without missing data noted.
p-values indicate comparison between QGIT positive and QGIT negative individuals, using ANOVA for continuous, normally distributed variables (age), Kruskal-Wallis for continuous, non-normally distributed variables (TB incidence, absolute eosinophil count) and χ2 test for categorical variables.
For adults: underweight denotes BMI <18.5 kg/m2, normal weight 18.5–25 kg/m2, and overweight/obese >25 kg/m2. For children, underweight denotes CDC BMI percentile <5th percentile, normal 5th−85th percentile, and overweight >85th percentile by age and sex.
Denotes TB incidence by 2016 WHO statistics for primary country of residence prior to the United States, by cases per 100,000 population and divided into lower and higher categories of TB incidence (17).
By pregnancy test or diagnosis in medical record. Not pregnant indicates either negative pregnancy test or not a female of reproductive age (13–50 years). Women of reproductive age without documented negative pregnancy tests were considered as having missing data.
Abbreviations: QGIT QuantiFERON-TB Gold In-Tube SD Standard Deviation BMI Body Mass Index WHO World Health Organization TB Tuberculosis HIV Human Immunodeficiency Virus
We observed no significant differences in Th2 cytokines IL-4 or IL-13, but IL-10 concentrations were higher in protozoa and helminth groups compared to B. hominis and those without parasites (p=0.04) (Figure 1a-c). For QGIT-positive samples, we observed no significant differences in Th2 cytokine concentrations with MTB antigen stimulation (Figure 1d-f).
Figure 1:
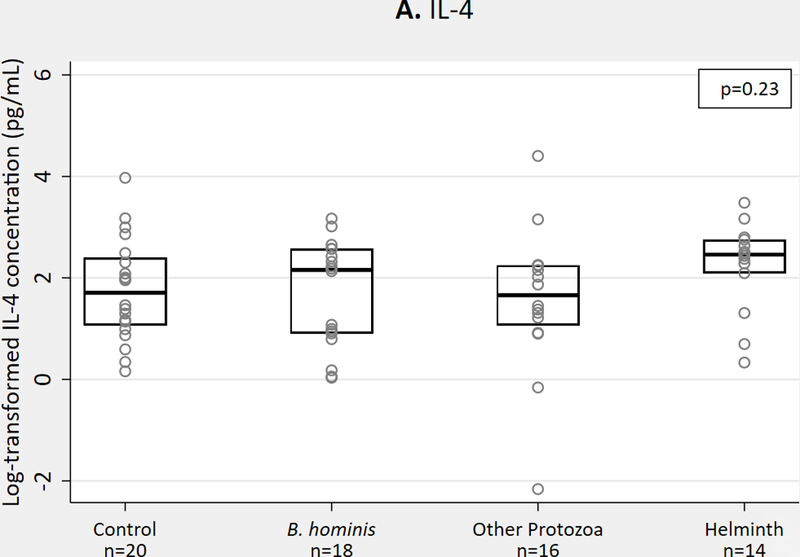
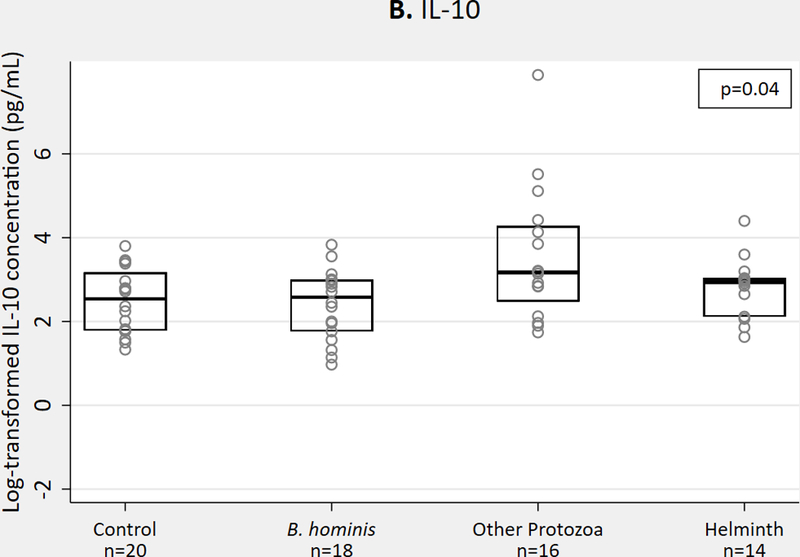


Th2 cytokine concentrations in QGIT supernatants for immigrants with and without parasites, n = 68. 1A-1C. IL-4, IL-10, IL-13 concentrations in nil tube for QGIT-positive and QGIT-negative immigrants. 1D-1F. IL-4, IL-10, and IL-13 concentrations in MTB-antigen stimulated minus nil tube for QGIT-positive immigrants. Boxes indicate IQR, line within box denotes median, circles represent individual data points. Th2, T helper 2; QGIT, QuantiFERON-TB Gold-in-Tube; MTB, Mycobacterium tuberculosis; IQR, interquartile range.
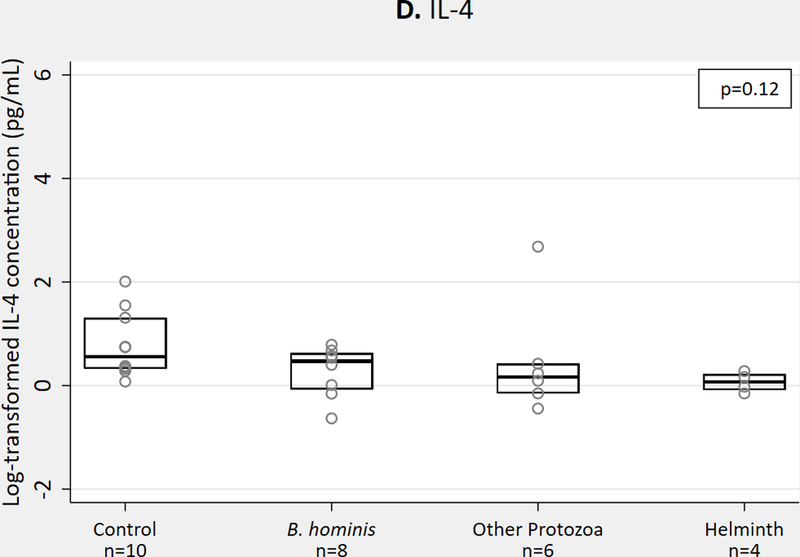
IFN-γ concentrations (in MTB antigen-stimulated minus nil tubes) were lower in QGIT-positive individuals with helminths, but the difference was not statistically significant (helminth mean concentration 1.32 pg/mL, versus 3.61 pg/mL in those without parasites; p=0.20 for all group comparison, p=0.10 for helminths vs. no parasites) (Figure 2a). IFN-γ concentrations did not differ among groups in QGIT-negative individuals (p=0.23) (Figure 2b).
Figure 2:


IFN-γ concentrations measured from QGIT supernatants for immigrants with and without parasite infections, n = 68, in MTB-stimulated minus nil tube (A) for QGIT-positive immigrants and (B) for QGIT-negative immigrants. Boxes indicate IQR, line within box denotes median, circles represent individual data points. IFN-γ, interferon gamma; QGIT, QuantiFERON-TB Gold-in-Tube; MTB, Mycobacterium tuberculosis; IQR, interquartile range.
Epidemiology and Immunology Studies
We found no significant differences in QGIT-measured IFN-γ concentrations among the four study groups in epidemiology and immunologic studies combined (n=518; some participants fit both inclusion criteria). Mean IFN-γ concentration was slightly lower in helminth-infected, QGIT-positive individuals (p=0.58) (Figure 3a). Among QGIT-negative individuals, we observed no difference in IFN-γ concentrations in the helminth group compared to other groups (p=0.73) (Figure 3b).
Figure 3:

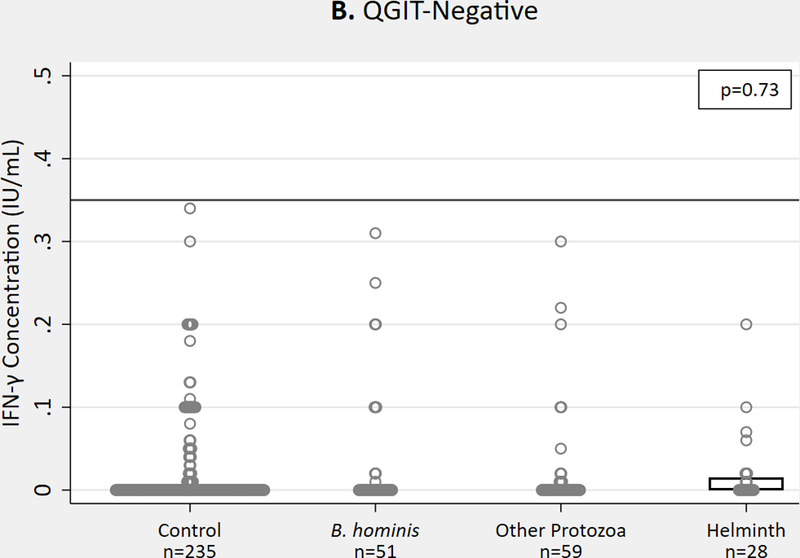
IFN-γ concentrations measured by commercial QGIT in MTB-stimulated minus nil tube for immigrants with and without parasite infections (epidemiology and immunologic groups combined), n = 518 in (A) QGIT-positive immigrants and (B) QGIT-negative immigrants. Horizontal line represents cutoff for positive QGIT (0.35 IU/mL) for reference. Boxes indicate IQR, line within box denotes median, circles represent individual data points. IFN-γ, interferon gamma; QGIT, QuantiFERON-TB Gold-in-Tube; MTB, Mycobacterium tuberculosis; IQR, interquartile range.
DISCUSSION
These findings suggest that QGIT results are valid in individuals with parasitic infections – a sizeable proportion of those tested in this immigrant population and worldwide5,7. We found that, among immigrants from TB-endemic countries in the Boston RHAP program, parasites do not affect QGIT positivity, adjusting for covariates. Additionally, IFN-γ concentrations did not differ significantly after MTB antigen stimulation among those with helminths, B. hominis, other protozoa, or no parasites detected. These results suggest individuals with helminth or protozoal infections will not have false negative QGIT results from low IFN-γ concentrations.
As expected, Th2 cytokine concentrations were slightly elevated in individuals with helminths as was IL-10 for other protozoa. This is consistent with previous findings of increased Th2 cytokines from helminths8–11. The cytokine bias however, does not appear to affect QGIT results.
We found that almost one-third of immigrants had positive QGITs and that older age, male sex, overweight/obese BMI, alcohol use, and HIV infection were univariate predictors of LTBI. Only age and HIV remained significant in multivariable analysis. These findings are consistent with the literature, but the association between BMI and LTBI has not been evaluated frequently21. Our findings mirror a recent meta-analysis showing that underweight compared with overweight/obese BMI was associated with negative QGITs22. Malnutrition is a risk for TB disease23,24 but can also blunt cellular immune response, and has been associated with false negative IGRAs and TSTs 14,25–27. IGRAs offer the advantage over TST that if malnutrition altered the immune response, one would expect a poor mitogen response and indeterminate QGIT results, which we did not see, albeit with limited sample size. Additional studies would help determine whether low BMI alters QGIT reliability.
Our study’s strengths lie in pairing epidemiologic and immunologic analyses that together support the lack of effect of parasitic infections on QGIT results. Furthermore, we recruited individuals with a variety of parasitic infections to compare effects on cytokine response. Our study had several limitations. First, decreases in refugee volume over 2017 and lower rates of helminth infection than predicted limited sample size in QGIT-positive parasite groups. This decreased power in two immunology study comparisons involving only QGIT-positives, and it is possible we failed to detect a true association. We addressed this by including both epidemiologic (n=471) and immunologic cohorts (n=68) in the analysis of quantitative QGIT response. All children recruited in the immunology study had parasites detected, and studies report differential cytokine responses with age28,29; however, in sensitivity analyses, we did not see an association between age group and cytokine concentrations (data not shown), therefore it is unlikely that age confounded our results. Potential for under-detection of parasites existed as testing was limited to one stool test and additional testing per the patient’s provider. Misclassification was likely minimal, as urinalysis and CBCs were performed; any clinical or laboratory evidence of helminth infection should have prompted further testing. As with any retrospective chart review, variables occasionally were not documented in the medical record (e.g., pre-departure anti-helminthic treatment). We incorporated CDC country-specific treatment guidelines and used multiple imputation analysis to address missing data. Finally, QGIT IFN-γ values >10 were not quantified, so we could not estimate the full distribution of QGIT results in the epidemiology study, but our immunology study utilized the full range of values and found similar results.
CONCLUSIONS
Our study of the association between parasite infections and QGIT testing in immigrants to the U.S. found no significant differences in QGIT results or IFN-γ concentrations among patients with helminths, B. hominis, or other protozoa compared with no parasites. This finding provides evidence that QGIT results can be trusted for individuals with parasite infections. Parasites are endemic in the majority of high TB burden countries, where it is important to identify TB contacts correctly, especially for contacts of MDR TB cases and young children5,7,30,31. These data have relevance for contact tracing in high-burden countries and for screening immigrants to low burden settings.
ACKNOWLEDGEMENTS
We acknowledge Quest Laboratories, Chantilly, VA, in particular Paul Scarlata and Melissa Smith, as well as Sujung Choi (Rutgers) for assistance in shipping specimens for study analysis; Linda Rosen, Hannah Tungsten and Leland Chan for their assistance with obtaining epidemiologic data from the electronic health record at BMC, all patients seen in RHAP clinics and consented for this project and all the providers and staff of the RHAP clinics at BMC, in particular Sondra Crosby, Sarah Kimball, Nicolette Oleng, and Vishakha Sabharwal, for their help with making this study possible.
FUNDING
This work was supported by the National Center for Advancing Translational Sciences, National Institutes of Health, through Boston University Clinical & Translational Science Institute Grant Number 1UL1TR001430, the National Institute of Allergy and Infectious Diseases (5P30AI042853–18), and the Providence/Boston Center for AIDS Research (P30AI042853). Its contents are solely the responsibility of the authors and do not necessarily represent the official views of the National Institutes of Health.
Footnotes
Arabic, Burmese, Farsi, French, Haitian Creole, Mandarin, Portuguese, Somali, Spanish, and Vietnamese
REFERENCES
- 1.World Health Organization. Implementing the end TB strategy: the essentials [Internet]. Geneva, Switzerland: WHO; 2015. [cited 2017 Aug 8]. Available from: http://www.who.int/tb/publications/2015/The_Essentials_to_End_TB/en/ [Google Scholar]
- 2.Salgame P, Yap GS, Gause WC. Effect of helminth-induced immunity on infections with microbial pathogens. Nat Immunol. 2013;14:1118–26. [DOI] [PMC free article] [PubMed] [Google Scholar]
- 3.Board AR, Suzuki S. The interrelation between intestinal parasites and latent TB infections among newly resettled refugees in Texas. Int Health. 2016;8:67–72. [DOI] [PubMed] [Google Scholar]
- 4.Watts NS, Mizinduko MM, Barnett ED, White LF, Hochberg NS. Association between parasitic infections and tuberculin skin test results in refugees. Travel Med Infect Dis. 2017;16:35–40. [DOI] [PubMed] [Google Scholar]
- 5.Torgerson PR, Devleesschauwer B, Praet N, Speybroeck N, Willingham AL, Kasuga F, et al. World Health Organization Estimates of the Global and Regional Disease Burden of 11 Foodborne Parasitic Diseases, 2010: A Data Synthesis. PLoS Med [Internet]. 2015;12 Available from: https://www.ncbi.nlm.nih.gov/pmc/articles/PMC4668834/ [DOI] [PMC free article] [PubMed] [Google Scholar]
- 6.World Health Organization. Global tuberculosis report 2017 [Internet]. Geneva, Switzerland; 2017. [cited 2018 Jun 28]. Available from: http://www.who.int/tb/publications/global_report/en/ [Google Scholar]
- 7.Hotez PJ, Herricks JR. Helminth Elimination in the Pursuit of Sustainable Development Goals: A “Worm Index” for Human Development. PLoS Negl Trop Dis. 2015;9:e0003618. [DOI] [PMC free article] [PubMed] [Google Scholar]
- 8.Babu S, Nutman TB. Helminth-Tuberculosis Co-Infection: an Immunologic Perspective. Trends Immunol. 2016;37:597–607. [DOI] [PMC free article] [PubMed] [Google Scholar]
- 9.Anuradha R, Munisankar S, Bhootra Y, Jagannathan J, Dolla C, Kumaran P, et al. Systemic Cytokine Profiles in Strongyloides stercoralis Infection and Alterations following Treatment. Infect Immun. 2016;84:425–31. [DOI] [PMC free article] [PubMed] [Google Scholar]
- 10.Potian JA, Rafi W, Bhatt K, McBride A, Gause WC, Salgame P. Preexisting helminth infection induces inhibition of innate pulmonary anti-tuberculosis defense by engaging the IL-4 receptor pathway. J Exp Med. 2011;208:1863–74. [DOI] [PMC free article] [PubMed] [Google Scholar]
- 11.Anuradha R, Munisankar S, Bhootra Y, Dolla C, Kumaran P, Nutman TB, et al. Anthelmintic Therapy Modifies the Systemic and Mycobacterial Antigen-Stimulated Cytokine Profile in Helminth-Latent Mycobacterium tuberculosis Coinfection. Infect Immun [Internet]. 2017;85 Available from: https://www.ncbi.nlm.nih.gov/pmc/articles/PMC5364310/ [DOI] [PMC free article] [PubMed] [Google Scholar]
- 12.Centers for Disease Control and Prevention. Updated Guidelines for Using Interferon Gamma Release Assays to Detect Mycobacterium tuberculosis Infection — United States, 2010. MMWR Morb Mortal Wkly Rep. 2010;59:1–25. [PubMed] [Google Scholar]
- 13.Nguyen D, Teeter L, Graves J, Graviss E. Characteristics Associated with Negative Interferon-γ Release Assay Results in Culture-Confirmed Tuberculosis Patients, Texas, USA, 2013–2015. Emerg Infect Dis. 2018;24:534–40. [DOI] [PMC free article] [PubMed] [Google Scholar]
- 14.Telisinghe L, Amofa-Sekyi M, Maluzi K, Kaluba-Milimo D, Cheeba-Lengwe M, Chiwele K, et al. The sensitivity of the QuantiFERON®-TB Gold Plus assay in Zambian adults with active tuberculosis. Int J Tuberc Lung Dis. 2017;21:690–6. [DOI] [PMC free article] [PubMed] [Google Scholar]
- 15.Choi JC, Jarlsberg LG, Grinsdale JA, Osmond DH, Higashi J, Hopewell PC, et al. Reduced sensitivity of the QuantiFERON(®) test in diabetic patients with smear-negative tuberculosis. Int J Tuberc Lung Dis. 2015;19:582–8. [DOI] [PubMed] [Google Scholar]
- 16.Massachusetts DPH. Refugee and Immigrant Health [Internet]. Health and Human Services; 2008. [cited 2017 Oct 13]. Available from: http://www.mass.gov/eohhs/gov/departments/dph/programs/id/public-health-cdc-refugee-and-immigrant-health.html [Google Scholar]
- 17.Treatment Schedules Presumptive Parasitic | Immigrant and Refugee Health | CDC [Internet]. 2017. [cited 2018 May 22]. Available from: https://www.cdc.gov/immigrantrefugeehealth/guidelines/overseas/interventions/interventions.html
- 18.WHO Tuberculosis data [Internet]. World Health Organization; 2017. [cited 2018 Mar 18]. Available from: http://www.who.int/tb/data/en/ [Google Scholar]
- 19.Cohen J Statistical Power Analysis for the Behavioral Sciences. 2nd ed New Jersey: Lawrence Erlbaum Associates; 1988. [Google Scholar]
- 20.Cohen J Statistical Power Analysis. Current Directions in Psychological Science. Vol. 1 Oxford: Blackwell Publishing; 1992. [Google Scholar]
- 21.Ncayiyana JR, Bassett J, West N, Westreich D, Musenge E, Emch M, et al. Prevalence of latent tuberculosis infection and predictive factors in an urban informal settlement in Johannesburg, South Africa: a cross-sectional study. BMC Infect Dis [Internet]. 2016. [cited 2018 Jun 2];16 Available from: https://www.ncbi.nlm.nih.gov/pmc/articles/PMC5101651/ [DOI] [PMC free article] [PubMed] [Google Scholar]
- 22.Saag LA, LaValley MP, Hochberg NS, Cegielski JP, Pleskunas JA, Linas BP, et al. Low body mass index and latent tuberculous infection: a systematic review and meta-analysis. Int J Tuberc Lung Dis Off J Int Union Tuberc Lung Dis. 2018;22:358–65. [DOI] [PubMed] [Google Scholar]
- 23.Lönnroth K, Williams BG, Cegielski P, Dye C. A consistent log-linear relationship between tuberculosis incidence and body mass index. Int J Epidemiol. 2010;39:149–55. [DOI] [PubMed] [Google Scholar]
- 24.Kim SJ, Ye S, Ha E, Chun EM. Association of body mass index with incident tuberculosis in Korea. PloS One. 2018;13:e0195104. [DOI] [PMC free article] [PubMed] [Google Scholar]
- 25.Cegielski JP, McMurray DN. The relationship between malnutrition and tuberculosis: evidence from studies in humans and experimental animals. Int J Tuberc Lung Dis Off J Int Union Tuberc Lung Dis. 2004;8:286–98. [PubMed] [Google Scholar]
- 26.Schaible UE, Kaufmann SHE. Malnutrition and Infection: Complex Mechanisms and Global Impacts. PLOS Med. 2007;4:e115. [DOI] [PMC free article] [PubMed] [Google Scholar]
- 27.Anuradha R, Munisankar S, Bhootra Y, Kumar NP, Dolla C, Babu S. Malnutrition is associated with diminished baseline and mycobacterial antigen - stimulated chemokine responses in latent tuberculosis infection. J Infect. 2018; [DOI] [PMC free article] [PubMed] [Google Scholar]
- 28.Decker M-L, Gotta V, Wellmann S, Ritz N. Cytokine profiling in healthy children shows association of age with cytokine concentrations. Sci Rep. 2017;7:17842. [DOI] [PMC free article] [PubMed] [Google Scholar]
- 29.Decker M- L, Grobusch MP, Ritz N. Influence of Age and Other Factors on Cytokine Expression Profiles in Healthy Children—A Systematic Review. Front Pediatr [Internet]. 2017. [cited 2018 Sep 18];5 Available from: https://www.frontiersin.org/articles/10.3389/fped.2017.00255/full#T2 [DOI] [PMC free article] [PubMed] [Google Scholar]
- 30.Tao N-N, He X-C, Zhang X-X, Liu Y, Yu C- B, Li H- C. Drug-Resistant Tuberculosis among Children, China, 2006–2015. Emerg Infect Dis. 2017;23:1800–5. [DOI] [PMC free article] [PubMed] [Google Scholar]
- 31.Mandalakas AM, Detjen AK, Hesseling AC, Benedetti A, Menzies D. Interferon-gamma release assays and childhood tuberculosis: systematic review and meta-analysis [Review article] [Internet]. 2011. [cited 2018 Jul 31]. Available from: http://www.ingentaconnect.com/content/iuatld/ijtld/2011/00000015/00000008/art00004 [DOI] [PubMed]