Abstract
Microbiota plays an important role in immunoglobulin A (IgA) nephropathy (IgAN); however, the pathogenesis, early diagnosis, and treatment of IgAN remain unclear. The aim of the present study was to develop a preliminary model based on saliva-specific microbes and clinical indicators to facilitate the early diagnosis of IgAN and obtain insights into its treatment. The microbial profile of the saliva of 28 IgAN patients and 25 healthy control subjects was investigated using high-throughput sequencing and bioinformatics analyses of the V4 region in microbial 16S rRNA genes. IgAN patients and healthy subjects did not differ significantly in α-diversity indices (Chao1 and Shannon index) or phylum composition. At the genus level, however, Granulicatella was significantly less abundant in healthy individuals than in IgAN patients, while Prevotella and Veillonella were significantly more abundant in the healthy subjects than in IgAN patients (P<0.05 and P<0.01, respectively). Correlation analysis between biochemical indicators and operational taxonomic units (OTUs) revealed that the glomerular filtration rate was positively correlated with OTU86 and OTU287 at P<0.05, positively correlated with OTU165 at P<0.001, and negatively correlated with OTU455 at P<0.05. The serum creatinine index was negatively correlated with OTU287 at P<0.05 and negatively correlated with OTU165 at P<0.001. The pathological changes were positively correlated with OTU255 at P<0.05, OTU200 at P<0.01, and OTU455 and OTU75 at P<0.001, and negatively correlated with OTU86, OTU287, and OTU788 at P<0.05 and with OTU165 at P<0.01. The differences between Chinese IgAN patients and healthy subjects in terms of OTUs and biochemical indicators were analyzed and a mathematical model to facilitate the clinical diagnosis of IgAN was established.
Keywords: 16S rRNA gene, immunoglobulin A nephropathy, salivary microbiome, modeling
Introduction
Immunoglobulin A (IgA) nephropathy (IgAN) is the most common chronic glomerular disease worldwide, and ~20% IgANs develop into end-stage renal disease (ESRD) within 20 years of treatment (1). The incidence of IgAN varies in different regions, being much higher (30–50%) in Asia than in Europe and the United States (5–25%). Compared to other ethnicities, in Asian patients, IgAN has been revealed to be more likely to progress to end-stage renal disease (ESRD) (2). IgAN accounts for >40% of primary glomerular diseases in China (3), being the top cause of ESRD there. IgAN has diverse clinical manifestations, such as macroscopic or microscopic hematuria, microscopic hematuria with proteinuria, nephrotic syndrome, and renal dysfunction. Currently, there is no effective treatment method for IgAN. Although cytotoxic drugs such as glucocorticoids and cyclophosphamide can reduce proteinuria in some patients, their long-term protective effect on renal function is not known (4). Owing to a lack of auxiliary diagnostic methods, the definitive diagnosis of IgAN relies mainly on pathology. The etiology and pathogenesis of IgAN are not clear, but the incidence and progression are mainly related to mucosal infections such as those of the mouth, throat, and intestine (5). Therefore, clarifying the relationship between the composition of microflora in the digestive tract and IgAN may provide insights on its pathogenesis, early diagnosis, and treatment.
As the largest micro-ecological system of the human body, the intestinal tract mainly includes intestinal bacteria, in addition to a very small amount of viruses, mycoplasmas and fungi. The intestinal tract harbors as many as 1,014 bacterial species, constituting over 10 times the total number of human cells (6,7). Therefore, homeostasis of the intestinal flora is physiologically significant in promoting the digestion and absorption of host nutrients, maintaining normal physiological functions of the intestine, regulating body immunity, and antagonizing the colonization of pathogenic microbes (8–10). Changes in the intestinal environment disrupt the homeostasis of the intestinal flora, causing autoimmune diseases such as inflammatory bowel diseases, type I diabetes, cardiovascular diseases, central nervous system diseases, allergic diseases, rheumatoid arthritis, and systemic lupus erythematosus (11).
In addition, the oral microbial flora comprises one of the most complex microbial communities known. Microbes in the mouth and intestines interact with each other to some extent. Bacteria in the mouth enter the stomach by food ingestion, eventually reaching the intestines. At least 700 microbe species have been identified to occur in the oral bacterial community or biofilms (12). Similar to intestinal flora, a disruption in oral flora is closely associated with the occurrence of many malignant tumors and autoimmune diseases (13,14).
The relationship between oral microflora and the occurrence of IgAN is unclear at present; therefore, the salivary flora of IgAN patients and healthy people was investigated and compared by high-throughput sequencing to discover saliva-specific microbes associated with IgAN. Furthermore, preliminary modeling in combination with clinical indicators was performed to facilitate the early diagnosis of IgAN and provide novel insights for its treatment.
Materials and methods
Research subjects
Twenty-eight patients who were definitively diagnosed with IgAN through renal biopsy at the Shenzhen Longhua District Central Hospital (Shenzhen, China), were randomly selected as the experimental group, while 25 healthy volunteers from the same area served as normal control subjects. Each subject volunteered to participate in the experiment and signed an informed consent form. The clinical information of all the subjects is listed in Table I. The study protocol was approved by the Ethics Committee of Guangdong Medical University, and informed consent was obtained from each patient and healthy subject enrolled in the study.
Table I.
General information of research subjects.
| Parameters | Healthy control group | IgAN group |
|---|---|---|
| Age | 36.12±6.71 | 36.14±8.87 |
| Male | 13 | 15 |
| Female | 12 | 13 |
| BMI | 21.72±2.13 | 22.31±3.29 |
| Proteinuria (g/day) | 1.978±1.719 | 0.068±0.032 |
| Systolic blood pressure (mmHg) | 112.2±11.55 | 139.04±22.72 |
| Diastolic blood pressure (mmHg) | 71.76±10.3 | 86.14±14.33 |
| sCR (µmol/l) | 65.16±15.17 | 127.7±60.81 |
| eGFR (ml/min/1.73 m2) | 106.5±17.93 | 64.6±30.62 |
IgAN, immunoglobulin A nephropathy; sCR, serum creatinine; eGFR, glomerular filtration rate.
Subject exclusion criteria
Patients with diarrhea or other intestinal diseases who had taken antibiotics, probiotics, or laxatives within 4 weeks before sampling were excluded.
Collection of saliva samples
Subjects underwent comprehensive dental and periodontal examinations by specialists who performed clinical status assessments. Two hours after the subjects brushed their teeth in the morning, they were required to spit 4–5 ml of saliva directly into sterile collection containers over a time span of 30 min. The collected saliva was naturally produced, without any stimulation. After collection, the samples were immediately mixed with RNAlater (Sigma-Aldrich; Merck KGaA) and stored at −80°C until use.
Nucleic acid extraction
Salivary microbial genomic DNA was extracted using the HiPure Bacterial DNA kit (Magen) according to the manufacturer's protocol. The integrity of the extracted DNA was verified by agarose gel electrophoresis, and the extracted DNA was stored at −20°C until use.
16S rRNA-based NGS library construction
Primers were designed for the V4 region in the microbial 16S rRNA gene, and the primers used for PCR included Illumina Bridge PCR-compatible primers, barcode primers, and the V4 universal primers 515F (5′-GTGCCAGCMGCCGCGGTAA-3′) and 806R (5′-GGACTACHVGGGTWTCTAAT-3′). PCR products were purified with magnetic beads, and the sizes were verified by an Agilent 2100 Bioanalyzer (Agilent Technologies, Inc.). This was followed by quantification with Qubit 3.0 (Thermo Fisher Scientific, Inc.), qPCR, and sequencing with the Illumina HiSeq 4000 platform (Illumina, Inc.).
Raw data quality control and sequence splicing
Quality filtering of paired-end raw read data was performed using Trimmomatic software (version 0.33; http://www.usadellab.org/cms/?page=trimmomatic). Concurrently, according to the barcode and primer information at both ends of each sequence, sequences were assigned to the corresponding samples with Mothur software (version 1.35.1; http://www.mothur.org), after which the barcode and primers were removed to obtain the paired-end clean reads after quality control. Each pair of clean reads was spliced with FLASH software (version 1.2.11; http://ccb.jhu.edu/software/FLASH/) to obtain the original splicing sequence (raw tags). The spliced sequences were subjected to quality control and were filtered to obtain effective splicing fragments (clean tags).
Bioinformatics analysis
All the clean tags of the samples were clustered with URESEARCH software (version 8 10.0.240; http://www.drive5.com/usearch/). The sequences were clustered into operational taxonomic units (OTUs) as per 97% identity. An OTU was considered to represent a species. The default clustering method was set as UPARSE (http://www.drive5.com/uparse/). Using QIIME (http://qiime.org), a sequence with the highest frequency of occurrence was extracted from the sequence to which each OTU belongs as a representative sequence of the OTU. Singleton OTUs usually result from sequencing errors or the chimeras generated during PCR. Therefore, singleton OTUs were removed with USEARCH (http://www.drive5.com/usearch/) after clustering, and chimeric sequences were removed using UCHIME (EdiTar Bio-Tech Ltd.).
The representative sequence of each OTU was compared with the Human Oral Microbiome Database (HOMD; http://www.homd.org) to obtain species annotation information, thereby obtaining community composition information for each sample. The OTUs and their tags that were annotated as chloroplast or mitochondrion (16S amplicon) and those that could not be annotated to genus level were excluded; thus, the valid tag sequence and OTU classification for each sample were obtained. Finally, the data of each sample were homogenized with the sample with the minimum amount of data as the standard. Differences were analyzed using GraphPad Prism version 6.0 (GraphPad Software, Inc.) for nonparametric Mann-Whitney test analysis (two-tailed, 95% CI); P<0.05 was considered to indicate a statistically significant result.
Results
Characterization of sequencing results
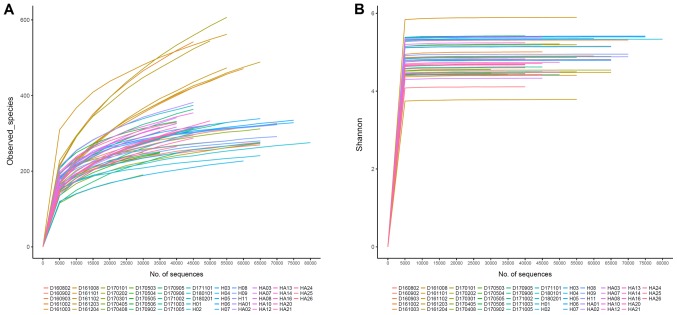
The salivary microbes of IgAN patients and healthy control individuals were analyzed by sequencing the 16S rRNA gene with Illumina HiSeq 4000. After quality control, the total number of salivary microbial sequences from the 53 subjects was 2,842,648 reads, which included 1,386,638 from 25 healthy control subjects (mean age, 36.12 years), at an average of 55,467 reads per sample, and 1,455,965 from 28 IgAN patients (mean age, 36.14 years), at an average of 51,998 reads per sample, with an average length of 500 bp each. Shannon-Wiener curves plateaued, indicating that the sequencing depth could fully analyze the composition of salivary microbes (Fig. 1).
Figure 1.
(A) Rarefaction curves and (B) Shannon-Wiener curves of samples collected from IgAN patients and control subjects. Different colors indicate different samples. IgAN, immunoglobulin A nephropathy.
Taxonomic analysis of salivary microbes
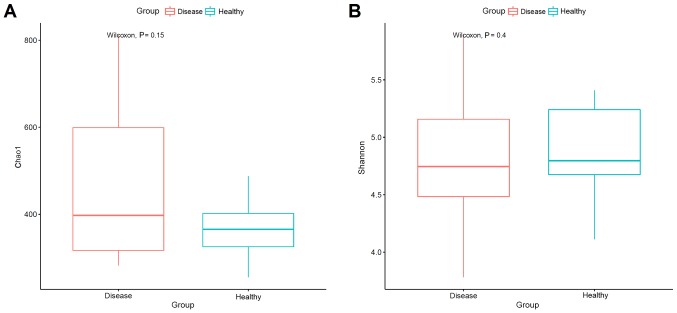
The composition of salivary bacterial colonies was analyzed in terms of a richness estimator (Chao1) and diversity index (Shannon). IgAN patients (7,194 OTUs) harbored higher microbial diversity, with an average of 256 OTUs, while the healthy control group (6,305 OTUs) had an average of 252 OTUs. According to the mean of the OTUs, the Shannon index was higher in the healthy control group, while Chao 1 was higher in IgAN patients (Fig. 2). However, Wilcoxon analysis revealed no significant difference in α-diversity (Chao1, Shannon) between the groups. In the salivary microbes, 12 phyla were identified [Absconditabacteria (SR1), Actinobacteria, Bacteroidetes, Chloroflexi, Cyanobacteria, Firmicutes, Fusobacteria, Gracilibacteria (GN02), Proteobacteria, Saccharibacteria (TM7), Spirochaetes, and Synergistetes]. There were no significant differences in the above 12 phyla between the healthy control subjects and IgAN patients (P<0.05; data not shown). In the experimental group, Firmicutes, Bacteroidetes, Proteobacteria, and Fusobacteria accounted for 92.05% of the total sequencing data, while in the control group, these four phyla accounted for 93.49% of the total sequencing data (Fig. 3).
Figure 2.
(A) Richness (Chao 1) and (B) diversity (Shannon index) values in the saliva samples of IgAN patients and healthy control subjects. IgAN, immunoglobulin A nephropathy.
Figure 3.
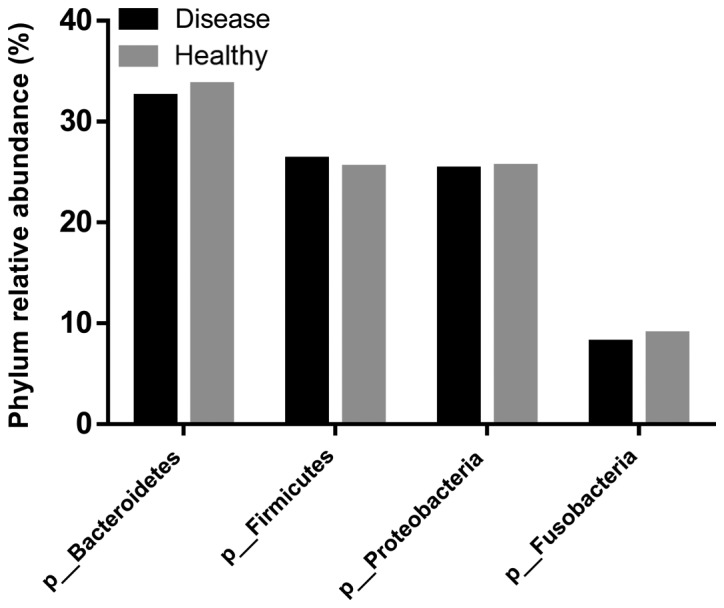
Comparison of the abundance of the phyla Bacteroidetes, Firmicutes, Proteobacteria, and Fusobacteria in the saliva samples of IgAN patients and healthy control subjects. IgAN, immunoglobulin A nephropathy.
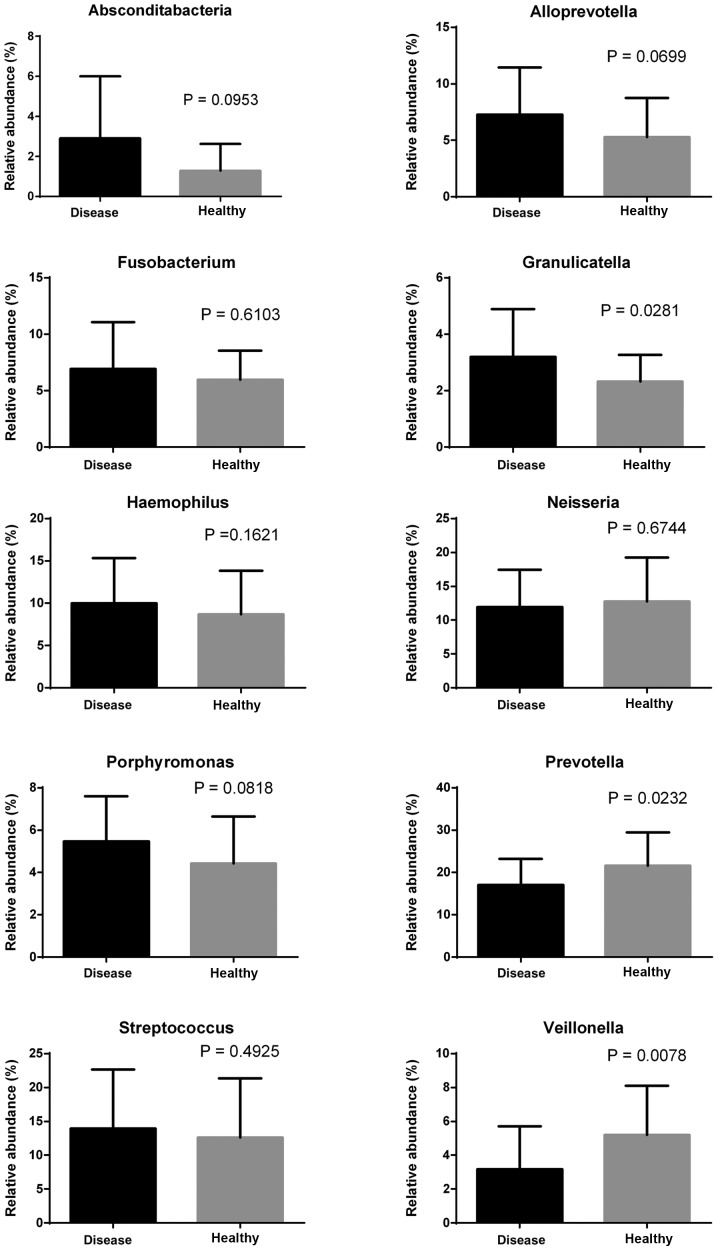
Ten genera with the highest relative abundance (relative abundance >3%) were selected to compare the difference between the experimental group and the control group. The abundance of Granulicatella was significantly lower in the healthy individuals than in the IgAN patients (P<0.05), while Prevotella and Veillonella were significantly more abundant in the healthy population than in IgAN patients (P<0.05 and P<0.01, respectively) (Fig. 4).
Figure 4.
Comparison of differences among the top 10 phyla in the saliva samples of IgAN patients and healthy control subjects. IgAN, immunoglobulin A nephropathy.
Principal component analysis
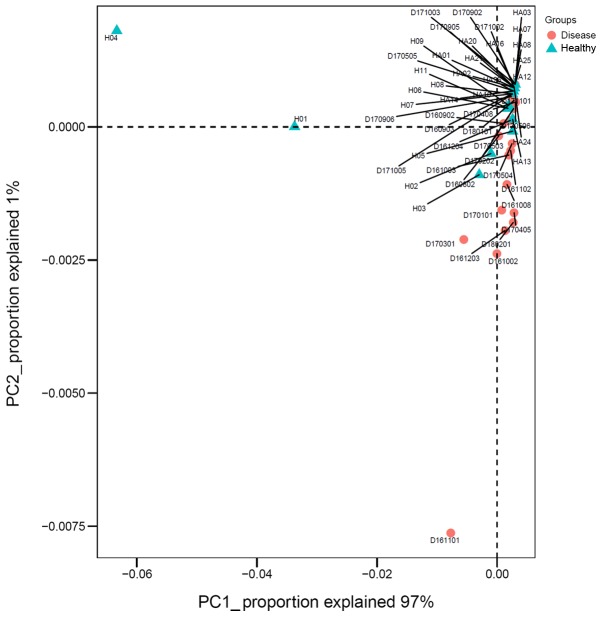
Principal component analysis (PCA) was conducted at the genus level between the IgAN group and the control group. Fig. 5 reveals the main components 1 and 2, which distinguished the IgAN group from the healthy control group. Principal component 1 could explain 97% of differences between the two groups.
Figure 5.
Principal component analysis (weighted UniFrac). PC1 explained 97% of differences between IgAN and healthy control subjects; PC2 explained 1% of differences between IgAN and healthy control subjects. IgAN, immunoglobulin A nephropathy.
Correlation analysis between biochemical indicators and OTUs
The correlation between biochemical indicators, Lee's grading system, and OTUs based on available data was analyzed. The results revealed that the glomerular filtration rate (eGFR) was positively correlated with OTU86 and OTU287 at P<0.05, positively correlated with OTU165 at P<0.001, and negatively correlated with OTU455 at P<0.05. The serum creatinine (sCR) index was negatively correlated with OTU287 and OTU165 at P<0.05 and P<0.001, respectively. Lee's grading system was positively correlated with OTU255 at P<0.05, with OTU200 at P<0.01, and with OTU455 and OTU75 at P<0.001, while it was negatively correlated with OTU86, OTU287, and OTU788 at P<0.05 and negatively correlated with OTU165 at P<0.01 (Fig. 6).
Figure 6.
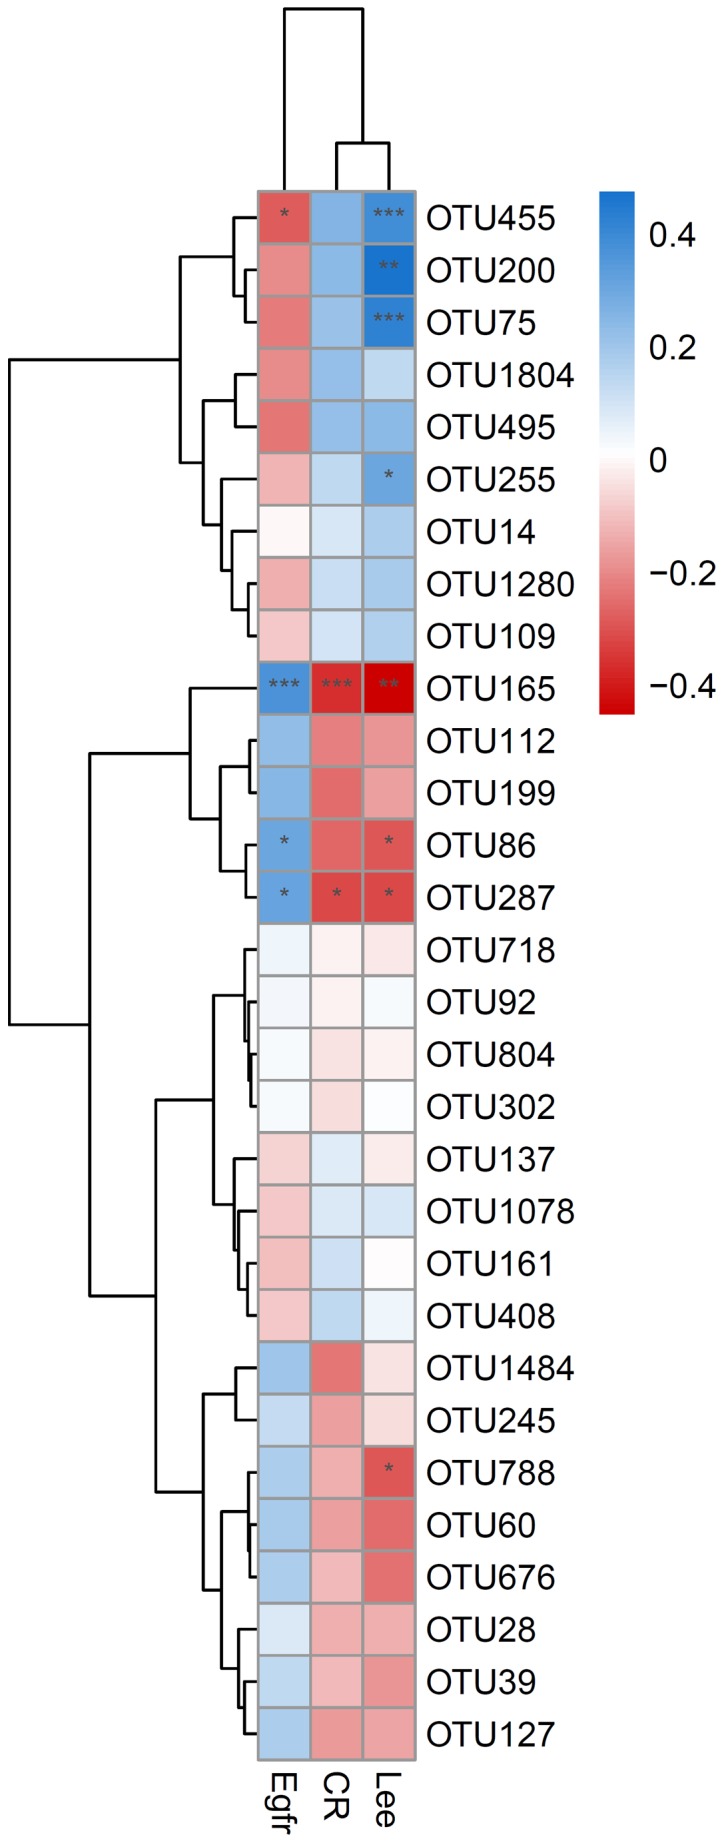
Analysis of the correlation of OTUs with the biochemical indicators sCR and eGFR. Blue indicates a positive correlation, while red indicates a negative correlation; the darker the color, the higher the correlation. OTU165 was significantly positively correlated with sCR and negatively correlated with eGFR; OTU287 was significantly positively correlated with sCR and negatively correlated with eGFR; both OTU86 and OTU455 were significantly negatively correlated with eGFR; *P<0.05, **P<0.01 and ***P<0.001. OTUs, operational taxonomic units; sCR, serum creatinine; eGFR, glomerular filtration rate.
Random forest modeling
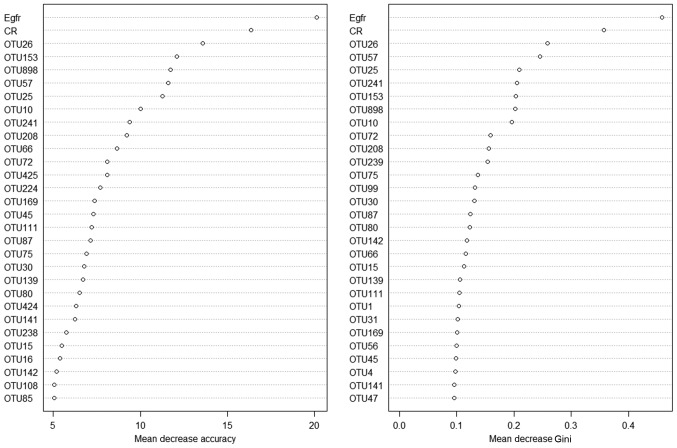
To distinguish the IgAN condition from the healthy status, a random forest model based on the data of the existing samples was established. First, 70% of the samples were used as the training set to build the model. Next, the remaining 30% were used as the test set to verify the model built. Two renal function test biochemical indicators, sCR and eGFR, were then added for modeling. The model without the biochemical indicators revealed a prediction accuracy of 71.25%. After the addition of sCR and eGFR, the model revealed a prediction accuracy of 79.49% (Fig. 7).
Figure 7.
Model prediction in IgAN using OTUs in combination with sCR and eGFR. The higher the number on the X axis, the higher the accuracy. IgAN, immunoglobulin A nephropathy; OTUs, operational taxonomic units; sCR, serum creatinine; eGFR, glomerular filtration rate.
Discussion
The salivary microbes in IgAN patients and control individuals were comprehensively explored using the Illumina HiSeq 4000 sequencing platform and the microbes with a non-culture method, which is commonly used to analyze microbes that are difficult to culture, were directly analyzed (15). Although the species level can be identified under the condition of 3% OTU accuracy based on the full length of 16S rDNA (16), the number of species may be underestimated (17). Therefore, the microbial composition of the V4 region in the 16S rRNA gene was only identified and the microbial composition at the genus level based on the 3% OTU gap rather than the species level was analyzed.
It was revealed that the overall microbial composition of the healthy individuals and IgAN patients was very similar, but there were some significant differences between them at the genus level, consistent with previous studies (18). At the phylum level, IgAN patients and healthy subjects did not differ: Both groups exhibited a high abundance of Firmicutes, Bacteroidetes, Proteobacteria, and Fusobacteria. Piccolo et al (18) revealed that the Firmicutes/Proteobacteria ratio was significantly lower in IgAN patients than in healthy individuals, however in our experiment this ratio was determined to be 1, with no significant decrease in IgAN. Nevertheless, this finding requires confirmation in a larger sample size.
Further analysis at the genus level revealed that levels of Veillonella of Firmicutes and Prevotella of Bacteroidetes were significantly higher in the control subjects than in the IgAN patients, while the levels of Granulicatella of Firmicutes were significantly higher in the IgAN patients than in the control subjects. Several Prevotella spp., including P. melaninogenica, P. intermedia, and P. loescheii, are present in the human oral cavity (19,20). In the salivary microbiome, the relative abundances of Prevotella spp. (P. nigrescens, P. intermedia, P. pallens, and P. salivae) have been revealed to be higher in healthy control individuals compared to IgAN patients, and the only exception is P. aurantiaca (18); the present results were consistent with these previous findings.
The genus Veillonella is common in saliva. Veillonella is present in different parts of the mouth (tongue dorsum, lateral part of the tongue, buccal epithelium, hard palate, soft palate, supragingival plaque of tooth surfaces, subgingival plaque, maxillary anterior vestibule, and tonsillar region) (12). Veillonella, Granulicatella, and Streptococcus can produce antimicrobial compounds (such as bacteriocins and hydrogen peroxide) and inhibit pathogen growth; hence, they are associated with oral health (21). The present results revealed that the abundance of the genus Granulicatella was significantly lower in healthy individuals than in IgAN patients, which is inconsistent with the result of Piccolo et al (18). This inconsistency may have been caused by differences in the environment and diet. Further research is warranted to determine the effect of Granulicatella on the development of IgAN.
Oral dysbacteriosis has been revealed to be closely associated with the occurrence of many malignant tumors and autoimmune diseases (13,14,22). Oral and throat infections are closely related to the occurrence and development of IgAN. For example, nearly 30% of IgAN patients may manifest with pharyngitis-related gross hematuria (23). A study of the tonsils excised from IgAN patients revealed that the proliferation of microbes such as Haemophilus, Campylobacter, and Treponema was abnormally high and closely related to relief from proteinuria (5). The present findings are consistent with studies revealing that the salivary microbial flora is very complex, irrespective of IgAN. Although there was no significant difference between healthy control individuals and IgAN patients at the phylum level, both groups significantly differed in Veillonella, Granulicatella, and Prevotella abundance. Because microbes are affected by many factors such as diet and environment, some OTUs that had a relatively low content were removed and the top 10 genera with high relative abundance were only selected to compare the significant differences between the two groups. Some research has been performed on the composition and identification of microbes in saliva, however varying results have been obtained due to the small sample size. Although the present study revealed significant differences in the three genera between IgAN patients and healthy subjects, the relationship between these differential floras and IgAN remains unclear. Therefore, the role of these differential floras in IgAN requires further studying.
eGFR is an important indicator of renal filtration function, indicating the amount of ultrafiltrate produced by two kidneys per unit time (per minute). sCR, generally considered to be endogenous serum creatinine, is a product of human muscle metabolism. Clinically, detecting sCR is one of the main methods used to understand renal function. Based on the data of the current 53 samples, the correlation between biochemical indicators and OTUs (Fig. 6) was preliminarily analyzed to establish a link between them and to explore the possibility of applying the OTU-assisted clinical indicators sCR and eGFR to diagnose and treat IgAN.
Lee's glomerular grading system is useful to compare biopsy specimens and to predict the natural course of disease in IgAN. The typical pathological change in IgAN is the deposition of IgA in the glomerular mesangium. IgAN can be divided into five stages according to the severity of mesangial proliferation, crescent formation, and tubulointerstitial changes. In the present study, the correlation of pathological changes and OTUs (Fig. 6) was investigated to explore the possible relationship between them.
Although IgAN is the most common chronic glomerular disease, few clinical auxiliary diagnostic methods are available. The poor accuracy of sCR and eGFR in the clinical setting results in some IgAN patients failing to receive timely diagnosis and treatment (24–26) or relying on invasive pathological diagnosis, thereby causing greater physical injury. Therefore, additional auxiliary diagnostic methods need to be developed. In the present study, the existing data was fully utilized and a mathematical model was created, that is expected to distinguish healthy people from IgAN patients to assist clinical diagnosis. When this model is combined with the biochemical indicators sCR and eGFR, its accuracy can reach up to nearly 80% (Fig. 7). However, the availability of more samples is likely to improve the accuracy of the model. Nevertheless, the present study provides the landscape of oral microbiota in IgAN patients; the difference in genera between the IgAN group and control group provides possible therapeutic targets for IgAN, beyond diagnostic applications.
In conclusion, the salivary microbiota landscape in IgAN patients and healthy subjects was compared, the differences were preliminarily analyzed, the correlation of OTUs with biochemical indicators (eGFR and sCR) and pathological changes was explored, and a mathematical model was established to assist in the clinical diagnosis of IgAN. This provides a promising approach for the early diagnosis of IgAN patients, which has implications in the early and effective treatment of this condition.
Acknowledgements
Not applicable.
Funding
The present study was supported by grants from The Shenzhen Foundation of Science and Technology (grant/award nos. JCYJ20160428142040945, JCYJ20180306172449376 and JCYJ20180306172459580), The National Natural Science Foundation of China (grant/award no. 81502410), the Natural Science Foundation of Guangdong Province (grant/award no. 2016A030313028), The Medical Scientific Research Foundation of Guangdong Province (grant/award no. B2018003), and The Shenzhen Longhua District Foundation of Science and Technology (grant/award no. 2017013).
Availability of data and materials
The datasets used and/or analyzed during the current study are available from the corresponding author on reasonable request. All sequencing data related to present study can be found at https://submit.ncbi.nlm.nih.gov/subs/sra/SUB5024679/files.
Authors' contributions
SL and HG supervised the study, wrote the manuscript and analyzed the data. SZ, HZ, RL, CL, PZ, XW and WL collected the samples from patients. YZ and XW revised the manuscript and helped analyze the data. All authors read and approved the final manuscript.
Ethics approval and consent to participate
The study protocol was approved by The Ethics Committee of Guangdong Medical University. Informed consent was obtained from each patient and healthy subject enrolled in the study.
Patient consent for publication
Not applicable.
Competing interests
The authors declare that they have no competing interests.
References
- 1.Moriyama T, Tanaka K, Iwasaki C, Oshima Y, Ochi A, Kataoka H, Itabashi M, Takei T, Uchida K, Nitta K. Prognosis in IgA nephropathy: 30-year analysis of 1,012 patients at a single center in Japan. PLoS One. 2014;9:e91756. doi: 10.1371/journal.pone.0091756. [DOI] [PMC free article] [PubMed] [Google Scholar]
- 2.Barbour SJ, Cattran DC, Kim SJ, Levin A, Wald R, Hladunewich MA, Reich HN. Individuals of Pacific Asian origin with IgA nephropathy have an increased risk of progression to end-stage renal disease. Kidney Int. 2013;84:1017–1024. doi: 10.1038/ki.2013.210. [DOI] [PubMed] [Google Scholar]
- 3.Salvadori M, Rosso G. Update on immunoglobulin A nephropathy, Part I: Pathophysiology. World J Nephrol. 2015;4:455–467. doi: 10.5527/wjn.v4.i4.455. [DOI] [PMC free article] [PubMed] [Google Scholar]
- 4.Floege J, Eitner F. Current therapy for IgA nephropathy. J Am Soc Nephrol. 2011;22:1785–1794. doi: 10.1681/ASN.2011030221. [DOI] [PubMed] [Google Scholar]
- 5.Nagasawa Y, Iio K, Fukuda S, Date Y, Iwatani H, Yamamoto R, Horii A, Inohara H, Imai E, Nakanishi T, et al. Periodontal disease bacteria specific to tonsil in IgA nephropathy patients predicts the remission by the treatment. PLoS One. 2014;9:e81636. doi: 10.1371/journal.pone.0081636. [DOI] [PMC free article] [PubMed] [Google Scholar]
- 6.Sekirov I, Russell SL, Antunes LC, Finlay BB. Gut microbiota in health and disease. Physiol Rev. 2010;90:859–904. doi: 10.1152/physrev.00045.2009. [DOI] [PubMed] [Google Scholar]
- 7.Arumugam M, Raes J, Pelletier E, Le Paslier D, Yamada T, Mende DR, Fernandes GR, Tap J, Bruls T, Batto JM, et al. Enterotypes of the human gut microbiome. Nature. 2011;473:174–180. doi: 10.1038/nature09944. [DOI] [PMC free article] [PubMed] [Google Scholar]
- 8.Bron PA, van Baarlen P, Kleerebezem M. Emerging molecular insights into the interaction between probiotics and the host intestinal mucosa. Nat Rev Microbiol. 2011;10:66–78. doi: 10.1038/nrmicro2690. [DOI] [PubMed] [Google Scholar]
- 9.Maynard CL, Elson CO, Hatton RD, Weaver CT. Reciprocal interactions of the intestinal microbiota and immune system. Nature. 2012;489:231–241. doi: 10.1038/nature11551. [DOI] [PMC free article] [PubMed] [Google Scholar]
- 10.Slack E, Hapfelmeier S, Stecher B, Velykoredko Y, Stoel M, Lawson MA, Geuking MB, Beutler B, Tedder TF, Hardt WD, et al. Innate and adaptive immunity cooperate flexibly to maintain host-microbiota mutualism. Science. 2009;325:617–620. doi: 10.1126/science.1172747. [DOI] [PMC free article] [PubMed] [Google Scholar]
- 11.Kronbichler A, Kerschbaum J, Mayer G. The influence and role of microbial factors in autoimmune Kidney diseases: A systematic review. J Immunol Res. 2015;2015:858027. doi: 10.1155/2015/858027. [DOI] [PMC free article] [PubMed] [Google Scholar]
- 12.Aas JA, Paster BJ, Stokes LN, Olsen I, Dewhirst FE. Defining the normal bacterial flora of the oral cavity. J Clin Microbiol. 2005;43:5721–5732. doi: 10.1128/JCM.43.11.5721-5732.2005. [DOI] [PMC free article] [PubMed] [Google Scholar]
- 13.Mager DL, Haffajee AD, Devlin PM, Norris CM, Posner MR, Goodson JM. The salivary microbiota as a diagnostic indicator of oral cancer: A descriptive, non-randomized study of cancer-free and oral squamous cell carcinoma subjects. J Transl Med. 2005;3:27. doi: 10.1186/1479-5876-3-27. [DOI] [PMC free article] [PubMed] [Google Scholar]
- 14.Farrell JJ, Zhang L, Zhou H, Chia D, Elashoff D, Akin D, Paster BJ, Joshipura K, Wong DT. Variations of oral microbiota are associated with pancreatic diseases including pancreatic cancer. Gut. 2012;61:582–588. doi: 10.1136/gutjnl-2011-300784. [DOI] [PMC free article] [PubMed] [Google Scholar]
- 15.Watanabe H, Goto S, Mori H, Higashi K, Hosomichi K, Aizawa N, Takahashi N, Tsuchida M, Suzuki Y, Yamada T, et al. Comprehensive microbiome analysis of tonsillar crypts in IgA nephropathy. Nephrol Dial Transplant. 2017;32:2072–2079. doi: 10.1093/ndt/gfw343. [DOI] [PubMed] [Google Scholar]
- 16.Acinas SG, Klepac-Ceraj V, Hunt DE, Pharino C, Ceraj I, Distel DL, Polz MF. Fine-scale phylogenetic architecture of a complex bacterial community. Nature. 2004;430:551–554. doi: 10.1038/nature02649. [DOI] [PubMed] [Google Scholar]
- 17.Pedrós-Alió C. Marine microbial diversity: Can it be determined? Trends Microbiol. 2006;14:257–263. doi: 10.1016/j.tim.2006.04.007. [DOI] [PubMed] [Google Scholar]
- 18.Piccolo M, De Angelis M, Lauriero G, Montemurno E, Di Cagno R, Gesualdo L, Gobbetti M. Salivary microbiota associated with immunoglobulin A nephropathy. Microb Ecol. 2015;70:557–565. doi: 10.1007/s00248-015-0592-9. [DOI] [PubMed] [Google Scholar]
- 19.Gmur R, Thurnheer T. Direct quantitative differentiation between Prevotella intermedia and Prevotella nigrescens in clinical specimens. Microbiology. 2002;148:1379–1387. doi: 10.1099/00221287-148-5-1379. [DOI] [PubMed] [Google Scholar]
- 20.Kononen E. Pigmented Prevotella species in the periodontally healthy oral cavity. FEMS Immunol Med Microbiol. 1993;6:201–205. doi: 10.1111/j.1574-695X.1993.tb00327.x. [DOI] [PubMed] [Google Scholar]
- 21.Kumar PS, Griffen AL, Moeschberger ML, Leys EJ. Identification of candidate periodontal pathogens and beneficial species by quantitative 16S clonal analysis. J Clin Microbiol. 2005;43:3944–3955. doi: 10.1128/JCM.43.8.3944-3955.2005. [DOI] [PMC free article] [PubMed] [Google Scholar]
- 22.Finegold SM. Host factors predisposing to anaerobic infections. FEMS Immunol Med Microbiol. 1993;6:159–163. doi: 10.1111/j.1574-695X.1993.tb00319.x. [DOI] [PubMed] [Google Scholar]
- 23.Moreno JA, Martin-Cleary C, Gutierrez E, Toldos O, Blanco-Colio LM, Praga M, Ortiz A, Egido J. AKI associated with macroscopic glomerular hematuria: Clinical and pathophysiologic consequences. Clin J Am Soc Nephrol. 2012;7:175–184. doi: 10.2215/CJN.01970211. [DOI] [PubMed] [Google Scholar]
- 24.Shemesh O, Golbetz H, Kriss JP, Myers BD. Limitations of creatinine as a filtration marker in glomerulopathic patients. Kidney Int. 1985;28:830–838. doi: 10.1038/ki.1985.205. [DOI] [PubMed] [Google Scholar]
- 25.Caregaro L, Menon F, Angeli P, Amodio P, Merkel C, Bortoluzzi A, Alberino F, Gatta A. Limitations of serum creatinine level and creatinine clearance as filtration markers in cirrhosis. Arch Intern Med. 1994;154:201–205. doi: 10.1001/archinte.154.2.201. [DOI] [PubMed] [Google Scholar]
- 26.Rule AD, Rodeheffer RJ, Larson TS, Burnett JC, Jr, Cosio FG, Turner ST, Jacobsen SJ. Limitations of estimating glomerular filtration rate from serum creatinine in the general population. Mayo Clinic Proc. 2006;81:1427–1434. doi: 10.4065/81.11.1427. [DOI] [PubMed] [Google Scholar]
Associated Data
This section collects any data citations, data availability statements, or supplementary materials included in this article.
Data Availability Statement
The datasets used and/or analyzed during the current study are available from the corresponding author on reasonable request. All sequencing data related to present study can be found at https://submit.ncbi.nlm.nih.gov/subs/sra/SUB5024679/files.


