

Abstract
Restraint water-immersion stress (RWIS) can induce a gastric mucosal lesions within a few hours. The medial prefrontal cortex (mPFC) is involved in the RWIS process. The present study investigated the modulatory effects and molecular mechanisms of the mPFC on gastric function under an RWIS state. Male Wistar rats were divided into four groups; namely, the control, RWIS 4 h (RWIS for 4 h only), sham-operated and bilateral-lesioned (bilateral-lesioned mPFC) groups. The gastric erosion index (EI) and gastric motility (GM) were determined, and the proteomic profiles of the mPFC were assessed by isobaric tags for relative and absolute quantitation (iTRAQ) coupled with two-dimensional liquid chromatography and tandem mass spectrometry. Additionally, iTRAQ results were verified by western blot analysis. Compared with the RWIS 4 h group and the sham-control group, the bilateral-lesioned group exhibited a significantly lower EI (P<0.01). In the bilateral-lesioned group, RWIS led to a significant decrease in EI and GM. When comparing the control and RWIS 4 h groups, 129 dysregulated proteins were identified, of which 88 were upregulated and 41 were downregulated. Gene Ontology functional analysis demonstrated that 29 dysregulated proteins, including postsynaptic density protein 95, were directly associated with axon morphology, axon growth and synaptic plasticity. Ingenuity pathway analysis revealed that the dysregulated proteins were mainly involved in neurological disease signaling pathways, including the NF-κB and ERK signaling pathways. These data indicated that the presence of the mPFC exacerbates gastric mucosal injury in awake rats during RWIS. Although the quantitative proteomic analysis elucidated the nervous system molecular targets associated with the production of gastric mucosal lesions, such as the role of PSD95. The underlying molecular mechanisms of synaptic plasticity need to be further elucidated.
Keywords: restraint water-immersion stress, stress-induced gastric mucosal lesion, medial prefrontal cortex, proteome, postsynaptic density protein 95
Introduction
Stress-induced gastric mucosal lesion (SGML) is one of the most common visceral complications following trauma. Restraint water-immersion stress (RWIS) is a type of heavy-duty compound stress, including physiological stress (e.g. hunger, restraint and cold water) and psychological stress (e.g. anger, conditioned fear and anxiety), that can cause serious gastrointestinal dysfunction, and has been widely used to study the pathogenesis of SGML to identify medications that can cure SGML (1–6). Previous studies have demonstrated that hyperfunction of the parasympathetic nervous system contributes to the peripheral mechanisms of gastrointestinal dysfunction induced by RWIS (3–8). Concerning the central mechanisms of this dysfunction, the medulla gastrointestinal centers (primary central regions) and the hypothalamus (a higher-level central region) are known to be involved in these physiological processes (9–15). However, little is known regarding the roles of the cerebral cortex (the highest-level central region) in this process.
The medial prefrontal cortex (mPFC) comprises the infralimbic cortex (IL) and prelimbic cortex (PL). The PL has been implicated in various cognitive, emotional and executive functions, and thus is considered the ‘cognitive-emotional cortex’ (16). The IL exerts a pronounced influence on visceral/autonomic nerve activities through its direct) projections to the medulla gastrointestinal motor centers. The IL is consequently involved in regulating gastrointestinal and cardiovascular activities, and thus is also considered the ‘visceral motor cortex’ (17,18). The expression levels of Fos in the PL and IL have been demonstrated to be increased during stress (19,20), and the present study also revealed that the activities of PL and IL neurons increased during RWIS in rats, which suggested that the mPFC are involved in the organismal response to RWIS.
Previous studies have mainly focused on the emotional and cognitive functions of the mPFC (21,22), with few reports examining the association between the damaged mPFC and autonomic function activity (23,24). Little is known regarding the involvement of the mPFC in the process of modulating gastrointestinal function under the RWIS state, and the possible roles the mPFC serves. Therefore, one purpose of the present study was to investigate the modulatory effects of the mPFC on gastric function under the RWIS state.
Additionally, to investigate how the mPFC regulated gastric function during RWIS and to further explore the neuromolecular mechanisms of SGML, a combined isobaric tag for relative and absolute quantitation (iTRAQ)-liquid chromatography-tandem mass spectrometry (LC-MS/MS)-based proteomics approach, one of the most sensitive proteomic technologies that can detect and quantitatively analyze low-abundance proteins in complex biological samples (25,26), was used to identify differences in protein expression in the mPFC of RWIS rats.
Materials and methods
Animals
Adult male Wistar rats (n=60; age, 7–8 weeks, body weight, 280–320 g) provided by the Experimental Animal Centre of Shandong Normal University (Jinan, China), were housed at 22±2°C under a 12 h light/dark cycle, a relative humidity of 50–60% and with free access to food and water prior to the initiation of RWIS. Prior to the experiments, rats were fasted for 24 h, but allowed access to tap water ad libitum.
Experimental design
Grouping
Rats were selected randomly and divided into four groups; namely, the control, RWIS 4 h, sham-operated and bilateral-lesioned groups (Table I). Rats in the control group (n=18) and RWIS 4 h group (n=18) were used in the analysis of proteomics (6 rats/group) and western blotting (WB; 12 rats/group), and their stomachs were removed to measure the erosion index (EI). Rats in the sham-operated group (n=12) and bilateral-lesioned group (n=12) were used to record gastric motility (GM; 6 rats/group) and to analyze EI (6 rats/group).
Table I.
Design of the experiment.
| Group | Number, n | Surgery | RWIS for 4 h | Detection |
|---|---|---|---|---|
| Control group | 18 | No | No | EI, Proteomics and WB |
| RWIS 4 h group | 18 | No | Yes | EI, Proteomics and WB |
| Sham-operated group | 12 | Sham | Yes | GM and EI |
| Bilateral-lesioned group | 12 | Bilateral-lesioned | Yes | GM and EI |
Bilateral-lesioned, bilateral-lesioned medial prefrontal cortex; RWIS, restraint water-immersion stress; GM, gastric motility; EI, erosion index; WB, western blotting.
Stress protocols
RWIS was performed as previously described (10,11). Experiments were performed between 7:00 am and 12:00 pm. All procedures were performed according to the National Institutes of Health Guidelines for the Care and Use of Laboratory Animals (http://ishare.iask.sina.com.cn/f/13722703.html) and were approved by the Institutional Animal Care and Use Committee of Shandong Normal University (approval no. AEECSDNU2018003).
Gastrointestinal dysfunction in rats with mPFC lesions exposed to RWIS
Stereotaxis and lesion
To estimate the gastrointestinal dysfunction induced by RWIS, rats were anaesthetized with isoflurane in a three-way valve connection induction box (anesthetic dose, 4%; air flow rate, 700–800 ml/min) and placed on a stereotaxic apparatus (cat. no. 51600; Stoelting Co.). Subsequently, the anesthetic concentration was adjusted to maintain an anesthetic dose of 2.5% and an air flow rate of 600 ml/min. The procedure was carried out when no response was observed when the tail or toes of the rat were clamped. After the skull was exposed and the area was disinfected, mPFC lesions were produced in the PL and IL, according to the Atlas of Paxinos and Watson (27). To ensure complete destruction of the PL, which was ~2.6 mm in length, two sites of the PL were targeted, an anterior site (4.5 mm rostral to the obex, a depth of 3.4 mm below the surface of the obex, and 0.6 mm lateral to the midline) and a posterior site (3.1, 3.6 and 0.6 mm), while the site of the IL targeted was 3.1, 5.0 and 0.5 mm. The microelectrodes were inserted into the target brain area, which was damaged by a direct current method (current intensity, 2.0 mA; 4 sec; repeated five times). For rats in the sham-operated group, microelectrodes were inserted into the bilateral target brain areas without electricity and were removed after the same duration as that applied to the lesioned group. To prevent infection in the rats, all surgical instruments were disinfected. Following surgery, rats were housed in groups of two with soft bedding and were injected with gentamicin [8×10⁴ U; intraperitoneal (i.p.)] daily for 3 consecutive days to prevent sepsis.
Recording and analysis of GM
Animals were placed on a small-animal operating table in the supine position. A midline laparotomy was performed, and a latex balloon filled with water (5 mm in diameter) was inserted into the pyloric region through a small incision in the forestomach wall. The balloon was connected to a pressure transducer via a thin polyethylene tube. The rats were then exposed to RWIS for 4 h. GM signals were fed into the Biological Function Experiment system (BL-420; Chengdu Taimeng Software Co., Ltd.). GM was recorded for at least 20 min prior to RWIS and then twice per hour for 10 min starting from the 2nd h during the RWIS (Fig. 1). Alterations in gastric contractions, including the frequency, duration, amplitude, GM index and contraction fraction, were analyzed 20 min before the RWIS (segment A), at the 2nd h during the RWIS (segments B and C), at the 3rd h (segments D and E) and at the 4th hour (segments F and G). The GM index and contraction fraction were analyzed to reflect the duration of the contraction state of the rat stomach. The motility index was defined as the product of amplitude and duration for every wave of contraction in the study, while contraction fraction=(total duration/20 min) ×100%. To eliminate disturbances caused by respiration or muscle tremors in the rats, contraction waves with an amplitude of >2 mmHg were selected for analysis.
Figure 1.

Illustration of gastric motility recordings. Segment A was the 20 min before stress; segments B and C represent 10 min each in the 2nd hour of stress; segments D and E represent 10 min each in the 3rd hour; segments F and G represent 10 min each in the 4th hour. RWIS, restraint water-immersion stress.
Cardiac perfusion and histologic identification
Rats were deeply anesthetized with a pentobarbital-Na+ injection (100 mg/kg BW; i.p.) and perfused via the ascending aorta with 100 ml 0.9 mol/l normal saline followed by 400 ml 40 g/l formaldehyde. Subsequently, brains were removed, placed in the same fixative for 4 h (4°C) and infiltrated with 200 g/l sucrose overnight at 4°C. A series of coronal sections of the mPFC were cut (30 µm thick) in a cryostat and stained via the Nissl method (28) at 45°C for 30 min to determine whether the location of the damaged site was accurate (Fig. 2). Rats with damage in the appropriate range were selected for subsequent GM statistical analyses.
Figure 2.
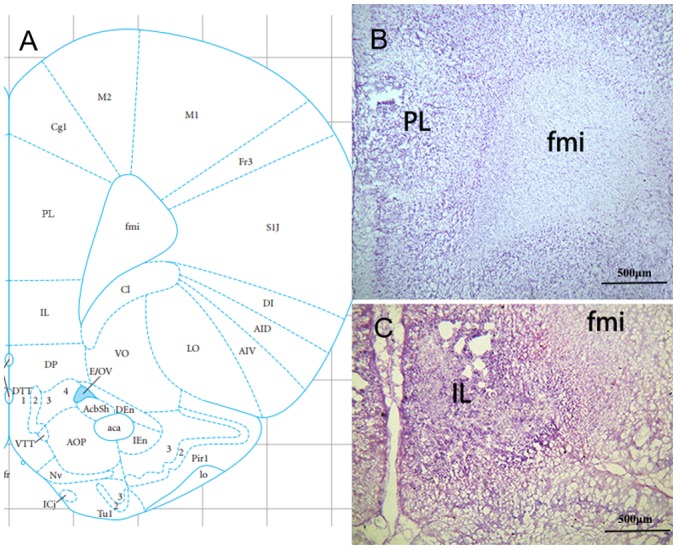
Histological sites of microelectrodes in the PL and IL of the rat. (A) The position of the PL in the brain atlas (27). (B) Representative frozen brain sections of PL. (C) Representative frozen brain sections of IL. fmi, forceps minor of the corpus callosum; IL, infralimbic cortex; PL, prelimbic cortex.
Proteomic analysis in the mPFC of rats exposed to RWIS
Sample preparation
Rats were deeply anesthetized with a pentobarbital-Na+ injection (100 mg/kg BW; i.p.) and sacrificed by decapitation. The brains were rapidly dissected, and the mPFCs (coordinates, 4.64–2.60, 2.40–5.40 and 1.20 mm) was harvested. To minimize the individual differences among rats, three individual samples were mixed for protein extraction and 2 repeated protein extracts were prepared for each group.
Protein extraction
The sample was resuspended in ~8 times the volume of lysis buffer [4% SDS, 100 mM HEPES (pH 7.6), containing protease inhibitor cocktail and PMSF]. The homogenate was high frequency shocked for 2 min, placed on ice for 2 min (repeated 5 times), and then boiled for 10 min. After centrifugation at 25,000 × g for 30 min at 4°C, the supernatant was collected and stored at-80°C. The total protein concentration was measured using a Bicinchoninic Acid (BCA) kit (Beijing Transgen Biotech Co., Ltd.).
In-solution digestion and labeling
Equal amounts of the extracted protein were mixed according to the groupings and then precipitated with acetone overnight at 4°C. After the protein was resuspended in triethylammonium bicarbonate buffer, protein quantification was performed using the BCA kit. The proteins were reduced by 5 mmol/l dithiothreitol at 56°C for 30 min and alkylated by 10 mM indoleacetic acid at room temperature for 30 min. The sample was then diluted with 50 mM ammonium bicarbonate until the concentration of urea was <1 M. Trypsin (Sigma-Aldrich; Merck KGaA) was added to the sample at a mass ratio of 1:50 (enzyme:protein) at 37°C for 12 h. The iTRAQ labeling of digested peptide samples was performed following the manufacturer's protocol with 8-plex isobaric tags for relative and absolute quantitation (iTRAQ) labeling kit (AB Sciex, USA). The purified peptides were collected and stored at −80°C until further use.
Ultra-performance liquid chromatography (UPLC)- quadrupole linear ion trap tandem mass spectrometry (QTRAP-UPLC-MS/MS) detection
The mixed peptides were redissolved with buffer A (20 mM ammonium formate in water, pH 10.0), and then fractionated on a Waters UPLC using a C 18 column (c18; 2.1×50 mm; 1.7 µm; Waters Corporation). Peptides were eluted at a flow rate of 600 µl/min with a linear gradient of 5–35% solvent B (acetonitrile) over 10 min, with solvent A composed of 20 mM ammonium formate with pH adjusted to 10. Following the separation, the column was re-equilibrated at initial conditions for 15 min. The absorbance at 214 nm was monitored, and a total of 10 fractions were collected per sample.
The fraction was separated by nano-high-performance liquid chromatography (Eksigent) on a secondary RP analytical column (Eksigent Technologies, Inc.; C18; 3 µm; 150 mm × 75 µm). Peptides were subsequently eluted using the following gradient conditions: Phase B (98% ACN with 0.1% formic acid) from 5–40% B (0–100 min). The total flow rate was maintained at 300 nl/min. An electrospray voltage of 2.5 kV vs. the inlet of the mass spectrometer was used.
The QTOF 4600 mass spectrometer was operated in information-dependent data acquisition mode to switch automatically between MS and MS/MS acquisition. MS spectra were acquired across the mass range of 350–1,200 m/z. The 25 most intense precursors were selected for fragmentation per cycle with a dynamic exclusion time of 18 sec.
Data processing
All MS/MS samples were analyzed using Mascot (version 2.3.0; Matrix Science, Ltd.). Mascot was set up to search the UniProt_rat database (https://www.uniprot.org; 35,962 sequences) with a fragment ion mass tolerance of 0.1 Da and a parent ion tolerance of 25.0 PPM. Carbamidomethyl of cysteine, iTRAQ8 plex of lysine and the n-terminus were specified in Mascot as fixed modifications. Oxidation of methionine and iTRAQ8 plex of tyrosine were specified in Mascot as variable modifications.
Scaffold (version Scaffold_4.4.1.1; Proteome Software, Inc.) was used to validate the LC-MS/MS-based peptide and protein identifications. Peptide identifications were accepted at a false discovery rate (FDR) <1.0% by the Scaffold Local FDR algorithm (29). Protein probabilities were assigned by the Protein Prophet algorithm (30). Only those proteins with a probability >90% were accepted.
Quantitative data analysis
Scaffold Q+ (version Scaffold_ 4.4.5; Proteome Software, Inc.) was used to quantitate iTRAQ peptide and protein identifications. In the present study, a ± 1.2-fold change between rats in the control and RWIS groups and P<0.05, calculated by a t-test, was set as the threshold for categorizing upregulated and downregulated proteins.
Bioinformatic analysis
Gene Ontology (GO) annotation, including biological processes (BP), cellular components (CC) and molecular functions (MF), and pathway enrichment analysis of all identified proteins and differentially expressed proteins were implemented using the online tool Database for Annotation, Visualization and Integrated Discovery 6.8 (http://david.abcc.ncifcrf.gov/). Ingenuity Pathways Analysis (IPA) software (version 7.5; Ingenuity Systems; Qiagen Bioinformatics) was used to identify the biological functions and signaling pathways in the annotations of the differentially expressed proteins. The GO annotations involving signaling pathways and networks were ranked in terms of the enrichment of the differentially expressed proteins.
Validation of proteins by WB
iTRAQ results were verified using WB. Rats were deeply anesthetized with a pentobarbital-Na+ injection (100 mg/kg BW; i.p.) and sacrificed by decapitation, and the mPFC was harvested and immediately homogenized in ~1 g:3 ml mass to weight RIPA lysis buffer [50 mmol/l Tris-HCl (pH 7.4), 150 mmol/l NaCl, 1 mmol/l PMSF, 1 mmol/l EDTA, 1% Triton X-100, 0.1% SDS; pH 7.6]. To minimize the individual differences of the rats, 2 individual samples were mixed for protein extraction and 3 repeated protein extracts protein extracts for each group. Following incubation on ice for 30 min, homogenates were centrifuged at 14,400 × g for 15 min at 4°C and supernatants were collected. The total protein concentration was measured using the BCA kit. To minimize the individual differences between the rats, three individual samples were mixed for protein extraction, and protein extracts were prepared in triplicate or quadruplicate for each group. Total protein extracts (30 µg) were mixed with 5X SDS sample buffer [62.5 mM Tris-HCl (pH 6.8), 2% SDS, 10% glycerol, 5% β-mercaptoethanol, 0.005% bromophenol blue] and were separated by SDS-PAGE on 10% acrylamide gels. Proteins were electrotransferred onto PVDF membranes (EMD Millipore, 60 V, 4°C, 150 min) following activation with 100% methanol at room temperature for 5 min. The membranes were blocked with 5% non-fat dry milk in 0.01 M PBS containing 0.1% Tween-20 for 2 h at room temperature, and then incubated at 4°C overnight with the primary antibodies targeting postsynaptic density protein 95 (PSD95; 1:2,000 dilution; cat. no. ab18258; Abcam), N-myc downregulated gene family 1 (NDRG1; 1:1,000 dilution; cat. no. CY7079; Shanghai Abways Biotechnology Co., Ltd.), SYN (1:800 dilution; cat. no. ab32594; Abcam), and GAPDH (1:2,000 dilution; cat. no. AB0037; Shanghai Abways Biotechnology Co., Ltd.) or β-tubulin (1:4,000 dilution; cat. no. AB0039; Shanghai Abways Biotechnology Co., Ltd.). Following three rinses in TBS with Tween-20, the secondary antibodies (horseradish peroxidase-conjugated anti-rabbit; 1:1,000 dilution; cat. no. SP9001; OriGene Technologies, Inc.) were added, and the membranes were incubated for 1 h at room temperature. After the membranes were rinsed, protein expression levels were detected by enhanced chemiluminescence and visualized by autoradiography (exposure time, 1–3 min; Omni-ECL™; cat. no. SQ201; Epizyme Biotech). In order to facilitate the segmentation of the PVDF membranes, the molecular weight between the internal reference and the target protein should have a significant size difference; therefore, GAPDH (37 kDa) was utilized as the loading control for PSD95 (95 kDa) and NDRG1(43 kDa), while β-tubulin (55 kDa) was used for SYN (38 kDa). For quantitative assessment, the integrated optical density of SYN, NDRG1 and PSD95 was measured using Image-Pro Plus version 6.0 software (Media Cybernetics, Inc.).
Evaluation of gastric mucosal damage
The stomachs of the sacrificed rats were removed, placed in 1% formaldehyde solution at room temperature for 30 min and incised along the greater curvature. Gastric mucosal lesions were measured using the EI (31).
Statistical analysis
The statistical procedures were performed using SPSS version 20.0 software (IBM Corp.). The results are presented as the mean ± mean squared error. Statistical analyses of the WB data (n=3) and gastric contraction index for the sham-operated group (n=6) and bilateral-lesioned group (n=6) was performed using a Student's t-test. Statistical analyses of the gastric contraction index before (n=6) RWIS, and at the 2nd, 3rd or 4th h after RWIS, were performed by self-matched analyses; the 2nd, 3rd and 4th h after RWIS, as well as the EI (n=6), were analyzed by one-way ANOVA followed by a Student-Newman-Keuls post hoc test. P<0.05 was considered to indicate a statistically significant difference.
Results
Gastric mucosal damage induced by RWIS
Spots and lineal hemorrhages were observed in the gastric mucosa in all groups except for the control group (0.00±0.00; Fig. 3). The EIs in the RWIS 4 h and sham-operated groups reached 38.50±3.62 and 36.83±4.42, respectively, with no significant difference between them (P>0.05). Compared with the EI in the RWIS 4 h and sham-operated groups, the EI in the bilateral-lesioned group (6.83±2.24) was alleviated significantly (P<0.01).
Figure 3.
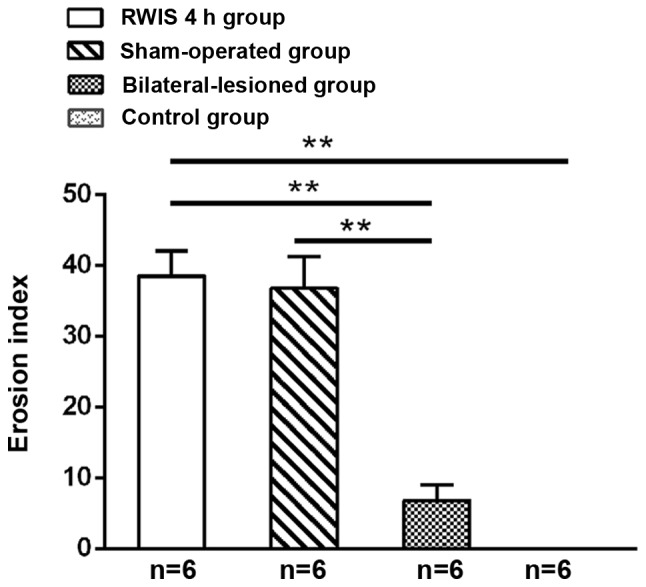
Effect of RWIS on gastric mucosal lesions in medial prefrontal cortex-lesioned rats. Mean ± MSE. **P<0.01. RWIS, restraint water-immersion stress.
Effects of bilateral-lesioned mPFC on GM in rats during RWIS
A s shown in Fig. 4, RWIS led to an similar alteration tendency of the curves of GM, from a high-frequency, short-term and low-amplitude fast wave into a low-frequency, long-term and high-amplitude slow wave, which is a sign of gastric hypermotility. Namely, the frequency of the contractile waves was reduced, while the duration and amplitude of the contraction waves were prolonged during RWIS in all groups.
Figure 4.

Effect of restraint water-immersion stress on curves of gastric motility in awake rats of the sham-operated group. n=6.
Further analysis of GM demonstrated the differential influence degree between different groups, especial in motility index and contraction fraction (Fig. 5). In the sham-operated group, the contraction fraction and motility index were significantly increased during stress compared with before stress (P<0.01 or P<0.05). In addition, with the prolongation of the RWIS time, the motility index gradually increased in a time-dependent manner (Fig. 5A and B). By contrast, in the bilateral-lesioned group, the motility index and the contraction fraction were significantly lower during stress compared with before stress, particularly in the 2nd hour of stress (P<0.01 or P<0.05; Fig. 5C and D). The percentages of contraction and the motility indexes for the sham-operated and bilateral-lesioned groups at different periods of RWIS (2, 3 and 4 h) were significantly different (P<0.01 or P<0.05; Fig. 5E and F). Overall, bilateral lesions of the PL and the IL exhibited a strong inhibitory tendency on the motility index in awake RWIS rats.
Figure 5.

Effect of sham-operated and bilateral-lesioned prelimbic cortex and infralimbic cortex on the GM index and percentage of contraction in the awake RWIS rats. (A) Mean data for the GM index before and during RWIS in the Sham-operated group. (B) Mean data for the contraction fraction before and during RWIS in the Sham-operated group. (C) Mean data for the GM index before and during RWIS in the Bilateral-lesioned group. (D) Mean data for the contraction fraction before and during RWIS in the Bilateral-lesioned group. (E) Comparison of the effect of RWIS on GM index between groups in awake rats. (F) Comparison of the effect of RWIS on contraction fraction between groups in awake rats. n=6; mean ± MSE. *P<0.05 and **P<0.01 vs. respective control. GM, gastric motility; RWIS, restraint water-immersion stress.
Proteomic analysis in the mPFC of rats exposed to RWIS
Identification of dysregulated proteins
Relative protein expression values were compared between the control and RWIS 4 h groups to identify differentially expressed proteins (Fig. 6A). In the present study, 129 unique proteins were classified as differentially expressed proteins (fold change ratio ≥1.2; P<0.05), of which 88 were significantly upregulated and 41 downregulated (Fig. 6B). The differentially expressed proteins were grouped into nine functional groups (Table SI). Of all dysregulated proteins, 24.81% (n=32 proteins) were classified as regulating proteins. Structural proteins were the second largest group with a total of 23.26% (n=30) of the proteins. Of additional proteins identified, 20.16% (n=26) were assigned to the enzyme group, 9.30% (n=12) were transcriptional proteins, 7.75% (n=10) were associated with signal transduction, 5.43% (n=7) were transport proteins, and 4.65% (n=6) were cell cycle proteins. Only 1.55% (n=2) were found to belong to the chaperone group, while 3.10% (n=4) were unknown in function. In the enzyme group, 30.77% (n=8) were associated with energy metabolism, 23.08% (n=6) with carbohydrate metabolism and 19.23% (n=5) with amino acid metabolism. Of the other enzymes identified, 7.70% (n=2) were involved in lipid acid metabolism, nucleic acids and the proteasome each, while 3.85% (n=1) was assigned to cofactors and vitamins.
Figure 6.

Identification of the proteomic differences in the medial prefrontal cortex of rats between the control and RWIS 4 h groups by iTRAQ analysis. (A) Hierarchical clustering graph. A1 and A2 represent two repeats of the iTRAQ procedure conducted in the control cohort, while B1 and B2 represent two repeats conducted in the RWIS 4 h group. (B) Volcano plot representing the protein abundance alterations between the control group and the RWIS 4 h group. A total of 129 dysregulated proteins with ≥1.2-fold change and P<0.05 were identified. iTRAQ, isobaric tag for relative and absolute quantification; RWIS, restraint water-immersion stress.
GO annotation of the dysregulated proteins
On the premise that each dysregulated protein was assigned at least one term, the GO annotation was applied to reveal the CCs (Fig. 7A), MFs (Fig. 7B) and BPs (Fig. 7C) of the identified proteins. Out of the dysregulated proteins, 20%were cytoplasm-associated proteins. Other main categories were ‘extracellular exosome’ (17%), ‘nucleus’ (17%), ‘mitochondrion’ (9%), ‘cytosol’ (8%) and ‘membrane’ (7%; Fig. 7A). The MFs of the dysregulated proteins included ‘receptor binding’, ‘ATP-dependent RNA helicase activity’, ‘poly(A) binding’, ‘structural molecule activity’, ‘scaffold protein binding’ and ‘protein homodimerization activity’ (Fig. 7B). The GO annotation showed that the 129 dysregulated proteins were mainly involved in BPs such as ‘multicellular organism development’, ‘positive regulation of mRNA splicing’, ‘neurofilament bundle assembly’, ‘intermediate filament polymerization or depolymerization’, ‘response to lipid’, ‘lysosomal lumen acidification’, ‘positive regulation of plasminogen activation’, ‘response to acrylamide’ and adult locomotory behavior’ (Fig. 7C).
Figure 7.

Gene Ontology annotation of the dysregulated proteins between the control and restraint water-immersion stress 4 h groups. (A) Cellular component terms of the identified proteins. (B) Molecular function terms. (C) Biological process terms. Only the first fifteen terms are shown.
IPA network analysis of the dysregulated proteins
Since the molecular function of proteins in organisms coordinates with various biological molecules, the roles of the differentially expressed proteins were further analyzed using the IPA tool according to -log (P-value). The IPA network analysis demonstrated that the dysregulated proteins were enriched in 79 functions, including ‘neurological disease’, ‘organismal injury and abnormalities’, ‘psychological disorders’, ‘nervous system development and function’, ‘cell morphology’ and ‘tissue morphology’ (Fig. 8A). Notably, 22% (n=29) of all dysregulated proteins were directly associated with nervous system functions, including axon morphology, axon growth, synaptic plasticity, and nerve development and apoptosis (Table II). NDRG1 encodes a 43 kDa protein and has been reported to be involved in stress responses and immunity (32–35). The discs large MAGUK scaffold protein 4 gene encodes PSD95, a protein localized at the postsynaptic density in neurons, which is associated with glutamatergic receptor signaling [N-methyl-D-aspartate (NMDA); amino-3-hydroxy-5-methyl-4-isoxazolepropionic acid] and is probably associated with synaptic plasticity (31,36–38). Meanwhile, the dysregulated proteins were co-enriched into five networks linked to repair, energy production, neurological disease and nervous system development and function. The top two networks of dysregulated proteins also exhibited focus hubs containing NF-κB signaling (22 upregulated proteins and 8 downregulated proteins) and ERK1/2 signaling (22 upregulated proteins and 7 downregulated proteins; Fig. 8B and C).
Figure 8.

Key signaling pathways involving the differentially expressed proteins induced by restraint water-immersion stress. (A) Top ten enriched pathways of the differentially expressed proteins for the functional map. (B) Key signaling pathways associated with cell cycle, repair and energy production. (C) Key signaling pathways associated with neurological disease and nervous system development and function. Red indicates the upregulated proteins, while green indicates the downregulated proteins. Only the top two networks of dysregulated proteins are shown.
Table II.
Dysregulated proteins associated with neurotransmission, synapse and neuronal morphology in the medial prefrontal cortex of rats upon RWIS.
| A, Axon morphology | ||||
|---|---|---|---|---|
| Accession no. | Protein name | Gene name | MW (kDa) | FC |
| F1M3A4_RAT | Neuronal tyrosine-phosphorylated phosphoinositide-3-kinase adaptor 2 | NEWGENE_1305560 | 78 | 4.7968↓ |
| A0A0G2K7K9_RAT | Calmodulin-regulated spectrin-associated protein 2 | Camsap2 | 166 | 0.5300↑ |
| A0A0G2JTK1_RAT | Tau tubulin kinase 1 | Ttbk1 | 148 | 0.3666↓ |
| B, Axon growth | ||||
| Accession no. | Protein name | Gene name | MW(kDa) | FC |
| MYPR_RAT | Myelin proteolipid protein | Plp1 | 30 | 0.8299↑ |
| G3V6T0_RAT | Hedgehog protein | Shh | 48 | 0.6817↑ |
| C2D1A_RAT | Coiled-coil and C2 domain-containing protein 1A | Cc2d1a | 104 | 0.6298↓ |
| EF1A1_RAT | Elongation factor 1-alpha 1 | Eef1a1 | 50 | 0.5322↑ |
| CSPG2_RAT | Versican core protein | Vcan | 300 | 0.4502↑ |
| NFL_RAT | Neurofilament light polypeptide | Nefl | 61 | 0.4381↑ |
| NFM_RAT | Neurofilament medium polypeptide | Nefm | 96 | 0.3863↑ |
| A0A0G2K677_RAT | Spectrin beta chain | Sptbn4 | 289 | 0.3412↑ |
| A0A0G2K0S7_RAT | RAP1 GTPase-activating protein 2 | Rap1gap2 | 81 | 0.2788↓ |
| C, Synaptic plasticity | ||||
| Accession no. | Protein name | Gene name | MW(kDa) | FC |
| CAC1B_RAT | Voltage-dependent N-type calcium channel subunit alpha-1B | Cacna1b | 262 | 0.7177↓ |
| IF4A3_RAT | Eukaryotic initiation factor 4A-III | Eif4a3 | 47 | 0.5039↑ |
| Q9WUW2_RAT | Vesicle associated membrane protein 2B | Vamp2 | 15 | 0.4841↓ |
| PPT1_RAT | Palmitoyl-protein thioesterase 1 | Ppt1 | 34 | 0.4382↑ |
| DLG4_RAT | Disks large homolog 4 | Dlg4 | 80 | 0.2774↓ |
| STX1A_RAT | Syntaxin-1A | Stx1a | 33 | 0.2740↓ |
| D, Nerve development and apoptosis | ||||
| Accession no. | Protein name | Gene name | MW(kDa) | FC |
| CMGA_RAT | Chromogranin-A | Chga | 52 | 0.9774↓ |
| PA1B2_RAT | Platelet-activating factor acetylhydrolase IB subunit beta | Pafah1b2 | 26 | 0.6040↓ |
| CN37_RAT | 2′,3′-cyclic-nucleotide 3′-phosphodiesterase | Cnp | 47 | 0.5092↑ |
| PEBP1_RAT | Phosphatidylethanolamine-binding protein 1 | Pebp1 | 21 | 0.4709↑ |
| AT2B2_RAT | Plasma membrane calcium-transporting ATPase 2 | Atp2b2 | 137 | 0.4124↓ |
| PARK7_RAT | Protein/nucleic acid deglycase DJ-1 | Park7 | 20 | 0.3574↑ |
| PPP5_RAT | Serine/threonine-protein phosphatase 5 | Ppp5c | 57 | 0.3466↑ |
| MOG_RAT | Myelin-oligodendrocyte glycoprotein | Mog | 28 | 0.2948↑ |
| SRR_RAT | Serine racemase | Srr | 36 | 0.2822↑ |
| B2RZA9_RAT | Ube2l3 protein | Ube2l3 | 18 | 0.2631↑ |
| E, Neurotransmission | ||||
| Accession no. | Protein name | Gene name | MW(kDa) | FC |
| SC6A9_RAT | Sodium- and chloride-dependent glycine transporter 1 | Slc6a9 | 71 | 0.7901↑ |
The FCs represent the ratios of the absolute intensities of proteins in the RWIS 4 h and control groups. ↑, upregulated; ↓, downregulated; MW, theoretical molecular weight; FC, fold change; RWIS, restraint water-immersion stress.
WB validation
According to the GO and IPA network analyses, NDRG1 and PSD95 were upregulated 1.29-fold and downregulated 0.28-fold, respectively. SYN is involved in the physiological processes of synaptic vesicle introduction, transport and release of neurotransmitters (39–41), synaptic vesicle recirculation (42,43) and synaptogenesis and stability (44). To verify the results of the proteomic experiment, SYN, NDRG1 and PSD95 were semi-quantified by WB at the protein level (Table SII). With GAPDH or β-actin used as a protein loading quantification control, the expression level of PSD95 was significantly decreased in the RWIS 4 h group compared with in the control group (P<0.05), which was consistent with the iTRAQ analysis results. The expression level of SYN (0.368±0.022 vs. 0.414±0.04) was decreased and that of NDRG1 (0.024±0.005 vs. 0.012±0.003) was increased in rats exposed to the RWIS for 4 h compared with rats in the control group, but the differences between the groups were not significant (Fig. 9).
Figure 9.
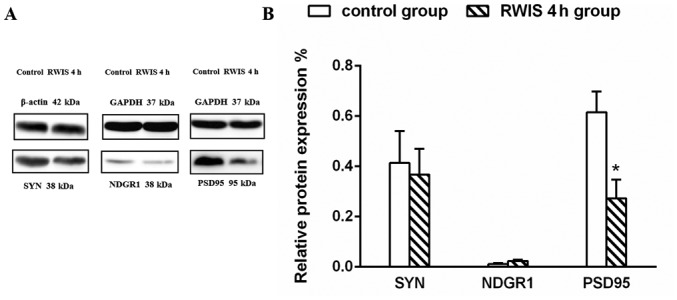
Verification of SYN, NDRG1 and PSD95 expression by WB. (A) Protein expression levels of SYN, NDRG1 and PSD95 in the control and RWIS 4 h groups; (B) statistical analysis of WB between the control and RWIS 4 h groups. *P<0.05. NDRG1, N-myc downstream regulated 1; PSD95, postsynaptic density protein 95; RWIS, restraint water-immersion stress; WB, western blotting.
Discussion
Previous studies have focused on identifying the peripheral and primary central regulatory mechanisms of gastrointestinal dysfunction induced by RWIS (3–15,45). However, little is known regarding the roles of the highest-level central region, the cerebral cortex. To the best of our knowledge, the present study was the first to report on the role of the mPFC on gastric function in the RWIS state, and the molecular differences in the mPFC at the proteome level between a control and RWIS 4 h group, providing a basis to further understand the molecular mechanisms and pathogenesis of SGML.
To demonstrate that the mPFC regulated gastric function under the RWIS state in awake rats, the present study compared the possible differential effects of sham or bilateral mPFC lesions on gastric mucosa injury induced by RWIS by measuring the EI. Compared with the RWIS 4 h group and the sham-control group, the bilateral-lesioned group exhibited a significantly smaller EI, indicating that lesions of the mPFC could protect against gastric mucosa injury induced by RWIS. In other words, the mPFC exacerbated gastric mucosal injury in awake rats during RWIS, which was consistent with previous reports (19).
To further explore the role of the mPFC in modulating gastric function, the present study compared the motility index (reflecting the changes of contracting energy of rat stomach) and contraction fraction (reflecting the duration under contracting state of rat stomach) in awake RWIS rats. In the sham-operated group, there was significant hyperactivity during stress exposure compared with that before stress, exhibited by the high GM index and contraction fraction, and this change had obvious time-dependent characteristics. However, in the bilateral-lesioned group, RWIS induced significant hypoactivity of GM compared with before stress, exhibited by the low GM index and contraction fraction. The results demonstrated the important role of mPFC in modulating the gastric function (Fig. 5). Furthermore, the mPFC is the only area of the cortex that projects directly to the hypothalamus and has a wide range of fiber connections to regions associated with autonomic visceral activity, including the nucleus of the solitary tract, dorsal motor nucleus of the vagus and nucleus ambiguous (16,46,47). Previous studies suggest that, as the most advanced center for regulating gastrointestinal activity, the mPFC can directly project to the brainstem and act directly on the gastrointestinal center of the medulla oblongata to quickly regulate gastrointestinal activity (16,18,48). It was hypothesized that RWIS alters the activity of the mPFC, which may activate the peripheral parasympathetic nervous system pathway, and eventually leads to gastric dysfunction and even gastric mucosal damage.
In addition, the gastric contraction amplitude in bilateral-damaged rats was significantly decreased compared with that before stress, especially at the 2nd hour of stress. At the same time, the GM index in the bilateral-lesioned group was significantly decreased compared with the sham-operated group (Fig. 5E), indicating that GM was largely inhibited during RWIS due to the absence of the mPFC. Therefore, the aforementioned results suggested that RWIS altered the activity state of the mPFC, which in turn weakened the inhibitory effect of the mPFC on GM, leading to gastric hyperactivity. The results of the present study were in line with those of previous reports (49,50).
To provide further insights into the molecular mechanisms of the mPFC in the development of SGML induced by RWIS, and to ultimately identify medications that can cure this disease, the present study first reported the molecular differences in the mPFC at the proteome level between the control and RWIS 4 h groups.
A total of 129 differentially expressed proteins were identified; 88 proteins were upregulated, while 41 proteins were downregulated in the samples from the RWIS 4 h group compared with those from the control group. The alterations in the expression levels of PSD95 and SYN, markers in the presynaptic terminal that reflect alterations in synaptic plasticity, were confirmed by WB, and the results were fully consistent with the iTRAQ findings. Compared with the control group, the RWIS 4 h group exhibited a higher concentration of NDRG1 in the mPFC, but the difference was not significant, which was potentially due to its low expression in the brain.
Bioinformatics analysis of these differentially expressed proteins demonstrated that most of the differentially expressed proteins were closely associated with the nervous system. GO annotation analysis demonstrated that these differentially expressed proteins were mainly involved in multicellular organism development, neurofilament bundle assembly and axon regeneration (Fig. 7). A total of 29 dysregulated proteins, including PSD95, were directly associated with axon morphology, axon growth, synaptic plasticity and other nervous system functions. As a scaffold protein, PSD95 interacts with receptors, kinases, structural proteins and signaling molecules. PSD95 is required for the activity and stability of the receptor on the postsynaptic membrane, and it serves an important role in synaptic development and plasticity (35,47,51,52). The consistent results of WB and iTRAQ indicated that the protein PSD95 may be associated with the central mechanism of gastrointestinal dysfunction induced by RWIS, but the underlying molecular mechanisms need to be investigated further.
IPA network analysis showed that the dysregulated proteins in the RWIS group were mainly involved in the regulation of the NF-κB and ERK1/2 signaling pathways. Neuronal NF-κB is localized in synaptic and somatic compartments, and is a potent transcription factor with evolutionarily conserved functions in learning and the growth of excitatory synaptic contacts (44). The occurrence of a gastric ulcer is speculated to be due to NDRG1, which affects the NF-κB signaling pathway by reducing its regulation of the stomach and affecting signal transduction. The ERK signaling pathway, the main downstream target of the NMDA receptor (53), serves a key role in synaptic plasticity, long-term enhancement, learning and memory, and other neural functions (54). A previous study revealed that astrocytes and neurons in the locus coeruleus mediate RWIS-induced gastric mucosal damage via the ERK1/2 signaling pathway (7). Since there are numerous factors regulating the ERK signaling pathway, further experimental studies are required.
In conclusion, the present study provided insights into the role of the mPFC in awake rats and the differential protein expression in the mPFC of rats with gastric muscosal lesions. Therefore, the present study provided a resource for determining the molecular regulatory mechanisms of gastric ulcers. PSD95 is associated with synaptic plasticity, and the mechanism of gastric ulcers is likely to be associated with synaptic plasticity; however, the specific mechanisms merit further exploration and elaboration.
Supplementary Material
Acknowledgements
The Go and IPA analysis were supported by Jiyun Biotech.
Funding
This work was supported by grants from the National Science Foundation of China (grant no. 31501861) and the Natural Science Foundation of Shandong Province, China (grant no. ZR2015CM013).
Availability of data and materials
The datasets used and/or analyzed during the current study are available from the corresponding author on reasonable request.
Authors' contributions
DQZ and JPZ designed the experiments, and YJM and SNG performed the experiments. DQZ performed mass spectrometry analysis and wrote the manuscript. YJM analyzed the western blotting data. JPZ consulted on the experiments and proofread the manuscript. All persons designated as authors qualify for authorship, and all the authors have approved the final version of the manuscript for publication.
Ethics approval and consent to participate
All surgeries and postoperative care procedures were conducted in accordance with the National Institutes of Health Guidelines for the Care and Use of Laboratory Animals and were approved by the Institutional Animal Care and Use Committee at Shandong Normal University (approval no. AEECSDNU2018003).
Patient consent for publication
Not applicable.
Competing interests
The authors declare that they have no competing interests.
References
- 1.Saxena B, Singh S. Comparison of three acute stress models for simulating the pathophysiology of stress-related mucosal disease. Drug Discov Ther. 2017;11:98–103. doi: 10.5582/ddt.2016.01081. [DOI] [PubMed] [Google Scholar]
- 2.Jaggi AS, Bhatia N, Kumar N, Singh N, Anand P, Dhawan R. A review on animal models for screening potential anti-stress agents. Neurol Sci. 2011;32:993–1005. doi: 10.1007/s10072-011-0770-6. [DOI] [PubMed] [Google Scholar]
- 3.Huang P, Zhou Z, Wang H, Wei Q, Zhang L, Zhou X, Hutz RJ, Shi F. Effect of the IGF-1/PTEN/Akt/FoxO signaling pathway on the development and healing of water immersion and restraint stress-induced gastric ulcers in rats. Int J Mol Med. 2012;30:650–658. doi: 10.3892/ijmm.2012.1041. [DOI] [PubMed] [Google Scholar]
- 4.Huang P, Zhou ZR, Zheng MQ, Shi FX. Effect of the IGF-1/PTEN/Akt/FoxO signalling pathway in the duodenal mucosa of rats subjected to water immersion and restraint stress. Genet Mol Res. 2012;11:4775–4788. doi: 10.4238/2012.September.19.2. [DOI] [PubMed] [Google Scholar]
- 5.Ohta Y, Yashiro K, Ohashi K, Kusumoto C, Matsura T, Hidaka M, Fukuzawa K. Vitamin E depletion enhances liver oxidative damage in rats with water-immersion restraint stress. J Nutr Sci Vitaminol (Tokyo) 2013;59:79–86. doi: 10.3177/jnsv.59.79. [DOI] [PubMed] [Google Scholar]
- 6.Zhou ZR, Huang P, Song GH, Zhang Z, An K, Lu HW, Ju XL, Ding W. Comparative proteomic analysis of rats subjected to water immersion and restraint stress as an insight into gastric ulcers. Mol Med Rep. 2017;16:5425–5433. doi: 10.3892/mmr.2017.7241. [DOI] [PMC free article] [PubMed] [Google Scholar]
- 7.Fan F, Li L, Liu W, Yang M, Ma X, Sun H. Astrocytes and neurons in locus coeruleus mediate restraint water immersionstress-induced gastric mucosal damage through the ERK1/2 signaling pathway. Neurosci Lett. 2018;675:95–102. doi: 10.1016/j.neulet.2018.03.054. [DOI] [PubMed] [Google Scholar]
- 8.Xu Y, Jia J, Xie C, Wu Y, Tu W. Transient receptor potential ankyrin 1 and substance P mediate the development of gastric mucosal lesions in a water immersion restraint stress rat model. Digestion. 2018;97:228–239. doi: 10.1159/000484980. [DOI] [PubMed] [Google Scholar]
- 9.Zhang YY, Cao GH, Zhu WX, Cui XY, Ai HB. Comparative study of c-Fos expression in the rat dorsal vagal complex and nucleus ambiguus induced by different durations of restraint water-immersion stress. Chin J Physiol. 2009;52:143–150. doi: 10.4077/CJP.2009.AMH045. [DOI] [PubMed] [Google Scholar]
- 10.Zhang YY, Zhu WX, Cao GH, Cui XY, Ai HB. c-Fos expression in the supraoptic nucleus is the most intense during different durations of restraint water-immersion stress in the rat. J Physiol Sci. 2009;59:367–375. doi: 10.1007/s12576-009-0044-8. [DOI] [PMC free article] [PubMed] [Google Scholar]
- 11.Zhao DQ, Lu CL, Ai HB. The role of catecholaminergic neurons in the hypothalamus and medullary visceral zone in response to restraint water-immersion stress in rats. J Physiol Sci. 2011;61:37–45. doi: 10.1007/s12576-010-0119-6. [DOI] [PMC free article] [PubMed] [Google Scholar]
- 12.Zhao DQ, Ai HB. Oxytocin and vasopressin involved in restraint water-immersion stress mediated by oxytocin receptor and vasopressin 1b receptor in rat brain. PLoS One. 2011;6:e23362. doi: 10.1371/journal.pone.0023362. [DOI] [PMC free article] [PubMed] [Google Scholar]
- 13.Sun H, Liu Z, Ma X. Interactions between astrocytes and neurons in the brainstem involved in restraintwater immersion stress-induced gastric mucosal damage. Neuroreport. 2016;27:151–159. doi: 10.1097/WNR.0000000000000515. [DOI] [PubMed] [Google Scholar]
- 14.Sun H, Li R, Xu S, Liu Z, Ma X. Hypothalamic astrocytes respond to gastric mucosal damage induced by restraint water-immersion stress in rat. Front Behav Neurosci. 2016;10:210. doi: 10.3389/fnbeh.2016.00210. [DOI] [PMC free article] [PubMed] [Google Scholar]
- 15.Sun H, Zhao P, Liu W, Li L, Ai H, Ma X. Ventromedial hypothalamic nucleus in regulation of stress-induced gastric mucosal injury in rats. Sci Rep. 2018;8:10170. doi: 10.1038/s41598-018-28456-0. [DOI] [PMC free article] [PubMed] [Google Scholar]
- 16.Vertes RP. Interactions among the medial prefrontal cortex, hippocampus and midline thalamus in emotional and cognitive processing in the rat. Neuroscience. 2006;142:1–20. doi: 10.1016/j.neuroscience.2006.06.027. [DOI] [PubMed] [Google Scholar]
- 17.Neafsey EJ. Prefrontal cortical control of the autonomic nervous system: Anatomical and physiological observations. Prog Brain Res. 1990;85:147–166. doi: 10.1016/S0079-6123(08)62679-5. [DOI] [PubMed] [Google Scholar]
- 18.Hurley-Gius KM, Neafsey EJ. The medial frontal cortex and gastric motility: Microstimulation results and their possible significance for the overall pattern of organization of rat frontal and parietal cortex. Brain Res. 1986;365:241–248. doi: 10.1016/0006-8993(86)91635-5. [DOI] [PubMed] [Google Scholar]
- 19.Sullivan RM, Gratton A. Lateralized effects of medial prefrontal cortex lesions on neuroendocrine and autonomic stress responses in rats. J Neurosci. 1999;19:2834–2840. doi: 10.1523/JNEUROSCI.19-07-02834.1999. [DOI] [PMC free article] [PubMed] [Google Scholar]
- 20.Ostrander MM, Richtand NM, Herman JP. Stress and amphetamine induce Fos expression in medial prefrontal cortex neurons containing glucocorticoid receptors. Brain Res. 2003;990:209–214. doi: 10.1016/j.brainres.2003.07.001. [DOI] [PubMed] [Google Scholar]
- 21.Crane JW, Ebner K, Day TA. Medial prefrontal cortex suppression of the hypothalamic-pituitary-adrenal axis response to a physical stressor, systemic delivery of interleukin-1beta. Eur J Neurosci. 2003;17:1473–1481. doi: 10.1046/j.1460-9568.2003.02568.x. [DOI] [PubMed] [Google Scholar]
- 22.Morgan MA, Romanski LM, LeDoux JE. Extinction of emotional learning: Contribution of medial prefrontal cortex. Neurosci Lett. 1993;163:109–113. doi: 10.1016/0304-3940(93)90241-C. [DOI] [PubMed] [Google Scholar]
- 23.Frysztak RJ, Neafsey EJ. The effect of medial frontal cortex lesions on respiration, ‘freezing,’ and ultrasonic vocalizations during conditioned emotional responses in rats. Cereb Cortex. 1991;1:418–425. doi: 10.1093/cercor/1.5.418. [DOI] [PubMed] [Google Scholar]
- 24.Frysztak RJ, Neafsey EJ. The effect of medial frontal cortex lesions on cardiovascular conditioned emotional responses in the rat. Brain Res. 1994;643:181–193. doi: 10.1016/0006-8993(94)90024-8. [DOI] [PubMed] [Google Scholar]
- 25.Ross PL, Huang YN, Marchese JN, Williamson B, Parker K, Hattan S, Khainovski N, Pillai S, Dey S, Daniels S, et al. Multiplexed protein quantitation in Saccharomyces cerevisiae using amine-reactive isobaric tagging reagents. Mol Cell Proteomics. 2004;3:1154–1169. doi: 10.1074/mcp.M400129-MCP200. [DOI] [PubMed] [Google Scholar]
- 26.Liu T, Hu J, Li H. iTRAQ-based shotgun neuroproteomics. Methods Mol Biol. 2009;566:201–216. doi: 10.1007/978-1-59745-562-6_14. [DOI] [PMC free article] [PubMed] [Google Scholar]
- 27.Paxinos G, Watson C. Elsevier; Amsterdam: 2007. The Rat Brain in Stereotaxic Coordinates. 6th edition; pp. 8–13. [Google Scholar]
- 28.Kádár A, Wittmann G, Liposits Z, Fekete C. Improved method for combination of immunocytochemistry and Nissl staining. J Neurosci Methods. 2009;184:115–118. doi: 10.1016/j.jneumeth.2009.07.010. [DOI] [PMC free article] [PubMed] [Google Scholar]
- 29.Nesvizhskii AI, Keller A, Kolker E, Aebersold R. A statistical model for identifying proteins by tandem mass spectrometry. Anal. Chem. 2003;75:4646–4658. doi: 10.1021/ac0341261. [DOI] [PubMed] [Google Scholar]
- 30.Yang CL, Zhu HY, Zhang F. Comparative proteomics analysis between the short-term stress and long-term adaptation of the blattella germanica (Blattodea: Blattellidae) in response to beta-cypermethrin. J Econ Entomol. 2019;112:1396–1402. doi: 10.1093/jee/toz047. [DOI] [PubMed] [Google Scholar]
- 31.Guth PH, Aures D, Paulsen G. Topical aspirin plus HCl gastric lesions in the rat. Cytoprotective effect of prostaglandin, cimetidine, and probanthine. Gastroenterology. 1979;76:88–93. [PubMed] [Google Scholar]
- 32.Kokame K, Kato H, Miyata T. Homocysteine-respondent genes in vascular endothelial cells identified by differential display analysis. GRP78/BiP and novel genes. J Biol Chem. 1996;271:29659–29665. doi: 10.1074/jbc.271.47.29659. [DOI] [PubMed] [Google Scholar]
- 33.van Belzen N, Dinjens WN, Diesveld MP, Groen NA, van der Made AC, Nozawa Y, Vlietstra R, Trapman J, Bosman FT. A novel gene which is upregulated during colon epithelial cell differentiation and downregulated in colorectal neoplasms. Lab Investig. 1997;77:85–92. [PubMed] [Google Scholar]
- 34.Zhou D, Salnikow K, Costa M. Cap43, a novel gene specifically induced by Ni2+ compounds. Cancer Res. 1998;58:2182–2189. [PubMed] [Google Scholar]
- 35.Ellen TP, Ke Q, Zhang P, Costa M. NDRG1, a growth and cancer related gene: Regulation of gene expression and function in normal and disease states. Carcinogenesis. 2008;29:2–8. doi: 10.1093/carcin/bgm200. [DOI] [PubMed] [Google Scholar]
- 36.Xu W. PSD-95-like membrane associated guanylate kinases (PSD-MAGUKs) and synaptic plasticity. Curr Opin Neurobiol. 2011;21:306–312. doi: 10.1016/j.conb.2011.03.001. [DOI] [PMC free article] [PubMed] [Google Scholar]
- 37.Winkler D, Daher F, Wüstefeld L, Hammerschmidt K, Poggi G, Seelbach A, Krueger-Burg D, Vafadari B, Ronnenberg A, Liu Y, et al. Hypersocial behavior and biological redundancy in mice with reducedexpression of PSD95 or PSD93. Behav Brain Res. 2018;352:35–45. doi: 10.1016/j.bbr.2017.02.011. [DOI] [PubMed] [Google Scholar]
- 38.Chai J, Wang Y, Li H, He W, Zou W, Zhou Y, Hu X, Chai Q. Distribution of postsynaptic density protein 95 (PSD95) and synaptophysin during neuronal maturation. Xi Bao Yu Fen Zi Mian Yi Xue Za Zhi. 2016;32:1619–1622. (In Chinese) [PubMed] [Google Scholar]
- 39.Alder J, Lu B, Valtorta F, Greengard P, Poo M. Calcium-dependent transmitter secretion reconstituted in Xenopus oocytes: Requirement for synaptophysin. Science. 1992;257:657–661. doi: 10.1126/science.1353905. [DOI] [PubMed] [Google Scholar]
- 40.Edelmann L, Hanson PI, Chapman ER, Jahn R. Synaptobrevin binding to synaptophysin: A potential mechanism for controlling the exocytotic fusion machine. EMBO J. 1995;14:224–231. doi: 10.1002/j.1460-2075.1995.tb06995.x. [DOI] [PMC free article] [PubMed] [Google Scholar]
- 41.Valtorta F, Pennuto M, Bonanomi D, Benfenati F. Synaptophysin: Leading actor or walk-on role in synaptic vesicle exocytosis? Bioessays. 2004;26:445–453. doi: 10.1002/bies.20012. [DOI] [PubMed] [Google Scholar]
- 42.Daly C, Sugimori M, Moreira JE, Ziff EB, Llinas R. Synaptophysin regulates clathrin-independent endocytosis of synaptic vesicles. Proc Natl Acad Sci USA. 2000;97:6120–6125. doi: 10.1073/pnas.97.11.6120. [DOI] [PMC free article] [PubMed] [Google Scholar]
- 43.Thiele C, Hannah MJ, Fahrenholz F, Huttner WB. Cholesterol binds to synaptophysin and is required for biogenesis of synaptic vesicles. Nat Cell Biol. 2000;2:42–49. doi: 10.1038/71366. [DOI] [PubMed] [Google Scholar]
- 44.Tarsa L, Goda Y. Synaptophysin regulates activity-dependent synapse formation in cultured hippo-campal neurons. Proc Natl Acad Sci USA. 2002;99:1012–1016. doi: 10.1073/pnas.022575999. [DOI] [PMC free article] [PubMed] [Google Scholar]
- 45.Sun HZ, Zheng S, Lu K, Hou FT, Bi JX, Liu XL, Wang SS. Hydrogen sulfide attenuates gastric mucosal injury induced by restraint water-immersion stress via activation of KATP channel and NF-κB dependent pathway. World J Gastroenterol. 2017;23:87–92. doi: 10.3748/wjg.v23.i1.87. [DOI] [PMC free article] [PubMed] [Google Scholar]
- 46.Hurley KM, Herbert H, Moga MM, Saper CB. Efferent projections of the infralimbic cortex of the rat. J Comp Neurol. 1991;308:249–276. doi: 10.1002/cne.903080210. [DOI] [PubMed] [Google Scholar]
- 47.Vertes RP, Hoover WB, Do Valle AC, Sherman A, Rodriguez JJ. Efferent projections of reuniens and rhomboid nuclei of the thalamus in the rat. J Comp Neurol. 2006;499:768–796. doi: 10.1002/cne.21135. [DOI] [PubMed] [Google Scholar]
- 48.Vertes RP. Differential projections of the infralimbic and prelimbic cortex in the rat. Synapse. 2004;51:32–58. doi: 10.1002/syn.10279. [DOI] [PubMed] [Google Scholar]
- 49.Garrick T, Buack S, Bass P. Gastric motility is a major factor in cold restraint-induced lesion formation in rats. Am J Physiol. 1986;250:G191–G199. doi: 10.1152/ajpgi.1986.250.2.G191. [DOI] [PubMed] [Google Scholar]
- 50.Ai HB, Zhang ZD. Water-immersion stress hypercontractility gastric barrier mucus atropine phenoxybenzamine sodium pentobarbita. Sheng Li Xue Bao. 1990;42:496–502. (In Chinese) [PubMed] [Google Scholar]
- 51.Wang J, Yuan J, Pang J, Ma J, Han B, Geng Y, Shen L, Wang H, Ma Q, Wang Y, Wang M. Effects of chronic stress on cognition in male SAMP8 mice. Cell Physiol Biochem. 2016;39:1078–1086. doi: 10.1159/000447816. [DOI] [PubMed] [Google Scholar]
- 52.Coley AA, Gao WJ. PSD95: A synaptic protein implycated In schizophrenia or autism? Prog Neuropsychopharmacol Biol Psychiatry. 2018;82:187–194. doi: 10.1016/j.pnpbp.2017.11.016. [DOI] [PMC free article] [PubMed] [Google Scholar]
- 53.Zhu D, Wu X, Strauss KI, Lipsky RH, Qureshi Z, Terhakopian A, Novelli A, Banaudha K, Marini AM. N-methyl-D-aspartate and TrkB receptors protect neurons against glutamate excitotoxicity through an extracellular signalregulated kinase pathway. J Neurosci Res. 2005;80:104–113. doi: 10.1002/jnr.20422. [DOI] [PMC free article] [PubMed] [Google Scholar]
- 54.Wang JQ, Fibuch EE, Mao L. Regulation of mitogen-activated protein kinases by glutamate receptors. J Neurochem. 2007;100:1–11. doi: 10.1111/j.1471-4159.2006.04208.x. [DOI] [PubMed] [Google Scholar]
Associated Data
This section collects any data citations, data availability statements, or supplementary materials included in this article.
Supplementary Materials
Data Availability Statement
The datasets used and/or analyzed during the current study are available from the corresponding author on reasonable request.