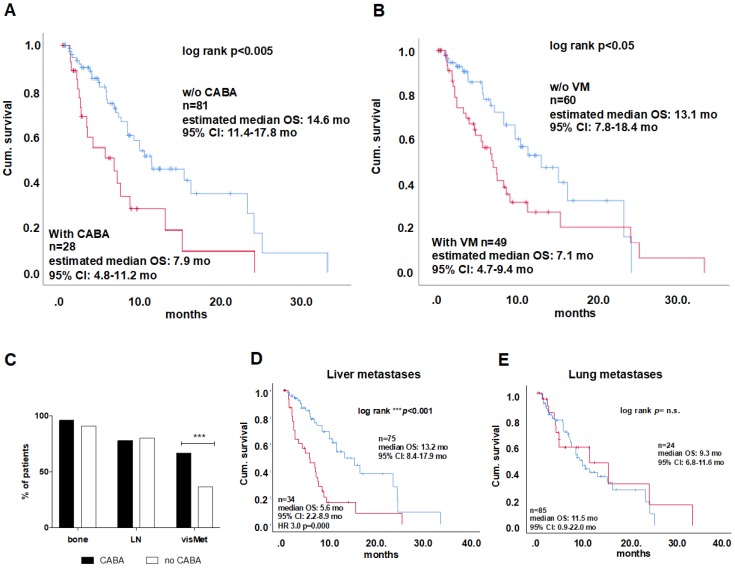
Figure 2.
A) Kaplan-Meier plots of overall survival of patients who had or had not received Cabazitaxel treatment. Comparison of cabazitaxel treated patients vs. untreated. Kaplan-Meier curves for visceral metastases is shown in (B)The distribution of metastases among CABA-treated patinets is shown in a stacked column graph in %, result of Chi2-test for the distribution of visceral metastases between CABA and no CABA is indicated with asterisks***p<0.001 (C) Kaplan-Meier plots are shown for OS between patints with or without liver (D) and lung (E) metastases including log rank test results. CABA = Cabazitaxel; OS=overall survival; CI=confidence interval; LN = lymph node, visMet = visceral metastases, VM=visceral metastases.

