

Emergence and global success of tuberculosis involve core pathogenesis functions under selection in epidemiological settings.
Abstract
Models on how bacterial lineages differentiate increase our understanding of early bacterial speciation events and the genetic loci involved. Here, we analyze the population genomics events leading to the emergence of the tuberculosis pathogen. The emergence is characterized by a combination of recombination events involving core pathogenesis functions and purifying selection on early diverging loci. We identify the phoR gene, the sensor kinase of a two-component system involved in virulence, as a key functional player subject to pervasive positive selection after the divergence of the Mycobacterium tuberculosis complex from its ancestor. Previous evidence showed that phoR mutations played a central role in the adaptation of the pathogen to different host species. Now, we show that phoR mutations have been under selection during the early spread of human tuberculosis, during later expansions, and in ongoing transmission events. Our results show that linking pathogen evolution across evolutionary and epidemiological time scales points to past and present virulence determinants.
INTRODUCTION
The increasing availability of population genomics data has allowed an improved understanding of genotypic and ecological differentiation among closely related bacteria. While a species concept sensu stricto cannot be applied to bacteria (1), models exist to understand how species can emerge in natural populations. Depending on the evolutionary forces involved, models range from differentiation driven by natural selection and adaptation to different ecological niches (ecological species concept) to differentiation as a result of restricted gene flow that reinforces isolation (biological species concept). In reality, most natural populations show a combination of both processes with certain overlap between habitats [overlapping habitat model (2)]. The study of natural populations and models shows that the emergence of new species is more common among bacterial groups sharing, partially or totally, their habitat, a process also known as sympatric speciation (3). Processes of bacterial differentiation are often expected to leave measurable genetic signatures in extant genomes including “speciation islands” (regions of high divergence between the nascent species) (2, 3). These genetic signatures hold clues about the key genomic determinants responsible for ecological differentiation of a nascent species from a common genetic pool. However, how these models apply to professional pathogens, particularly those characterized by an obligate association with their host species, has been little explored.
Species of the Mycobacterium tuberculosis complex (MTBC) cause devastating morbidity and mortality in humans and animals, which also lead to important economic losses (4). The MTBC comprises a group of bacteria with genome sequences having an average nucleotide identity greater than 99% and sharing a single clonal ancestor. This includes the predominantly human pathogens referred to as M. tuberculosis and Mycobacterium africanum as well as a series of pathogens isolated from other mammalian species such as Mycobacterium bovis, Mycobacterium pinnipedii, Mycobacterium orygis, Mycobacterium microti, etc. Human-adapted tuberculosis bacilli show a strong geographic association, with some lineages being globally distributed (e.g., lineage 4) and others being geographically restricted (e.g., lineage 5, 6, and 7) (5, 6). It is assumed that the causes of this variable geographical distribution are both historical (e.g., trade, conquest, and globalization) and biological (e.g., interactions with different human genetic backgrounds) (6). There is limited transmissibility of animal-adapted strains in humans, and, conversely, human-adapted strains transmit poorly among animals. Despite the wide range of host species infected by the different members of the MTBC, there is a maximum of ~2500 single-nucleotide polymorphisms (SNPs) separating any two MTBC genomes (5). The most closely related bacteria that fall outside of the MTBC include isolates known as Mycobacterium canettii (MCAN). MCAN strains differ from MTBC isolates by tens of thousands of SNPs, most of them contributed by recombination between strains (7). MCAN strains have been isolated from the Horn of Africa, predominantly from children and often in association with extrapulmonary tuberculosis (8). Genomic comparisons have identified gene content differences between MTBC, MCAN, and other mycobacteria (7, 9), as well as genetic differences in virulence-related loci (10). Thus, it is assumed that MCAN represents an opportunistic pathogen with an unidentified environmental reservoir (11) opposed to the obligate MTBC pathogen.
Two pieces of evidence suggest that MTBC and MCAN evolved from a common genetic pool in Africa. Strains of the MTBC have an average nucleotide identity to MCAN strains of 98% (range, 97.71 to 99.30%) (7) (our own data), suggesting incomplete or recent speciation (an operational species concept identifies 95% as the barrier to delineate species). In addition, most reports suggest lack of ongoing recombination between MCAN and MTBC and within the MTBC (5, 12), suggesting complete separation, although this fact was refuted by other authors (13). The second piece of evidence comes from phylogeographic and genetic diversity analyses that identified the origin of the tuberculosis bacilli in Africa (5, 14), the likely place of origin of MCAN (7, 15). Together, the data suggest that ancestral MTBC and MCAN strains at least partially shared the same niche and genetic pool.
Our understanding about the population genomics events mediating the divergence of the ancestor of the MTBC from a common ancestral pool with MCAN is far from complete. We have taken advantage of the availability of genome sequences from thousands of MTBC clinical strains as well as of close relatives like MCAN to identify previously unknown genomic determinants in the emergence and later spread of the MTBC.
RESULTS
We first analyzed the differentiation between MTBC and MCAN by searching for any hallmark of ongoing recombination between and within these groups of strains. Previous reports have suggested that there might be limited but significant measurable recombination among MTBC strains (13), while others failed to identify measurable recombination events (12). To revisit this question, we reasoned that including larger available datasets may maximize the recombination signal if it exists. We screened a published dataset of complete genome sequences of strains from global sources (n = 1591) (16). These genomes are representative of the known geographic and genetic diversity of the human-adapted MTBC. Among those genomes, we identified all the variant positions and, more specifically, potential homoplastic sites, i.e., polymorphic sites showing signs of convergent evolution. A total of 96,143 variant positions were called in all the 1591 strains. Homoplasy can arise as a consequence of recombination, but it may be caused by other processes, such as positive selection, sequence gaps contributing to homoplastic counts, or mapping/calling errors. For example, known drug-resistance positions used to accumulate lots of homoplasies, as they are well-known instances of convergent evolution and multiple amino acid substitutions in the same codon (17, 18). Thus, to increase the likelihood of homoplastic positions being due to recombination events, we filtered out known drug-resistance positions (n = 48), nonbiallelic positions (n = 1076), and potential mapping errors identified by generating synthetic reads around each SNP position (n = 239). In total, we excluded, as likely arising from other signals, 1363 positions of the initial 96,143 positions (1.42%).
As a result, a total of 2360 core homoplastic sites were identified across the 1591 strains analyzed (1.368% of all variable sites). Homoplastic sites did not accumulate substantially in any region of the genome, thus suggesting the absence of recombination hotspots (Fig. 1A). To get a more detailed view and detect small recombination events, we looked for regions having two or more consecutive homoplastic variants (allowing one nonhomoplastic variant between them) co-occurring in the same phylogenetically unrelated strains. We detected only two cases in which two variant positions were homoplastic, consecutive and shared phylogenetic congruence (found in the same unrelated strains). The two regions accounted for four convergent variants (table S1) and affected strains from different MTBC lineages. Variants in positions 2,195,896 and 2,195,899 fell in the primary regulatory region of mazE5. Variants in positions 2,641,161 and 2,641,163 fell in the intergenic region of glyS and Rv2358. Although we cannot completely discard the possibility that these represent recombination events, it is more likely that the two regions have been under positive selection, a mechanism known to lead to the accumulation of homoplastic accumulation in the MTBC (18). In summary, this large-scale variant-by-variant analysis was not able to identify significant measurable ongoing recombination between any of the 1591 human-adapted MTBC strains analyzed.
Fig. 1. No ongoing recombination within the MTBC.
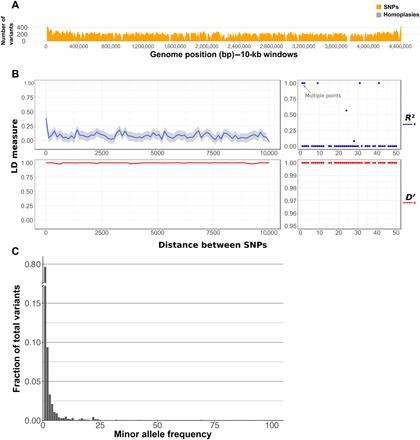
(A) Number of homoplasies (gray) as a function of the total number of variants detected (orange) in the MTBC dataset (n = 1591). (B) Linkage disequilibrium (LD) as a function of genetic distance detected in a representative sample of MTBC strains (n = 1591). (C) Site frequency spectrum of MTBC strains using the core variant positions. bp, base pair.
Because of the low diversity within the MTBC, we also followed alternative approaches to try to identify recombination events with a high statistical confidence. Using an additional method, we evaluated linkage disequilibrium (LD) as a function of the distance between the 94,780 core variant positions. R2 has been used in a previous publication to show ongoing recombination at very short distances [less than 50 base pairs (bp)] (13). In our much larger dataset, R2 values were also slightly higher at shorter distances, which is compatible with recombination involving short fragment sizes. However, a close examination reveals that the peak at short distances is misleading, as it is driven by only six points out of more than 11,000 comparisons (Fig. 1B). In addition, R2 values are known to fail to reach the theoretical maximum of 1 when variants compared have very different frequencies (19). This is likely the case for MTBC, in which there is a strong skew of the site frequency spectra toward low frequency values (Fig. 1C). Thus, as an alternative, we calculated D′. In this dataset, as expected for a mostly clonal organism, LD measured by D′ remained at its maximum value, even when focusing on distant variant positions more than 5 kb apart, suggesting very little or no ongoing recombination (Fig. 1B).
To further validate these findings, we ran Gubbins with the same dataset and validated them with RDP4 (see Materials and Methods for details). Gubbins detects the accumulation of a higher than expected number of variants in addition to homoplastic sites as a hallmark of possible recombination. We partitioned the 1591-strain dataset into the different lineages and screened for possible tracks of recombination. Gubbins reported potential recombining regions characterized by a higher than average number of SNPs; however, the RDP4 methods did not confirm any of them. Thus, those events may be real but cannot be confirmed by alternative approaches.
Having established that recombination has little impact on the overall MTBC genetic diversity, we compared a representative dataset of MTBC genomes (5) (n = 219) with seven MCAN genomes to identify and quantify eventual ongoing recombination within MCAN and between MCAN and extant MTBC strains. Of the 93,922 polymorphic sites identified, 22,718 were biallelic homoplasies (24.2%). The genomic distribution of variant positions and homoplasies in the MCAN group show a landscape different to that of the MTBC group (Fig. 2B). A total of 22,464 (98.9%) of those homoplasies were found only among MCAN strains, representing almost half of the variability within this group (22,464 of 52,392 biallelic sites; 42.9%), which points to recombination as a main source of variability in MCAN. This is consistent with previous reports (7). This profile is in sharp contrast with the flat homoplastic profile for the MTBC described above (Fig. 1A).
Fig. 2. Genome-wide variant profiles vary between MCAN, M. tuberculosis, and the MTBC ancestor.
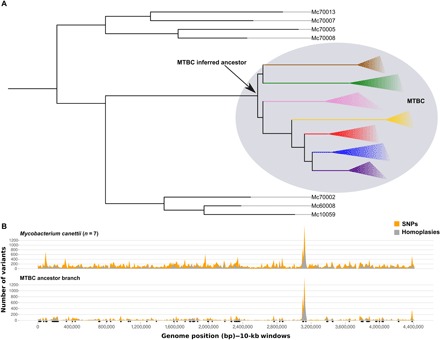
(A) Schematic view of the phylogenetic relationships between the MCAN groups and the MTBC. In fig. S1, a maximum likelihood phylogeny of the MCAN group including the MTBC ancestor can be found. (B) Number of homoplasies (gray) as a function of the total number of variants detected (orange) in the MCAN dataset and in the branch leading to the most recent common ancestor (tMRCA) of MTBC. Black dots indicate recombination events detected in the branch leading to the most recent common ancestor (tMRCA) of the MTBC.
To test for ongoing recombination between MCAN and extant MTBC, we identified homoplasies involving both groups. From the 93,922 total variants, 7934 involved MCAN and MTBC strains. We found 234 biallelic homoplasies involving extant MTBC and MCAN strains, thus compatible not only with ongoing recombination but also with independent diversification. The vast majority of homoplasies detected (97%) mapped to the branch leading to the MTBC clade (thus fixed within the MTBC but variable within the MCAN group). These results indicate that measurable recombination events were common between MCAN and the ancestral branch of the MTBC but are unlikely during subsequent diversification of the MTBC even when the sample size is greater than previous reports.
Sympatric and stepwise emergence of the MTBC ancestor
Our results show that recombination with closely related mycobacteria occurred during the emergence of the common ancestor of the MTBC. To gain a better insight into how it occurred, we reasoned that instead of comparing MCAN strains against extant MTBC strains, we should compare against a reconstructed most common ancestor of the MTBC [derived in Comas et al. (20)]. This strategy allowed us to focus on those changes specifically happening in the ancestral branch of the MTBC (see Fig. 2A and fig. S1). As described by others, the phylogeny suggests that a specific clone of the MCAN group diverged and resulted in the MTBC (15, 21). To do so, we extracted all the variant positions that were homoplastic between the MTBC ancestor and any of the MCAN strains, that is, equal nucleotide changes occurring in the same genomic positions that appeared independently in the branch leading to the MTBC ancestor and in any other branch of the phylogeny (7700 positions). The homoplastic SNPs mapping to the branch leading to the MTBC ancestor genome showed a homoplasy profile similar to that of the MCAN strains (Fig. 2B), suggesting that there were no hard barriers to gene flow between ancestral MTBC and MCAN ancestral strains, thus supporting a model of sympatric speciation. Notably, both MCAN and the MTBC ancestor shared a peak around the CRISPR region, highlighting the dynamic nature of this region possibly as a result of common phage infections.
A Gubbins analysis including MCAN genomes and the most likely common ancestor of the MTBC revealed a total of 65 recombination events mapping to the branch leading to the MTBC (table S2). Mapping of variants into the phylogeny revealed that those regions were coincident with a high number of homoplastic variants between MCAN and the MTBC. To explore whether these fragments reflected real recombination, we constructed a phylogeny for each of them. A comparison with the topology of the nonrecombinant alignment (whole-genome alignment subtracting the recombinant regions) using those recombinant regions with enough phylogenetic signal revealed significant incongruence (P < 0.05, Shimodaira-Hasegawa test; fig. S2 and Supplementary Text). Thus, both Gubbins and phylogenetic approaches indicated that these 65 regions are likely recombinant regions.
Dating of the potential recombinant regions using BEAST, and the results showed that their inferred ages of these regions differ from the time since the most recent common ancestor (tMRCA) of the MTBC (see fig. S3 and Materials and Methods for details). Although the distribution of tMRCA for the fragments represents a continuum, the analysis suggests a separation between “recent” recombination events and “ancient” events closer to the time of divergence from the MCAN group (Fig. 3A). The large highest posterior density intervals preclude any firm conclusion, but the results suggest that some regions in the MTBC ancestral genome were restricted to gene flow before others (fig. S3).
Fig. 3. Past recombination between MCAN strains and the MTBC ancestor.
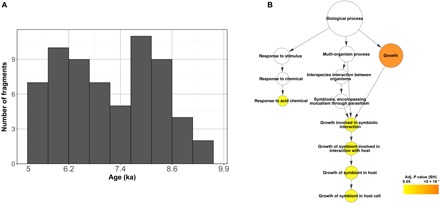
(A) Histogram distribution of the recombination fragment ages using the 5-ka (thousand year) scenario (54). A more detailed view can be found in fig. S3, with the confidence intervals plotted. (B) Gene Ontology terms overrepresented in the coding regions contained in the recombinant fragments. Adj., adjusted; BH, Benjamini-Hochberg.
If recombination played a major role in shaping the MTBC ancestral genome with regard to pathogenesis, then we would expect some functions related to the interaction with the host to be affected. We observed an enrichment in experimentally confirmed essential genes in the regions involved in recombination events, suggesting that recombination targeted important cell functions (P < 0.01, chi-square test). An enrichment analysis of Gene Ontology terms for the genes contained in these regions identified functions related to growth and, most specifically, to the category “growth involved in symbiotic interactions inside a host cell” as significantly overrepresented (adjusted P < 0.05, binomial test) (Fig. 3B). This category can be interpreted as genes involved in a strong association between the pathogen and the host. Most of the genes involved have been implicated in virulence using animal models of infection (see Discussion).
The recombination profile shown in Fig. 2 suggests that the MTBC ancestor recombined with MCAN ancestral strains and, thus, they shared a common niche. A sympatric model of speciation predicts that some parts of the genome will be involved in adaptation to a new niche (3). The hallmark trace would be the accumulation of variants differentiating the emerging species, at the genome-wide level or in a few loci, as a consequence of reduced recombination between both groups. We identified all the variant positions that appear in the ancestral branch of the MTBC but remain unchanged in all the MCAN strains, the so-called divergent variants (divSNPs). These divSNPs are new alleles unique to the MTBC ancestor and not present in any of the MCAN strains. The distribution of divSNPs per gene revealed that only few of the genes accumulated divSNPs in the branch leading to the ancestor, while most genes did not (Fig. 4A). This pattern is compatible with population differentiation models in which niche overlap between emerging species is high (2). The genome-wide landscape of divergent variants (n = 5688; Fig. 4B) revealed that a total of 120 genes harbored more divergent variants than expected by chance (see Materials and Methods) (Fig. 4B).
Fig. 4. Divergent positions between the MTBC ancestor and the MCAN clade.
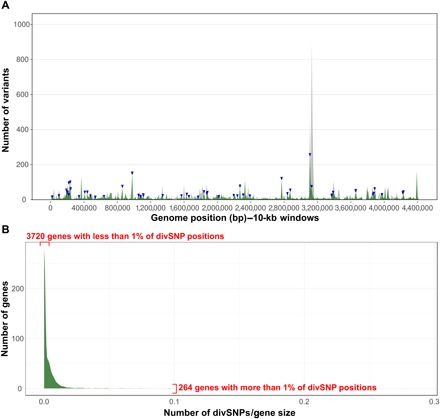
(A) Average of divSNPs per 10-kb positions (green) as compared to the average of homoplastic variants (gray). The blue arrowheads above the distribution indicate genes that significantly accumulate more divSNPs. (B) Accumulation of divSNPs per gene, corrected by gene length. A small number of genes accumulate a high amount of divSNPs, while most of the genes have a low number of variants or even none. This pattern resembles those of high habitat overlap derived from overlapping habitat models (2).
However, bacterial genomes are highly dynamic, and different processes can contribute to the genetic makeup of extant species. Consequently, not all the detected regions necessarily result from pure divergence by accumulation of substitutions. A detailed comparative genomics and phylogenetic analysis using available genome databases of bacteria identified several genes in which divSNPs were introduced by horizontal gene transfer (n = 17) or by recombination to a MCAN not present in our dataset (n = 49) and one with uncertain phylogenetic origin (see Supplementary Text and table S3 for detailed results). Thus, a total of 53 genes in the MTBC ancestral genome were highly divergent with respect to MCAN because of substitution events. While the genome-wide analysis identified divSNPs that might result from genetic drift or hitchhiking events associated with selection on other loci, their accumulation in only 53 genes suggests that those regions might have played an important role during the process of niche differentiation. In agreement, those 53 genes are significantly more conserved than the rest of the genome (dN/dS = 0.154 versus genome average dN/dS = 0.279; chi-squared P ≤ 0.001). This result suggests that despite the increased divergence from the MCAN strains, those 53 regions have been evolving under purifying selection. Alternatively, the accumulation of divergent variants could also represent hotspot regions for mutation. None of the genes showed a similar pattern of mutation accumulation in other MCAN strains (no overlap between the divSNP probability distributions for these 53 genes and the rest of the genomes; P < 0.05, t test).
Regions under positive selection after the transition to obligate pathogen
Having established that some divSNPs accumulate in genes under purifying selection, we screened for positive selection patterns to identify additional genes relevant in the transition from a newly emerged pathogen to a globally established pathogen. We first revisited the evolution of antigenic proteins. Those regions are recognized by the immune system, and most of them are hyperconserved within the MTBC (20). In agreement with previous data from MCAN genomic analyses (7), the dN/dS calculated in the branch leading to the ancestor showed a very similar pattern, with essential genes being more conserved than nonessential ones and T cell epitopes being hyperconserved. Only nine divSNPs (five synonymous and four nonsynonymous) were found in T cell epitope regions, which is significantly less than expected by chance (P < 0.001, Poisson distribution).
Thus, antigenic regions do not show an altered pattern or intensity of selective pressure. We then explored what other regions of the genome changed significantly in selective pressure by comparing the MTBC ancestor dN/dS and the actual dN/dS in extant populations using our global reference dataset of 4595 MTBC strains. We calculated a dN/dS for all the genes with at least one synonymous and one nonsynonymous mutation for each of the two sets (divSNPs versus within MTBC SNPs). Because of the low number of divSNPs in individual genes, only 499 genes were evaluated. Consequently, although additional genes to those shown in the ensuing analyses may have changed the selection pattern or intensity, they cannot be evaluated properly (table S4). We were particularly interested in those genes with a drastic change from purifying (dN/dS < 1) to diversifying or positive selection (dN/dS > 1) or vice versa.
Most of the genes evaluated did not show any sign of changing selective pressure or pattern. However, when looking at the dN/dS variation data, 14 genes appeared as outliers (see Materials and Methods) (Fig. 5A). Genes Rv1244 (lpqZ), Rv3910, Rv0166 (fadD5), Rv0874c, Rv1152, Rv1678, Rv1951c, Rv2584c (apt), Rv3026c, Rv3276c (purK), Rv3370, Rv3759c (proX), and Rv3900c were under a stronger negative selective pressure following speciation. Many of them are annotated as hypothetical conserved proteins. On the other hand, only one gene changed to evolve under positive selection after divergence from the MTBC ancestor Rv0758, also known as phoR. Notably, PhoR forms part of the PhoP/PhoR virulence regulation system (22). In the branch leading to the MTBC ancestor, this gene was as conserved at the amino acid level as other essential genes (P = 0.4721, chi-square test), but when we looked within the extant MTBC diversity, the gene was significantly less conserved at the amino acid level than essential genes (P < 0.001, chi-square test).
Fig. 5. Genes with differential selective pressures across the MTBC speciation stages.
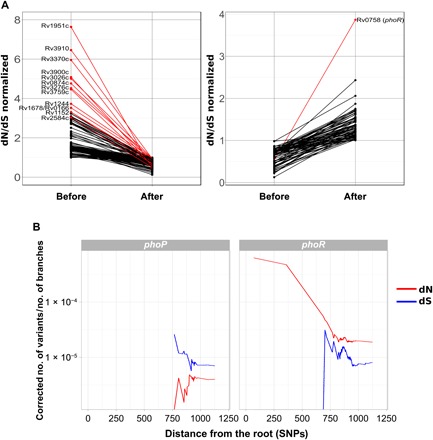
(A) Genes changing selective pressure in the branch of the MTBC ancestor as compared to extant MTBC strains. Red lines mark those genes being outliers of the dN/dS variation distribution. (B) phoR and phoP show different selective pressure dynamics. In both cases, the accumulation of nonsynonymous (dN) or synonymous (dS) mutations through time is measured as the distance to the most common ancestor of the MTBC. The dN and dS values have been corrected by the number of branches in the phylogeny at each time point.
Positive selection on phoR linked to ongoing selective pressures
Given the known central role of PhoPR in MTBC virulence, we focused our attention on the previously unidentified mutations found in phoR. Previous work identified a basal phylogenetic mutation in phoR experimentally linked to animal host preferences. Here, we report 193 nonsynonymous mutations and 31 synonymous mutations exclusive of human isolates and mapping to very different phylogenetic depths (Fig. 6A). The average dN/dS for this gene was well above 1 (dN/dS = 2.37), suggesting the action of positive selection. Furthermore, a plot of the dN and dS values over time reveals that the overall dN/dS remained high along the evolutionary history of the MTBC (Fig. 5B) in comparison with the DNA binding response regulator (phoP), corroborating that phoR has been likely under pervasive positive selection. Codon-based maximum likelihood tests of positive selection normally are not suited for intraspecies comparisons; however, in the case of phoR, the tests identified a higher dN/dS than expected by chance and at least two codons with strong evidence to be under positive selection (table S5). Additional evidence for the action of positive selection on this gene derives from nonsynonymous mutations, among which we found 34 homoplastic variants, which are strong predictors of positive selection in MTBC (table S6). Nonsynonymous mutations significantly accumulated in the sensor domain (P < 0.01, chi-square test), further supporting the hypothesis that they could be involved in the fine-tuning of the PhoR sensitive function to the changing environment during infection (Fig. 6C).
Fig. 6. phoR is under positive selection in human-affecting strains.
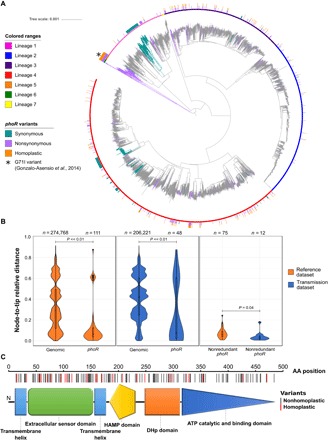
(A) Genome-based phylogeny calculated from a total of 4595 clinical samples obtained from different sources. The synonymous and nonsynonymous variants found in phoR are mapped to the corresponding branch. Variants in internal branches affect complete clades, which are colored in the phylogeny. Homoplasies are marked in the outer circle of the phylogeny. The asterisk marks the G71I phoR variant common to lineages 5 and 6 previously reported by Gonzalo-Asensio et al. (23). (B) Relative age distribution of the nonsynonymous phoR variants in the reference dataset from Coll et al. (16) (left plot) and the transmission dataset from Guerra-Assunção et al. (24) (middle plot) in comparison with the rest of the nonsynonymous genomic variants. In addition, the relative ages of the phoR nonsynonymous variants exclusive of each dataset are shown (right plot). (C) Schematic view of PhoR with the amino acid (AA) changes found across the 4595-sample dataset marked on it. Amino acid changes are significantly more abundant in the sensor domain (P < 0.01). ATP, adenosine 5′-triphosphate. HAMP, Histidine kinase, adenylyl cyclase, methyl-accepting protein and phosphatase domain; DHp, dimerization and histidine phosphotransfer.
All the mutations identified in our analysis were found in human clinical isolates and mapped to relatively recent branches in the MTBC phylogeny (Fig. 6A). Thus, we reasoned that most mutations were associated with recent selective pressures as opposed to the previously reported mutations found in M. africanum lineages 5 and 6 and the animal-adapted strains (23) that map to deep branches in the phylogeny (Fig. 6A). To get insights into this hypothesis, we tested whether novel phoR mutations also arise in clinical settings during infection and recent transmission events. We used a population-based dataset from Malawi (24) where more than 70% of the strains were collected during a 15-year period and genome-sequenced (n = 1187). We found 13 mutations (12 nonsynonymous and 1 synonymous) in phoR exclusive of the Malawi dataset with phoR having a dN/dS of 3.93. Moreover, the mean relative age of the nonsynonymous phoR variants was significantly younger than that of other nonsynonymous variants in both datasets (P << 0.01, Welch’s t test), and the phoR variants from the Malawi dataset were more recent than those phoR mutations from the reference dataset (P = 0.04, Welch’s t test) (Fig. 6B). From the 12 nonsynonymous mutations in the Malawi dataset, 8 were markers of recent transmission clusters. Moreover, phoR mutations in the Malawi dataset involved larger transmission clusters than other mutations (P <0.001, permutations test).
Together, there is strong evidence for positive selection acting on phoR steaming from higher than expected dN/dS values in the reference dataset, presence of homoplastic variants, and new nonsynonymous mutations linked to larger transmission clusters. Thus, our data indicate that (i) phoR mutations have been selected since the establishment of the MTBC as an obligate pathogen (Fig. 5) and (ii) novel phoR mutations are selected during infection and propagates during human-to-human transmission in current epidemiological settings (Fig. 6).
DISCUSSION
We present evidence that the MTBC ancestor transitioned to an obligate pathogenic lifestyle from a common genetic pool including the ancestors of extant MCAN strains. Earlier work had already demonstrated the high recombination rate in MCAN compared to that in MTBC (7). However, our analysis is different, as it focuses specifically on the branch leading to the MTBC by comparing MCAN to a reconstructed MTBC common ancestor. Specifically, we found common patterns of genome-wide recombination in the branch leading to the MTBC ancestor and the extant MCAN strains. The high recombination rate between MCAN strains, including the MTBC ancestor, stands in sharp contrast to the strictly clonal population structure of extant MTBC strains. By analyzing events leading to the transition from a recombinogenic to a clonal organism, we have also been able to identify genomic regions under different selective pressures. Comparison of selective pressures before and after becoming an obligate pathogen also allows us to propose PhoR as an important player in the past evolutionary history of the MTBC as well as in current clinical settings.
Population genomics data have led to the development and testing of different models of how different genetic clusters of the same species can arise in sympatry (25). In the case of Vibrio cholerae, an appropriate combination of certain virulence-associated variants, ecological opportunity, and additional virulence factors mediated the successful transition of a particular clone from an environmental to a pathogenic lifestyle (26). Other known cases such as pathogenic Salmonella (27) or Yersinia species (28) may have followed a similar trajectory. The MTBC represents an extreme case of clonal emergence associated to its obligate pathogenic lifestyle. Here, we have shown that, despite the high average nucleotide identity between MCAN and the MTBC, there is complete genomic isolation between these organisms. There is experimental evidence that genetic exchange among MCAN strains occurs easily but not between MCAN and the MTBC (29). We have shown that there is no measurable ongoing recombination among the MTBC strains based on our analysis of 1591 genomes, which is in agreement with other recent reports (12, 30). Because of the low divergence within the MTBC, most methods to detect recombination are limited. Hence, we cannot completely exclude the possibility that we might have missed some recombination events. It was previously suggested that recombination (or gene conversion) could be affecting PE/PPE genes disproportionally (31). Unfortunately, short reads cannot be properly mapped to those regions; thus, our approach does not allow one to test this possibility. The same limitation applies to comparative analysis of structural variation and gene gains/losses between MCAN and MTBC. Larger datasets involving assemblies from long-read sequencing data will likely elucidate genome evolution of these two groups beyond SNPs. However, if recombination does occur in the MTBC, then it seems to have a minor impact on the overall genetic diversity of the MTBC. Recombination in natural populations depends both on the capacity of chromosomal DNA exchange between the two groups involved and on the ecological opportunity. The mechanisms, if any, by which the MTBC bacilli lost their capacity to recombine while the ancestral genetic pool showed very similar recombination patterns to MCAN strains remain to be elucidated. Ecological opportunity may also influence the lack of opportunities of exchange between MTBC strains. Despite the occurrence of superinfections, the bacilli mainly occupy an intracellular lifestyle, thereby reducing the opportunities for genetic exchange.
We can only speculate on how the transition from a likely environmental or opportunistic pathogen to an obligate pathogen occurred, but our analysis has identified a series of nonrandom evolutionary events. Notably, those events involve core pathogenesis genes. We have identified highly divergent regions in the MTBC ancestor compared to MCAN. The pattern of SNP accumulation suggests that those regions were important in the transition to a closer association with the host. In addition, recombination events mapping to the branch leading to the MTBC ancestor affected essential genes as well as genic regions known to be involved in host-pathogen interaction. The mymA operon (Rv3083-Rv3089) is related to the production of mycolic acids, and its disruption leads to an aberrant cell wall structure. Knockout studies (32) have shown that this operon is essential for growth in macrophages and the spleen of infected mice. Furthermore, the deletion of genes in this operon leads to a higher tumor necrosis factor–α production, highlighting their role in regulating host-pathogen interactions (33). The other major operon identified in our analysis is the mce1 operon (34). mce1 knockout mutants are hypervirulent in a mouse model of infection and lose the capacity of a proper proinflammatory cytokine production that is needed for the establishment of the infection (35) and granuloma (34). How these processes are mediated by mce1 is still not clear, pointing to mce1 as a priority target for biomedical research.
Our analysis identified one gene, phoR, which is under positive selection in extant MTBC strains, although it was under purifying selection in the MTBC ancestor. PhoR is the sensor component of the PhoPR two-component system, which plays a major role in MTBC pathogenesis (36). Previous experimental data show (i) that PhoPR is a major virulence determinant in MTBC (22), (ii) that deep phylogenetic branching mutations in PhoPR were involved in the adaptation of the pathogen to different mammalian hosts (23), and (iii) that there is at least one case in which natural overexpression of PhoPR in an M. bovis clinical isolate was linked to a highly transmissible and virulent phenotype in humans (36). Mutations affecting the whole animal clade in phoR have been proposed to be related with the fine-tuned MTBC virulence across different animal host species. We found alternative amino acid changes in the same codon experimentally tested by Gonzalo-Asensio et al. (23); thus, changes in this codon could have been selected multiple times in unrelated human isolates. On the basis of these findings, we speculate that recent phoR mutations help fine-tune the immunogenicity of the pathogen during infection, allowing it to manipulate the human host responses and increase the chances of transmission. However, we still need to understand the stimuli and the molecular pathways that are at the basis of the selective pressure driving the evolution of phoR. Given that PhoPR is involved in membrane composition, mutations in this regulator might also be involved in the susceptibility to some antibiotics. However, antibiotic selection is an unlikely explanation for the oldest mutations in PhoPR, as they likely predate antibiotic usage.
On the basis of our findings, a model can be proposed in which recombination, together with the acquisition of new genetic material (9, 37), generated a favorable genetic background for the MTBC ancestor to occupy or increase its association with mammalian hosts. We see this emergence only once in the MTBC, perhaps because the right combination of multiple, fortuitous genetic events and the particular ecological conditions has occurred only once. More provocative is the idea that MTBC might represent only one segment of the spectrum of mycobacterial-host associations occupied by the different MCAN-MTBC groups. The fact that the so-called clone A of MCAN strains are more common in the clinic may suggest differences in ecological niches within the MCAN group (15). In agreement, previous publications (7, 15) and our own analysis (fig. S1) have identified clone A strains as the closest MCAN evolutionary group to MTBC.
In the MTBC, a strong and obligate association with new host(s) was accompanied by new selective pressures. Accordingly, we identified genes in the MTBC genome highly diverging from MCAN and evolving under purifying selection, suggesting that they have become essential following MTBC’s transition to an obligate pathogenic lifestyle. In the final stages of adaptation, positive selection on genes such as phoR and others (38–40) likely led to a narrowing of the host range and later still to further fine-tuning during the spread of these bacteria within the new host species.
MATERIALS AND METHODS
Datasets used
MCAN dataset
The MCAN dataset was composed of seven draft genomes downloaded from GenBank (CIPT 140010059, NC_015848.1; CIPT 140060008, NC_019950.1; CIPT 140070008, NC_019965.1; CIPT 140070002, NZ_CAOL00000000.1; CIPT 140070005, NZ_CAOM00000000.1; CIPT 140070013, NZ_CAON00000000.1; and CIPT 140070007, NZ_CAOO00000000.1).
MTBC datasets
We downloaded all the available genomes from the studies of Coll et al. (16), Walker et al. (41), Guerra-Assunção et al. (24), and Comas et al. (14). The total number of sequences originally downloaded was 7977 genomes. For the dN/dS calculations and phoR variant screening, we used all the downloaded genomes, with the objective of incrementing the robustness of the measures and the number of variants per gene. We identified all clusters at a maximum distance of 15 SNPs (common threshold in M. tuberculosis epidemiology), removed samples potentially coinfected with more than one strain, and then kept just one representative from each cluster. Thus, the final number of genomes for these analyses was 4595. The rest of the analyses were performed in smaller subsets of samples because of computational limitations or the specific features of each dataset. A 1591-sequence subset from the Coll et al. (16) samples was used for the recombination analyses within the MTBC, as they include global representatives of the MTBC diversity. A smaller subset of these, which included 219 sequences corresponding also to global representatives, was used for Gubbins because it was not computationally feasible to run the program with more strains. Last, genomes from the Guerra-Assunção et al. (24) dataset, which includes samples taken over a 15-year period in a high-transmission setting (thus enriched in transmission clusters), were used for the phoR transmission analysis (n = 1187). Information about all the strains used in this study (including its accession numbers) can be found in table S7.
The most likely ancestral genome of MTBC
The MTBC ancestor was derived in a previous publication by maximum parsimony and likelihood methods (20). This ancestor is H37Rv-like in terms of genome structural variants, but H37Rv alleles were replaced by those present in the inferred common ancestor of all MTBC lineages.
FASTQ mapping and variant calling for the MTBC strains
FASTQ files were trimmed to remove low-quality reads using PRINSEQ (42) and aligned to the most likely inferred ancestor of MTBC (20) using BWA-MEM algorithm (43). Alignments with less than 20× mean coverage per base were filtered out. The variant calling was performed using SAMtools and VarScan (44). Because of the low variability found in M. tuberculosis, to avoid mapping errors and false SNPs, a variant was filtered out if (i) it was supported by less than 20 reads, (ii) it was found in a frequency of less than 0.9, (iii) it was found near indel areas (10-bp window), or (iv) it was found in areas of high accumulation of variants (more than three variants in a 10-bp defined window). Variants were annotated using SnpEff (45). Variants present in PE/PPE genes, phages, or repeated sequences were also filtered out, as they tend to accumulate SNPs owing to mapping errors. High-quality variant calls were combined in a nonredundant variant list and used to retrieve the most likely allele at each strain to generate a variant alignment.
Phylogenetic inference and parsimony mapping of SNPs
In the MTBC dataset, we identified 140,239 variants following the steps defined above. As we wanted to identify nucleotide variants due to recombination events, a stricter filtering was applied to remove putative recombination signal due to polymorphisms introduced by other causes. To avoid false positives, we also removed positions in which a variant was called in at least one strain but also with a gap in at least another strain. Variants related to antibiotic resistance were obtained from PhyResSe (46) and were removed from the analysis. In addition, nonbiallelic variants were removed from the analysis. To identify variants resulting from mapping errors, we generated fragments of 50 bp downstream, upstream, and midstream of the variant positions in the reference genome. With these fragments, we performed a BLAST (basic local alignment search tool) search over the reference genome to check whether they mapped to other regions. Variants identified in reads that mapped to more than one region of the reference genome [query coverage per HSP (high scoring segment pair) over 98% and percentage of identical matches between the query and the reference genome of 98%] were removed from the analysis.
The remaining variants (94,780) were used to infer a phylogenetic tree using RAxML (47) with the GTRCATI [GTR (generalized time reversible model) + optimization of substitution rates + optimization of site-specific evolutionary rates] model of evolution. Variants were mapped to the phylogeny using the Mesquite suite (www.mesquiteproject.org/). Homoplastic variants were identified on the basis of parsimony criteria. Using these homoplastic variant positions, we looked for consecutive homoplastic variants (allowing at least one variant between them). The detected variants were mapped on the phylogeny using Mesquite to look for coincident phylogenetic patterns.
LD calculation
Using the filtered variant positions (94,780), we used the PLINK software (48) to calculate the LD statistics D′ and R2. To estimate these values, we took into account variants with a minimum frequency of 0.01 and used a sliding window of 10 kb. To plot the D′ and R2 pattern by variant distance, we calculated average D′ and R2 values for 50-bp sliding windows.
Multiple alignment of MCAN and MTBC
Seven MCAN draft genomes were aligned to each other and to the ancestor of MTBC using progressiveMauve (49). The segmented alignment obtained in XMFA (eXtended Multi-FastA) format was converted to a plain FASTA format using the MTBC ancestor as reordering reference with a custom Perl script. Positions with gaps in the reference sequence were removed from the final alignment; hence, the resulting aligned genomes had the same size as the reconstructed MTBC ancestor (4,411,532 Mb). The MTBC pseudogenomes reconstructed from mapping to the MTBC ancestor from the different datasets described above were concatenated to the MCAN alignment obtained in the previous step for further analyses.
From these alignments, homoplastic variants were identified using both parsimony and maximum likelihood approaches (50). Both approaches agreed in identifying the same homoplastic variants.
Recombination analyses and phylogenetic evaluation
Besides SNPs, LD analysis, and Gubbins, RDP4 (51) was used to detect recombination signal in the MTBC dataset. To mark the regions reported by Gubbins as potentially recombinant, we required at least three of the methods implemented in RDP4 to agree in showing a significant signal.
Recombination was evaluated in the alignment containing 219 MTBC strains and 7 MCAN strains and in the one containing the MTBC ancestor and 7 MCAN strains. First, repetitive regions [i.e., PPE/PGRS(polymorphic GC-rich sequence)] were masked from both alignments, and second, recombination events were inferred using Gubbins (52), which identifies clusters of high SNP density as markers.
Gubbins identified 70 potential recombinant regions in the alignment containing the seven MCAN strains and the MTBC ancestor. Four of these regions were obviated because they fell in regions deleted in several MCAN strains. One more region was removed from the analysis because it was extremely short (41 bp), and we did not obtain reliable results in the subsequent analyses.
For the remaining 65 fragments, a phylogeny was calculated using RAxML (47) and applying the GTRCATI model. In addition, a reference phylogeny was calculated with the same method using the complete genomes after subtracting these 65 regions. This reference phylogeny had the same topology as the one obtained from the complete genomes. To test for phylogenetic incongruence between the putative recombination fragments and the genome phylogeny, we applied the Shimodaira-Hasegawa and expected likelihood weight tests implemented in TREE-PUZZLE (53).
Dating analyses
To infer the age of the 65 recombinant fragments, we first reasoned that most of the mutations found were contributed by recombination and not by mutation once the fragment had been integrated in the genome. Thus, before dating the fragments, we first removed all the homoplastic variants with other MCAN strains found in the fragments. The final alignments for the 65 fragments consisted of only those variants accumulated after the recombination event. We then used the nonrecombinant part of the genome to infer a substitution rate assuming two different dating scenarios published for the tMRCA (5, 54). We ran BEAST (55) for each fragment prespecifying monophyletic groups and substitution rate based on the nonrecombinant genome phylogenetic reconstruction. We used an uncorrelated log-normal distribution for the substitution rate in all cases and a skyline model for population size changes. We ran several chains of up to 10 × 106 generations sampling every 1 × 10³ generations to ensure independent convergence of the parameters. For both evolutionary scenarios, the results obtained were largely congruent and proportional to the age limit imposed for the MTBC ancestor. The 5-ka scenario (54) was selected for plotting the ages in Fig. 3A and fig. S3, as there is now more evidence for this time frame.
Gene ontology enrichment analysis
A gene set enrichment analysis was performed to look for enriched gene functions in the recombinant regions. The BiNGO tool (56) was used to study the enrichment in certain functional categories comparing the most abundant terms in the recombinant regions with those contained in the complete annotation. The tool uses a hypergeometric test (sampling without replacement) and the BH (Benjamini-Hochberg) correction for multiple testing comparisons.
divSNP analysis
From the MCAN and MTBC ancestor alignment, we extracted those positions having one variant in all the MCAN strains and another variant in the M. tuberculosis ancestor. The divSNP frequency by nucleotide was calculated by dividing the total number of divSNPs (5688) by the total number of bases in the alignment. Next, the expected abundance of divSNPs for each gene was calculated by multiplying the nucleotide divSNP frequency by the number of nucleotides in each gene. From the expected and observed divSNP abundances, we used a Poisson distribution to calculate the probability of having the observed divSNPs by chance for each gene. We selected genes having a positive false discovery rate ≤0.01.
Complete mycobacterial genomes for reference strains (table S8) were downloaded from RefSeq and GenBank. The orthologous genes were obtained from the amino acid sequences and using the Proteinortho tool (57). A gene was considered as orthologous on the basis of reciprocal best hits in BLAST. BLAST analysis required a minimum identity of 25%, a query coverage of 50%, and a maximum e value of 1 × 10⁻⁵. The orthologous genes were aligned using Clustal, and the phylogenies were constructed using RAxML and applying the PROTCATIAUTO model. The reference phylogeny was constructed using only the core genome (proteins having orthologous genes in all the mycobacterial genomes downloaded) with RAxML using the same options as above. The reference and alternative phylogenies calculated with the orthologous genes for the divSNP-enriched genes were manually inspected to check for congruence.
dN/dS analysis
The potential synonymous and nonsynonymous substitution sites for each region were calculated using the SNAP tool (58). The dN/dS ratio for each region was calculated and detailed in Eq. 1
| (1) |
The dN/dS for the MTBC ancestor was calculated using the divSNPs, while the dN/dS for the MTBC was calculated using 208,238 variants detected in coding regions from the 4595 strains in the MTBC global dataset. To look for a robust comparison between both ratios, only genes having at least one synonymous variant and one nonsynonymous variant were taken into account. To compare the dN/dS ratios, both were normalized by the genomic dN/dS for each taxon (0.24 for the MTBC ancestor and 0.59 for the MTBC). The difference between the dN/dS ratio was calculated by subtracting the MTBC dN/dS to that of the MTBC ancestor. The genes that account for the largest differences in the dN/dS were identified as outliers (Q2 − 1.5*IQR, Q3 + 1.5*IQR) of the differences distribution.
phoR positive selection analysis
Positive selection on phoR was tested using FUBAR and BUSTED (59). FUBAR was run with five Markov chain Monte Carlo chains of length 10,000,000. One million states were used as burn-in, as well as and a Dirichlet prior of 0.5. BUSTED was run with default parameters.
To study the potential effect of phoR mutations on transmission efficacy, we used the dataset from Guerra-Assunção et al. (24). We identified SNPs in branches leading either to leaves or to transmission clusters. Transmission clusters were categorized into large, medium, or small according to the number of isolates in the cluster (large, over 75th percentile; medium, between 25th and 75th percentile; and small, under 25th percentile). Each gene was scored to check for accumulation of mutations in branches leading to large transmission clusters according to Eq. 2
| (2) |
Genes with high mutation rates have a higher number of polymorphisms that could lead to a larger score by chance. To test the probability of obtaining the observed score by chance, a permutation test was carried out 10,000 times. Each of the identified SNP was randomly reassigned to the same branches, and the score was recalculated for each gene. The expected score distribution for each gene was compared to the observed score to calculate the probability. This test was performed for transmission events defined at 10 SNPs.
The ages for the variant positions were calculated as node-to-tip distances. These distances were relativized to the maximum root-to-tip distance to obtain a relative age value in the 0 to 1 range. To have a common framework, a phylogeny was constructed, including all the samples from the transmission and the reference datasets. The phylogeny was constructed using RAxML and applying the GTRCATI model. For each variant position, we first identified the node in which the variant appeared. The node-to-tip distance was calculated afterward for each node using the geiger package (60). Distances were normalized to obtain a relative distance. Later, all the nonsynonymous variants except for the phoR polymorphisms were used as a reference set. The nonsynonymous phoR variants to be compared were categorized into two groups, those exclusive to the reference dataset (16) and those derived from the transmission dataset (24).
PhoR domain structure representation
The PhoR domain structure was inferred by using Pfam and SMART databases.
Supplementary Material
Acknowledgments
We thank A. Marina for advice in the interpretation of the PhoR molecular structure. Funding: This work was funded by projects of the European Research Council (638553-TB-ACCELERATE) and Ministerio de Economía y Competitividad (Spanish government) research grant SAF2016-77346-R (to I.C.); BFU2014-58656-R and BFU2017-89594-R from Ministerio de Economía y Competitividad (Spanish government) and PROMETEO/2016/122 from Generalitat Valenciana (to F.G.-C); and the Swiss National Science Foundation (grants 310030_166687, IZRJZ3_164171, IZLSZ3_170834, and CRSII5_177163), the European Research Council (309540-EVODRTB), and SystemsX.ch (to S.G.). Á.C.-O. is the recipient of an FPU fellowship from Ministerio de Ciencia, Innovación y Universidades FPU13/00913 (Spanish government). L.S.-B. was funded by Wellcome grant number 098051. Author contributions: I.C. conceived this work. Á.C.-O., I.C., L.S.-B., S.R.H., J.C., and F.G.-C. analyzed the data. Á.C.-O., I.C., L.S.-B., and F.G.-C. wrote the first version of the draft. All authors critically reviewed and contributed to the final version of the manuscript. Competing interests: The authors declare that they have no competing interests. Data and materials availability: All data needed to evaluate the conclusions in their respective paper are present in the paper and/or the Supplementary Materials. The main genomic datasets can be downloaded from their original studies, which are specified in their respective materials and methods sections. Additional data related to this paper may be requested from the authors.
SUPPLEMENTARY MATERIALS
Supplementary material for this article is available at http://advances.sciencemag.org/cgi/content/full/5/6/eaaw3307/DC1
Supplementary Text
Fig. S1. Maximum likelihood phylogeny of the MCAN group, including the most likely inferred ancestor of MTBC.
Fig. S2. Phylogenetic incongruence test.
Fig. S3. Recombination fragments ages derived from BEAST.
Table S1. Variants identified as homoplastic and phylogenetically convergent.
Table S2. Potential recombination fragments detected between the MTBC ancestor and MCAN.
Table S3. Results of the phylogenetic comparison of genes having a significant accumulation of divSNPs.
Table S4. Analysis of dN/dS variation between the MTBC ancestor and the MTBC.
Table S5. Codons with strong evidence of being under positive selection as detected by FUBAR.
Table S6. Variants found in the phoR gene.
Table S7. Accession numbers and description of the MTBC strains analyzed.
Table S8. Accession numbers of the mycobacterial genomes used to construct the reference phylogeny.
REFERENCES AND NOTES
- 1.B. J. Shapiro, What microbial population genomics has taught us about speciation, in Population Genomics, M. Polz, O. P. Rajora, Eds. (Springer, 2018). [Google Scholar]
- 2.Marttinen P., Hanage W. P., Speciation trajectories in recombining bacterial species. PLOS Comput. Biol. 13, e1005640 (2017). [DOI] [PMC free article] [PubMed] [Google Scholar]
- 3.Shapiro B. J., Polz M. F., Microbial speciation. Cold Spring Harb. Perspect. Biol. 7, a018143 (2015). [DOI] [PMC free article] [PubMed] [Google Scholar]
- 4.World Health Organization, Global Tuberculosis Report 2017 (World Health Organization, 2017); www.who.int/tb/publications/global_report/en/.
- 5.Comas I., Coscolla M., Luo T., Borrell S., Holt K. E., Kato-Maeda M., Parkhill J., Malla B., Berg S., Thwaites G., Yeboah-Manu D., Bothamley G., Mei J., Wei L., Bentley S., Harris S. R., Niemann S., Diel R., Aseffa A., Gao Q., Young D., Gagneux S., Out-of-Africa migration and Neolithic coexpansion of Mycobacterium tuberculosis with modern humans. Nat. Genet. 45, 1176–1182 (2013). [DOI] [PMC free article] [PubMed] [Google Scholar]
- 6.Stucki D., Brites D., Jeljeli L., Coscolla M., Liu Q., Trauner A., Fenner L., Rutaihwa L., Borrell S., Luo T., Gao Q., Kato-Maeda M., Ballif M., Egger M., Macedo R., Mardassi H., Moreno M., Vilanova G. T., Fyfe J., Globan M., Thomas J., Jamieson F., Guthrie J. L., Asante-Poku A., Yeboah-Manu D., Wampande E., Ssengooba W., Joloba M., Boom W. H., Basu I., Bower J., Saraiva M., Vasconcellos S. E. G., Suffys P., Koch A., Wilkinson R., Gail-Bekker L., Malla B., Ley S. D., Beck H.-P., de Jong B. C., Toit K., Sanchez-Padilla E., Bonnet M., Gil-Brusola A., Frank M., Penlap Beng V. N., Eisenach K., Alani I., Ndung’u P. W., Revathi G., Gehre F., Akter S., Ntoumi F., Stewart-Isherwood L., Ntinginya N. E., Rachow A., Hoelscher M., Cirillo D. M., Skenders G., Hoffner S., Bakonyte D., Stakenas P., Diel R., Crudu V., Moldovan O., Al-Hajoj S., Otero L., Barletta F., Carter E. J., Diero L., Supply P., Comas I., Niemann S., Gagneux S., Mycobacterium tuberculosis lineage 4 comprises globally distributed and geographically restricted sublineages. Nat. Genet. 48, 1535–1543 (2016). [DOI] [PMC free article] [PubMed] [Google Scholar]
- 7.Supply P., Marceau M., Mangenot S., Roche D., Rouanet C., Khanna V., Majlessi L., Criscuolo A., Tap J., Pawlik A., Fiette L., Orgeur M., Fabre M., Parmentier C., Frigui W., Simeone R., Boritsch E. C., Debrie A.-S., Willery E., Walker D., Quail M. A., Ma L., Bouchier C., Salvignol G., Sayes F., Cascioferro A., Seemann T., Barbe V., Locht C., Gutierrez M.-C., Leclerc C., Bentley S. D., Stinear T. P., Brisse S., Médigue C., Parkhill J., Cruveiller S., Brosch R., Genomic analysis of smooth tubercle bacilli provides insights into ancestry and pathoadaptation of Mycobacterium tuberculosis. Nat. Genet. 45, 172–179 (2013). [DOI] [PMC free article] [PubMed] [Google Scholar]
- 8.Aboubaker Osman D., Bouzid F., Canaan S., Drancourt M., Smooth tubercle bacilli: Neglected opportunistic tropical pathogens. Front. Public Health 3, 283 (2016). [DOI] [PMC free article] [PubMed] [Google Scholar]
- 9.Veyrier F., Pletzer D., Turenne C., Behr M. A., Phylogenetic detection of horizontal gene transfer during the step-wise genesis of Mycobacterium tuberculosis. BMC Evol. Biol. 9, 196 (2009). [DOI] [PMC free article] [PubMed] [Google Scholar]
- 10.Brennan P. J., Bacterial evolution: Emergence of virulence in TB. Nat. Microbiol. 1, 15031 (2016). [DOI] [PubMed] [Google Scholar]
- 11.Koeck J.-L., Fabre M., Simon F., Daffé M., Garnotel, Matan A. B., Gérôme P., Bernatas J.-J., Buisson Y., Pourcel C., Clinical characteristics of the smooth tubercle bacilli Mycobacterium canettii infection suggest the existence of an environmental reservoir. Clin. Microbiol. Infect. 17, 1013–1019 (2011). [DOI] [PubMed] [Google Scholar]
- 12.Boritsch E. C., Khanna V., Pawlik A., Honoré N., Navas V. H., Ma L., Bouchier C., Seemann T., Supply P., Stinear T. P., Brosch R., Key experimental evidence of chromosomal DNA transfer among selected tuberculosis-causing mycobacteria. Proc. Natl. Acad. Sci. 113, 9876–9881 (2016). [DOI] [PMC free article] [PubMed] [Google Scholar]
- 13.Namouchi A., Didelot X., Schöck U., Gicquel B., Rocha E. P. C., After the bottleneck: Genome-wide diversification of the Mycobacterium tuberculosis complex by mutation, recombination, and natural selection. Genome Res. 22, 721–734 (2012). [DOI] [PMC free article] [PubMed] [Google Scholar]
- 14.Comas I., Hailu E., Kiros T., Bekele S., Mekonnen W., Gumi B., Tschopp R., Ameni G., Hewinson R. G., Robertson B. D., Goig G. A., Stucki D., Gagneux S., Aseffa A., Young D., Berg S., Population genomics of Mycobacterium tuberculosis in Ethiopia contradicts the virgin soil hypothesis for human tuberculosis in Sub-Saharan Africa. Curr. Biol. 25, 3260–3266 (2015). [DOI] [PMC free article] [PubMed] [Google Scholar]
- 15.Blouin Y., Cazajous G., Dehan C., Soler C., Vong R., Hassan M. O., Hauck Y., Boulais C., Andriamanantena D., Martinaud C., Martin É., Pourcel C., Vergnaud G., Progenitor Mycobacterium canettii clone responsible for lymph node tuberculosis epidemic, Djibouti. Emerg. Infect. Dis. 20, 21–28 (2014). [DOI] [PMC free article] [PubMed] [Google Scholar]
- 16.Coll F., McNerney R., Guerra-Assunção J. A., Glynn J. R., Perdigão J., Viveiros M., Portugal I., Pain A., Martin N., Clark T. G., A robust SNP barcode for typing Mycobacterium tuberculosis complex strains. Nat. Commun. 5, 4812 (2014). [DOI] [PMC free article] [PubMed] [Google Scholar]
- 17.Farhat M. R., Shapiro B. J., Kieser K. J., Sultana R., Jacobson K. R., Victor T. C., Warren R. M., Streicher E. M., Calver A., Sloutsky A., Kaur D., Posey J. E., Plikaytis B., Oggioni M. R., Gardy J. L., Johnston J. C., Rodrigues M., Tang P. K. C., Kato-Maeda M., Borowsky M. L., Muddukrishna B., Kreiswirth B. N., Kurepina N., Galagan J., Gagneux S., Birren B., Rubin E. J., Lander E. S., Sabeti P. C., Murray M., Genomic analysis identifies targets of convergent positive selection in drug-resistant Mycobacterium tuberculosis. Nat. Genet. 45, 1183–1189 (2013). [DOI] [PMC free article] [PubMed] [Google Scholar]
- 18.Mortimer T. D., Weber A. M., Pepperell C. S., Signatures of selection at drug resistance loci in Mycobacterium tuberculosis. mSystems 3, e00108-17 (2018). [DOI] [PMC free article] [PubMed] [Google Scholar]
- 19.Hedrick P., Kumar S., Mutation and linkage disequilibrium in human mtDNA. Eur. J. Hum. Genet. 9, 969–972 (2001). [DOI] [PubMed] [Google Scholar]
- 20.Comas I., Chakravartti J., Small P. M., Galagan J., Niemann S., Kremer K., Ernst J. D., Gagneux S., Human T cell epitopes of Mycobacterium tuberculosis are evolutionarily hyperconserved. Nat. Genet. 42, 498–503 (2010). [DOI] [PMC free article] [PubMed] [Google Scholar]
- 21.Gutierrez M. C., Brisse S., Brosch R., Fabre M., Omaïs B., Marmiesse M., Supply P., Vincent V., Ancient origin and gene mosaicism of the progenitor of Mycobacterium tuberculosis. PLOS Pathog. 1, e5 (2005). [DOI] [PMC free article] [PubMed] [Google Scholar]
- 22.Gonzalo-Asensio J., Mostowy S., Harders-Westerveen J., Huygen K., Hernández-Pando R., Thole J., Behr M., Gicquel B., Martín C., PhoP: A missing piece in the intricate puzzle of Mycobacterium tuberculosis virulence. PLOS ONE 3, –e3496 (2008). [DOI] [PMC free article] [PubMed] [Google Scholar]
- 23.Gonzalo-Asensio J., Malaga W., Pawlik A., Astarie-Dequeker C., Passemar C., Moreau F., Laval F., Daffe M., Martin C., Brosch R., Guilhot C., Evolutionary history of tuberculosis shaped by conserved mutations in the PhoPR virulence regulator. Proc. Natl. Acad. Sci. U.S.A. 111, 11491–11496 (2014). [DOI] [PMC free article] [PubMed] [Google Scholar]
- 24.Guerra-Assunção J. A., Crampin A. C., Houben R. M. G. J., Mzembe T., Mallard K., Coll F., Khan P., Banda L., Chiwaya A., Pereira R. P. A., McNerney R., Fine P. E. M., Parkhill J., Clark T. G., Glynn J. R., Large-scale whole genome sequencing of M. tuberculosis provides insights into transmission in a high prevalence area. eLife 4, e05166 (2015). [DOI] [PMC free article] [PubMed] [Google Scholar]
- 25.Vos M., A species concept for bacteria based on adaptive divergence. Trends Microbiol. 19, 1–7 (2011). [DOI] [PubMed] [Google Scholar]
- 26.Shapiro B. J., Levade I., Kovacikova G., Taylor R. K., Almagro-Moreno S., Origins of pandemic Vibrio cholerae from environmental gene pools. Nat. Microbiol. 2, 16240 (2016). [DOI] [PubMed] [Google Scholar]
- 27.Bäumler A., Fang F. C., Host specificity of bacterial pathogens. Cold Spring Harb. Perspect. Med. 3, a010041 (2013). [DOI] [PMC free article] [PubMed] [Google Scholar]
- 28.McNally A., Thomson N. R., Reuter S., Wren B. W., “Add, stir and reduce”: Yersinia spp. as model bacteria for pathogen evolution. Nat. Rev. Microbiol. 14, 177–190 (2016). [DOI] [PubMed] [Google Scholar]
- 29.Boritsch E. C., Frigui W., Cascioferro A., Malaga W., Etienne G., Laval F., Pawlik A., le Chevalier F., Orgeur M., Ma L., Bouchier C., Stinear T. P., Supply P., Majlessi L., Daffé M., Guilhot C., Brosch R., pks5-recombination-mediated surface remodelling in Mycobacterium tuberculosis emergence. Nat. Microbiol. 1, 15019 (2016). [DOI] [PubMed] [Google Scholar]
- 30.Mortimer T. D., Pepperell C. S., Genomic signatures of distributive conjugal transfer among mycobacteria. Genome Biol. Evol. 6, 2489–2500 (2014). [DOI] [PMC free article] [PubMed] [Google Scholar]
- 31.Phelan J. E., Coll F., Bergval I., Anthony R. M., Warren R., Sampson S. L., Gey van Pittius N. C., Glynn J. R., Crampin A. C., Alves A., Bessa T. B., Campino S., Dheda K., Grandjean L., Hasan R., Hasan Z., Miranda A., Moore D., Panaiotov S., Perdigao J., Portugal I., Sheen P., de Oliveira Sousa E., Streicher E. M., van Helden P. D., Viveiros M., Hibberd M. L., Pain A., McNerney R., Clark T. G., Recombination in pe/ppe genes contributes to genetic variation in Mycobacterium tuberculosis lineages. BMC Genomics 17, 151 (2016). [DOI] [PMC free article] [PubMed] [Google Scholar]
- 32.Cheruvu M., Plikaytis B. B., Shinnick T. M., The acid-induced operon Rv3083–Rv3089 is required for growth of Mycobacterium tuberculosis in macrophages. Tuberculosis 87, 12–20 (2007). [DOI] [PubMed] [Google Scholar]
- 33.Olsen A., Chen Y., Ji Q., Zhu G., De Silva A. D., Vilchèze C., Weisbrod T., Li W., Xu J., Larsen M., Zhang J., Porcelli S. A., Jacobs W. R. Jr., Chan J., Targeting Mycobacterium tuberculosis tumor necrosis factor alpha-downregulating genes for the development of antituberculous vaccines. MBio 7, e01023-15 (2016). [DOI] [PMC free article] [PubMed] [Google Scholar]
- 34.Casali N., White A. M., Riley L. W., Regulation of the Mycobacterium tuberculosis mce1 operon. J. Bacteriol. 188, 441–449 (2006). [DOI] [PMC free article] [PubMed] [Google Scholar]
- 35.Shimono N., Morici L., Casali N., Cantrell S., Sidders B., Ehrt S., Riley L. W., Hypervirulent mutant of Mycobacterium tuberculosis resulting from disruption of the mce1 operon. Proc. Natl. Acad. Sci. U.S.A. 100, 15918–15923 (2003). [DOI] [PMC free article] [PubMed] [Google Scholar]
- 36.Broset E., Martín C., Gonzalo-Asensio J., Evolutionary landscape of the Mycobacterium tuberculosis complex from the viewpoint of PhoPR: Implications for virulence regulation and application to vaccine development. MBio 6, e01289-15 (2015). [DOI] [PMC free article] [PubMed] [Google Scholar]
- 37.Orgeur M., Brosch R., Evolution of virulence in the Mycobacterium tuberculosis complex. Curr. Opin. Microbiol. 41, 68–75 (2018). [DOI] [PubMed] [Google Scholar]
- 38.Ates L. S., Dippenaar A., Ummels R., Piersma S. R., van der Woude A. D., van der Kuij K., le Chevalier F., Mata-Espinosa D., Barrios-Payán J., Marquina-Castillo B., Guapillo C., Jiménez C. R., Pain A., Houben E. N. G., Warren R. M., Brosch R., Hernández-Pando R., Bitter W., Mutations in ppe38 block PE_PGRS secretion and increase virulence of Mycobacterium tuberculosis. Nat. Microbiol. 3, 181–188 (2018). [DOI] [PubMed] [Google Scholar]
- 39.Malone K. M., Rue-Albrecht K., Magee D. A., Conlon K., Schubert O. T., Nalpas N. C., Browne J. A., Smyth A., Gormley E., Aebersold R., MacHugh D. E., Gordon S. V., Comparative 'omics analyses differentiate Mycobacterium tuberculosis and Mycobacterium bovis and reveal distinct macrophage responses to infection with the human and bovine tubercle bacilli. Microb. Genom. 4, e000163 (2018). [DOI] [PMC free article] [PubMed] [Google Scholar]
- 40.Holt K. E., McAdam P., Thai P. V. K., Thuong N. T. T., Ha D. T. M., Lan N. N., Lan N. H., Nhu N. T. Q., Hai H. T., Ha V. T. N., Thwaites G., Edwards D. J., Nath A. P., Pham K., Ascher D. B., Farrar J., Khor C. C., Teo Y. Y., Inouye M., Caws M., Dunstan S. J., Frequent transmission of the Mycobacterium tuberculosis Beijing lineage and positive selection for the EsxW Beijing variant in Vietnam. Nat. Genet. 50, 849–856 (2018). [DOI] [PMC free article] [PubMed] [Google Scholar]
- 41.Walker T. M., Kohl T. A., Omar S. V., Hedge J., del Ojo Elias C., Bradley P., Iqbal Z., Feuerriegel S., Niehaus K. E., Wilson D. J., Clifton D. A., Kapatai G., Ip C. L. C., Bowden R., Drobniewski F. A., Allix-Béguec C., Gaudin C., Parkhill J., Diel R., Supply P., Crook D. W., Smith E. G., Walker A. S., Ismail N., Niemann S., Peto T. E. A.; Modernizing Medical Microbiology (MMM) Informatics Group , Whole-genome sequencing for prediction of Mycobacterium tuberculosis drug susceptibility and resistance: A retrospective cohort study. Lancet Infect. Dis. 15, 1193–1202 (2015). [DOI] [PMC free article] [PubMed] [Google Scholar]
- 42.Schmieder R., Edwards R., Quality control and preprocessing of metagenomic datasets. Bioinformatics 27, 863–864 (2011). [DOI] [PMC free article] [PubMed] [Google Scholar]
- 43.Li H., Durbin R., Fast and accurate long-read alignment with Burrows-Wheeler transform. Bioinformatics 26, 589–595 (2010). [DOI] [PMC free article] [PubMed] [Google Scholar]
- 44.Koboldt D. C., Zhang Q., Larson D. E., Shen D., McLellan M. D., Lin L., Miller C. A., Mardis E. R., Ding L., Wilson R. K., VarScan 2: Somatic mutation and copy number alteration discovery in cancer by exome sequencing. Genome Res. 22, 568–576 (2012). [DOI] [PMC free article] [PubMed] [Google Scholar]
- 45.Cingolani P., Platts A., Wang L. L., Coon M., Nguyen T., Wang L., Land S. J., Lu X., Ruden D. M., A program for annotating and predicting the effects of single nucleotide polymorphisms, SnpEff: SNPs in the genome of Drosophila melanogaster strain w1118; iso-2; iso-3. Fly 6, 80–92 (2012). [DOI] [PMC free article] [PubMed] [Google Scholar]
- 46.Feuerriegel S., Schleusener V., Beckert P., Kohl T. A., Miotto P., Cirillo D. M., Cabibbe A. M., Niemann S., Fellenberg K., PhyResSE: A web tool delineating Mycobacterium tuberculosis antibiotic resistance and lineage from whole-genome sequencing data. J. Clin. Microbiol. 53, 1908–1914 (2015). [DOI] [PMC free article] [PubMed] [Google Scholar]
- 47.Stamatakis A., RAxML-VI-HPC: Maximum likelihood-based phylogenetic analyses with thousands of taxa and mixed models. Bioinformatics 22, 2688–2690 (2006). [DOI] [PubMed] [Google Scholar]
- 48.Purcell S., Neale B., Todd-Brown K., Thomas L., Ferreira M. A. R., Bender D., Maller J., Sklar P., de Bakker P. I. W., Daly M. J., Sham P. C., PLINK: A tool set for whole-genome association and population-based linkage analyses. Am. J. Hum. Genet. 81, 559–575 (2007). [DOI] [PMC free article] [PubMed] [Google Scholar]
- 49.Darling A. E., Mau B., Perna N. T., progressiveMauve: Multiple genome alignment with gene gain, loss and rearrangement. PLOS ONE 5, e11147 (2010). [DOI] [PMC free article] [PubMed] [Google Scholar]
- 50.Ashkenazy H., Penn O., Doron-Faigenboim A., Cohen O., Cannarozzi G., Zomer O., Pupko T., FastML: A web server for probabilistic reconstruction of ancestral sequences. Nucleic Acids Res. 40, W580–W584 (2012). [DOI] [PMC free article] [PubMed] [Google Scholar]
- 51.Martin D. P., Murrell B., Golden M., Khoosal A., Muhire B., RDP4: Detection and analysis of recombination patterns in virus genomes. Virus Evol. 1, vev003 (2015). [DOI] [PMC free article] [PubMed] [Google Scholar]
- 52.Croucher N. J., Page A. J., Connor T. R., Delaney A. J., Keane J. A., Bentley S. D., Parkhill J., Harris S. R., Rapid phylogenetic analysis of large samples of recombinant bacterial whole genome sequences using Gubbins. Nucleic Acids Res. 43, e15 (2015). [DOI] [PMC free article] [PubMed] [Google Scholar]
- 53.Schmidt H. A., Strimmer K., Vingron M., von Haeseler A., TREE-PUZZLE: Maximum likelihood phylogenetic analysis using quartets and parallel computing. Bioinformatics 18, 502–504 (2002). [DOI] [PubMed] [Google Scholar]
- 54.Bos K. I., Harkins K. M., Herbig A., Coscolla M., Weber N., Comas I., Forrest S. A., Bryant J. M., Harris S. R., Schuenemann V. J., Campbell T. J., Majander K., Wilbur A. K., Guichon R. A., Wolfe Steadman D. L., Cook D. C., Niemann S., Behr M. A., Zumarraga M., Bastida R., Huson D., Nieselt K., Young D., Parkhill J., Buikstra J. E., Gagneux S., Stone A. C., Krause J., Pre-Columbian mycobacterial genomes reveal seals as a source of New World human tuberculosis. Nature 514, 494–497 (2014). [DOI] [PMC free article] [PubMed] [Google Scholar]
- 55.Bouckaert R., Heled J., Kühnert D., Vaughan T., Wu C.-H., Xie D., Suchard M. A., Rambaut A., Drummond A. J., BEAST 2: A software platform for bayesian evolutionary analysis. PLOS Comput. Biol. 10, e1003537 (2014). [DOI] [PMC free article] [PubMed] [Google Scholar]
- 56.Maere S., Heymans K., Kuiper M., BiNGO: A Cytoscape plugin to assess overrepresentation of Gene Ontology categories in biological networks. Bioinformatics 21, 3448–3449 (2005). [DOI] [PubMed] [Google Scholar]
- 57.Lechner M., Findeiß S., Steiner L., Marz M., Stadler P. F., Prohaska S. J., Proteinortho: Detection of (co-)orthologs in large-scale analysis. BMC Bioinformatics 12, 124 (2011). [DOI] [PMC free article] [PubMed] [Google Scholar]
- 58.Ota T., Nei M., Variance and covariances of the numbers of synonymous and nonsynonymous substitutions per site. Mol. Biol. Evol. 11, 613–619 (1994). [DOI] [PubMed] [Google Scholar]
- 59.Pond S. L. K., Frost S. D. W., Muse S. V., HyPhy: Hypothesis testing using phylogenies. Bioinformatics 21, 676–679 (2005). [DOI] [PubMed] [Google Scholar]
- 60.Pennell M. W., Eastman J. M., Slater G. J., Brown J. W., Uyeda J. C., FitzJohn R. G., Alfaro M. E., Harmon L. J., geiger v2.0: An expanded suite of methods for fitting macroevolutionary models to phylogenetic trees. Bioinformatics 30, 2216–2218 (2014). [DOI] [PubMed] [Google Scholar]
- 61.Goris J., Konstantinidis K. T., Klappenbach J. A., Coenye T., Vandamme P., Tiedje J. M., DNA–DNA hybridization values and their relationship to whole-genome sequence similarities. Int. J. Syst. Evol. Microbiol. 57, 81–91 (2007). [DOI] [PubMed] [Google Scholar]
- 62.Kendall S. L., Withers M., Soffair C. N., Moreland N. J., Gurcha S., Sidders B., Frita R., ten Bokum A., Besra G. S., Lott J. S., Stoker N. G., A highly conserved transcriptional repressor controls a large regulon involved in lipid degradation in Mycobacterium smegmatis and Mycobacterium tuberculosis. Mol. Microbiol. 65, 684–699 (2007). [DOI] [PMC free article] [PubMed] [Google Scholar]
- 63.Becq J., Gutierrez M. C., Rosas-Magallanes V., Rauzier J., Gicquel B., Neyrolles O., Deschavanne P., Contribution of horizontally acquired genomic islands to the evolution of the tubercle bacilli. Mol. Biol. Evol. 24, 1861–1871 (2007). [DOI] [PubMed] [Google Scholar]
Associated Data
This section collects any data citations, data availability statements, or supplementary materials included in this article.
Supplementary Materials
Supplementary material for this article is available at http://advances.sciencemag.org/cgi/content/full/5/6/eaaw3307/DC1
Supplementary Text
Fig. S1. Maximum likelihood phylogeny of the MCAN group, including the most likely inferred ancestor of MTBC.
Fig. S2. Phylogenetic incongruence test.
Fig. S3. Recombination fragments ages derived from BEAST.
Table S1. Variants identified as homoplastic and phylogenetically convergent.
Table S2. Potential recombination fragments detected between the MTBC ancestor and MCAN.
Table S3. Results of the phylogenetic comparison of genes having a significant accumulation of divSNPs.
Table S4. Analysis of dN/dS variation between the MTBC ancestor and the MTBC.
Table S5. Codons with strong evidence of being under positive selection as detected by FUBAR.
Table S6. Variants found in the phoR gene.
Table S7. Accession numbers and description of the MTBC strains analyzed.
Table S8. Accession numbers of the mycobacterial genomes used to construct the reference phylogeny.