Figure 1.
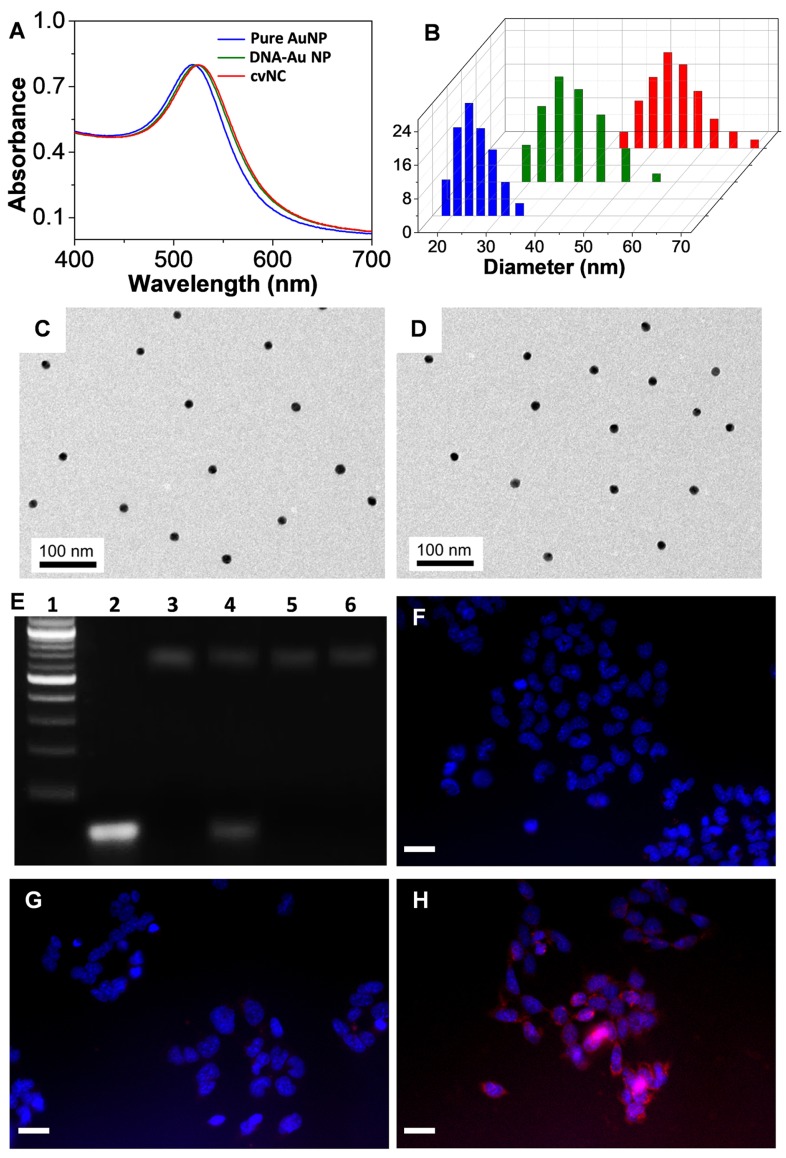
Characterization of cvNCs and evaluation of siSOX9 release. UV-Vis spectra (A) and dynamic light scattering analysis (B) of pure AuNPs (blue), DNA-AuNPs (green), and cvNCs (red). TEM images of pure AuNPs (C) and cvNCs (D). (E) Agarose gel electrophoresis of Marker (Lane 1), siSOX9 (Lane 2), cvNCs (Lane 3), cvNCs with GSH (Lane 4), non-cvNCs (Lane 5), and non-cvNCs with GSH (Lane 6). Fluorescence microscopy images of NSCs untreated (F) and treated with non-cvNCs (G), and cvNCs (H), respectively. Blue: nuclei stained with Hoechst 33342, Red: Cy5-siSOX9. Scale bar: 40 µm.

