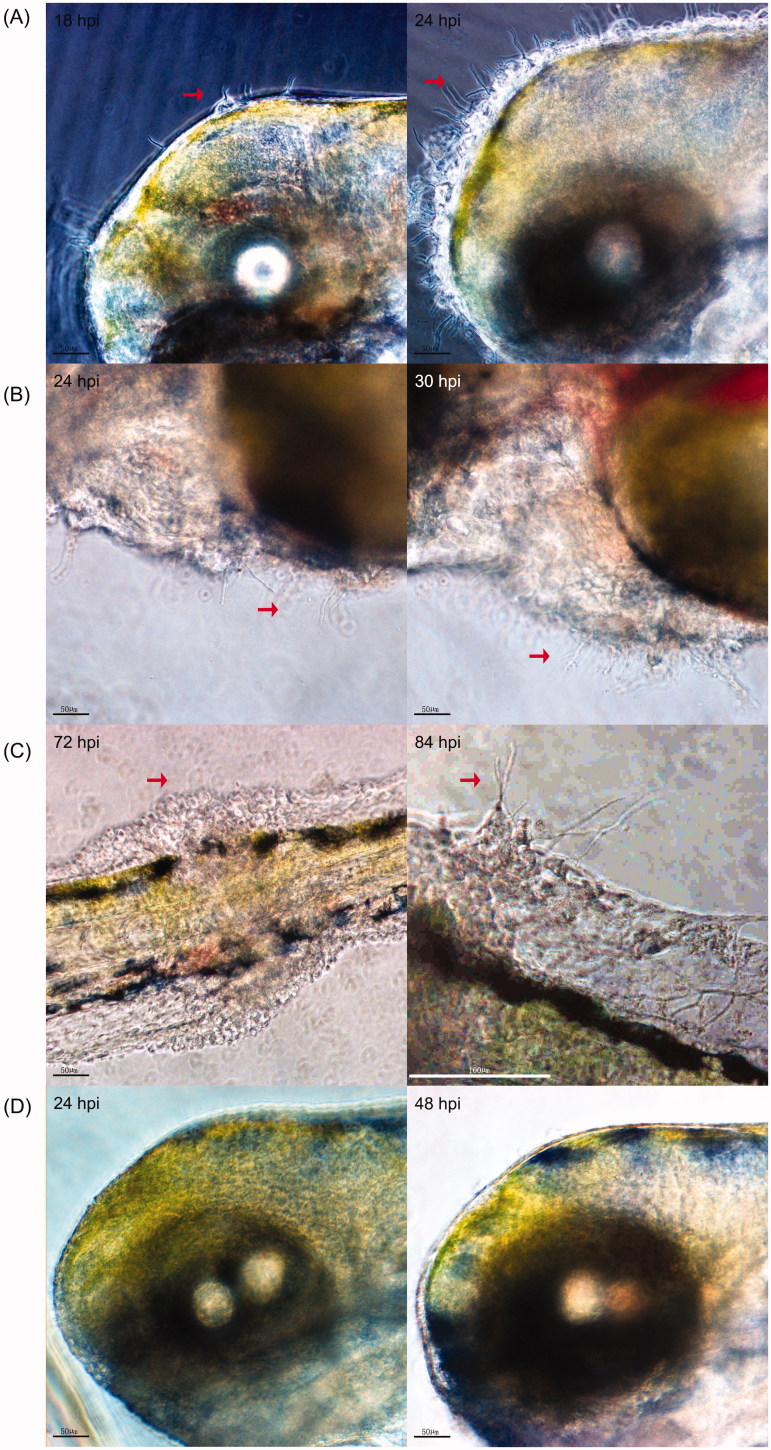
Figure 5.
In vivo visualization of T. marneffei in the infected zebrafish larvae. (A) Hyphae generation of T. marneffei in the hindbrain cavity, (B) heart region and tail (C right) of zebrafish larvae from the SUMS0594 1 × 10⁸ CFU/ml infection group. C left shows the granuloma formation surrounding the tail before hyphal penetration. A/B/C were three different zebrafish larvae. (D) No granular bulge and mycelial growth can be observed on the zebrafish surface in the PBS group. The observation time was marked in the upper left corner of the image. The red arrows indicate the granuloma formation and the extruding fungal hyphae.

