Abstract
Proteins such as albumin, gelatin, casein, transferrin, and collagen are widely used as drug delivery systems. However, only albumin-based paclitaxel (PTX) formulation Abraxane® (PTX-albumin NPs prepared by nab-technology) has been successfully developed for treating metastatic breast cancer clinically due to abundant materials, simple industrial scale-up process, and well tumor-targeting ability. Hemoglobin (Hb) is another protein used for drug delivery with similar advantages. In this study, we successfully synthesized PEG-Hb nanoparticles loading with PTX based on previously well-established acid-denatured method. PEG-Hb-PTX NPs showed enhanced cellular uptake and great cellular inhibition ability in vitro. Moreover, our animal study showed that PEGylated NPs greatly accumulated in tumor tissues and exhibited excellent anticancer activity in vivo. We found that PEG-Hb-PTX NPs possess a better in vivo antitumor effect than the commercially available Taxol® formulation. We believe that PEG-Hb has great potential as an efficient drug delivery system for further clinic study.
Keywords: PEGylated hemoglobin, drug delivery, nanoparticles, antitumor study
1. Introduction
Antitumor drugs are often highly effective at destroying tumor cells but with concomitant side effects and poor target specificity (Cho et al., 2008). Besides, some anticancer drugs, such as paclitaxel (PTX), camptothecin (CPT), and curcumin (CCM), have poor solubility problem because of their hydrophobic nature (Yap et al., 2010). To overcome these problems, advanced drug delivery systems (DDS) are highly needed (Wang et al., 2014; Zhang et al., 2015; Zhu et al., 2015; Wang et al., 2016; Zhao et al., 2019). Among them, protein-based drug carriers have great potential in drug delivery area due to biodegradability, non-immunogenicity, and biocompatibility compared to synthetic polymers (Gong et al., 2011). Many proteins including gelatin, casein, albumin, and collagen have been used as DDS (Lai & Guo, 2011; Papi et al., 2011; Meng et al., 2015). Albumin is an attractive protein carrier and widely used as drug carrier. For example, albumin-based PTX formulation Abraxane® (PTX-albumin NPs prepared by nab-technology) has been successfully developed for treating metastatic breast cancer clinically (Altundag et al., 2006; Elzoghby et al., 2012). Abundant materials, simple industrial scale-up process, and well tumor-targeting ability are the main features for the successful clinical application of PTX-albumin NPs (Abraxane®). Recently, researchers have found that protein hemoglobin (Hb) can also be used as drug carrier. Hb is roughly spherical, with a diameter of nearly 5.5 nm and molecular weight of 64.5 kDa (Ingram et al., 1962). It is a tetrametric protein consisting of two pairs of α and β subunits, and each subunit contains a heme group in its hydrophobic region (Perutz, 1978). Hb is a traffic protein carrying oxygen and carbon dioxide in vivo (Lalezari et al., 1990). In addition, Hb has a high affinity for CD163 after binding with haptoglobin (Meng et al., 2015). All of these advantages make hemoglobin an excellent drug carrier, and several studies have attempted to conjugate drugs with Hb via chemical bonds (Brookes et al., 2006). However, complex synthesis steps caused low drug-loading efficiency. For example, Brookes et al. had developed hemoglobin-ribavirin conjugates for targeting therapy purpose, while only six to eight ribavirin moieties attached per hemoglobin (Brookes et al., 2006; Zhang & Palmer, 2011).
Our group had developed a novel acid denatured method by using Hb as drug carrier to synthesize drug-loaded nanoparticles by non-covalent forces (mainly hydrophobic interaction). However, Hb nanoparticles are not stable in physiological environment (pH 7.4), resulting in bad performance in vivo especially via intravenous injection. Coating the surface of materials with polyethylene glycol (PEG), or “PEGylation,” is a common approach for improving the efficiency of drug delivery in vivo (Veronese & Mero, 2008). In this study, we modified Hb with PEG to improve the nanoparticle stability both in vitro and in vivo. The PEGylated Hb (PEG-Hb) formed nanoparticles loaded with hydrophobic PTX by acid-denatured method. Near-infrared fluorescence imaging showed that PTX-loaded PEG-Hb nanoparticles (PEG-Hb-PTX NPs) had great tumor accumulation ability. We found that PEG-Hb-PTX NPs possess a better in vivo antitumor effect than the commercially available Taxol® formulation.
2. Materials and methods
2.1. Materials
Human Hb (99%) was obtained from Sigma-Aldrich (MO, USA). Carboxylate-functionalized PEG (COOH-PEG, MW 2000) was obtained from Sigma-Aldrich (MO, USA). PTX was obtained from Hongdoushan Co. Ltd. (Jiangsu, China). TaxolTM was obtained from Jiangsu Province Hospital (Nanjing, China). Human breast cancer cell line (MCF-7) was obtained from Shanghai Institute of Cell Biology (Shanghai, China). IR775 iodide was purchased from Sigma-Aldrich (St Louis, MO, USA). Trypsin, penicillin, streptomycin, fetal bovine serum (FBS), and RPMI-1640 medium were obtained from Hyclone (Waltham, USA). All other reagents were from Nanjing Wanqing Chemical Glassware Instrument (Nanjing, China).
2.2. PEGylation and characterization of Hb
The COOH-PEG and Hb solution were mixed and stirred over night with ice bath in the presence of excess N-hydroxysuccinimide (NHS) and 1-ethyl-3-(3-dimethylaminopropyl)-carbodiimide (EDC). The resulting PEG-Hb was isolated by dialyzed in deionized water.
The PEG-Hb was identified by SDS-PAGE analysis (Sun & Palmer, 2008). Hb and PEG-Hb samples were loaded into a 4% stacking gel with a 12% resolving gel and subjected to electrophoresis at 100 V for about 1 h. After that, the gels were stained for 30 min using Coomassie blue dye R250 and washed overnight with bleaching dye (25% ethanol and 8% acetic acid). Finally, the gel was visualized using Tanon 5200 multi-imaging system (Tanon Science & Technology Inc., Shanghai, China).
2.3. Preparation of PTX-loaded PEG-Hb nanoparticles (PEG-Hb-PTX NPs)
PEG-Hb-PTX NPs were prepared via an acid-denaturing method as described previously (Wang, Wang, et al., 2015; Wang, Chen, et al., 2017). Beriefly, 10 mL PEG-Hb (2 mg/mL) solution in distilled water was stirred at a speed of 600 rpm. Then, the pH value of Hb solution was adjusted to 4.0 by 2 M HCl. After 10-min stirring, 2 mg PTX (10 mg/mL, dissolved in ethanol) was added into the protein solution drop by drop to form nanoparticles. Then, the nanoparticle solution was ultrafiltrated (membrane cutoff MW 30 KDa, Millipore) to remove ethanol and unbound PTX. As a control, PTX-loaded Hb nanoparticles (Hb-PTX NPs) were prepared as the same method above. The amount of PTX in both NPs was tested by HPLC. Acetonitrile/water (55/45, v/v) was used as the mobile phase at a flow rate of 1.0 mL per minute.
2.4. Characterization of PEG-Hb-PTX NPs
Particle size was determined by Zeta Plus (Brookhaven, USA). The NPs were also observed under a transmission electron microscope (TEM, EM-200CX, JEOL, Japan). For the stability assay, PEG-Hb-PTX NPs and Hb-PTX NPs were diluted in PBS, respectively. The stability of PEG-Hb-PTX NPs was also tested in fetal blood serum (37 °C). The mean diameter changes of NPs were monitored at time intervals. The release of PTX was performed according to the dialysis method. Briefly, the NPs were put into a dialysis bag (MWCO 3500). Then, the bag was immerged into release medium that consisted of 15 mL of 0.1 M PBS (pH 7.4 and 5.5) and 1% Tween 80 (v/v), and kept at 37 °C. At specified time points, the release medium was withdrawn for HPLC analysis, and equivalent release medium was added.
To study the forming mechanism of PEG-Hb NPs, the exposure of tryptophan residues was detected by monitoring the fluorescence intensity of tryptophan in PEG-Hb using an RF-5301PC fluorescence spectrophotometer (Shimadzu, Japan) at 0.5-nm intervals. Tryptophan emits fluorescence at 300 to 380 nm, under excitation at 280 nm. The hydrophobic dye ANS was used as an indicator of exposure of hydrophobic clusters for its high affinity to PEG-Hb. 40 μM ANS was added to PEG-Hb at pH 4.0, 6.0 and 6.6, respectively. The fluorescence at 400 to 600 nm was recorded after 15 min (when the value was stable) at 0.5-nm intervals, with 380 nm as the excitation wavelength.
2.5. Cytotoxicity
MCF-7 cells (5 × 10³ per well) were seeded into 96-well plates. After incubation for 24 h, the cells were treated with a series of increasing concentrations (0.0001, 0.001, 0.01, 0.1, 1, and 10 μg/mL of PTX) for 24 h. Then, CCK-8 (10 μL) was added to each well in the 96-well plate and incubated for an additional 2 h at 37 °C in a humidified incubator with 5% CO2. Finally, the absorbance was measured at a wavelength of 450 nm. Cell viability was normalized to untreated cells and expressed as the mean ± SD of triplicate samples.
2.6. Cellular uptake in vitro
Coumarin-6 (cou6) is a good fluorescence dye for cell uptake study. Here, cou6 was mixed with PTX (1:100 = cou6: PTX, wt/wt) to prepare cou6 contained PEG-Hb-PTX NPs or Hb-PTX NPs. Briefly, MCF-7 cells (1.0 × 10⁴ per well) were seeded in confocal dishes overnight and cultured for 24 h at 37 °C in a humidified incubator with 5% CO2. Then, the medium was changed to the fresh medium containing free cou6, Hb-PTX NPs and Hb-PTX NPs contained the same concentration of PTX (0.0045 mg/mL) and cou6. After 2-h incubation, the cells were washed two times with PBS and fixed with 4% paraformaldehyde solution for 30 min, and then stained with DAPI for 15 min. Finally, the cells were observed by confocal microscopy with λex/em 346/460 nm for DAPI and λex/em 488/500-550 nm for cou6.
2.7. Imaging, biodistribution, and pharmacokinetic studies in vivo
All animal experiments were conducted in compliance with the Institutional Animal Care and Use Committee of Nanjing University. Pathogen-free 6-week-old male ICR mice were acclimatized for 1 week before establishing tumor model. Then, H22 tumor cells (5.0 × 10⁶ cells per mouse) were inoculated subcutaneously to ICR mice at the right axilla. To visualize the distribution of PEG-Hb-PTX NPs in vivo, IR-775 NIR dye and PTX (1:10, wt/wt) were simultaneously co-encapsulated into NPs via this same method as described in Section 2.3. Then, the NPs with or without PEG (0.3 mg/kg IR775) and free IR-775 (0.3 mg/kg) were intravenously injected to H22 tumor-bearing mice via tail vein. Mice were anesthetized and observed under the IVIS Lumina system (Xenogen Co., Alameda, CA) at 0.5, 1, 3, 18, 24, 48, and 72 h after administration. The excitation wavelength was 745 nm and the exposure time was 2 s. IVIS Living Imaging Software was used for the analysis of the amount of IR775 in tissues.
For the pharmacokinetic study, the ICR mice were divided in two groups (three mice for each time points). The first group received intravenously by the vein of the tail 10 mg/kg of PTX as Taxol. The other group received PEG-Hb-PTX NPs (PTX, 10 mg/kg). Blood samples were collected at 0.25–8 h (0.25, 0.5, 1.0, 1.5, 2.0, 3.0, 4.0 and 8.0 h) after administration, and serum was obtained after centrifugation for 10 min at 10,000 rpm. The concentration of PTX in the serum samples was determined using a standard curve of PTX and measured using HPLC. The pharmacokinetic parameters were calculated by PK Solver Version 2.0 (Zhang et al., 2010).
2.8. Antitumor activity in vivo
H22 tumor cells (5.0 × 10⁶) were engrafted subcutaneously to the right axilla of ICR mice (6 weeks old). When the tumor volume reached ∼100 mm3 (designated as day 0), mice were randomly divided into three groups (n = 6). On day 1, free PTX (Taxol, 10 mg/Kg) and PEG-Hb NPs (10 mg/Kg) were intravenously administered, respectively, while PBS was used as normal control. Treatments were performed twice, on day 1 and day 3. Tumor volume was measured using digital calipers. The volume was calculated as the following formula: tumor volume (mm3) = 0.5 × length × width2. Body weight of the mice was also recorded.
2.9. Statistics
Statistical assessment was conducted by two-sided Student’s t test for two groups and one-way analysis of variance for multiple groups (p < 0.05 was considered statistically significant).
3. Results and discussion
3.1. Preparation and characterization of PEG-Hb-PTX NPs
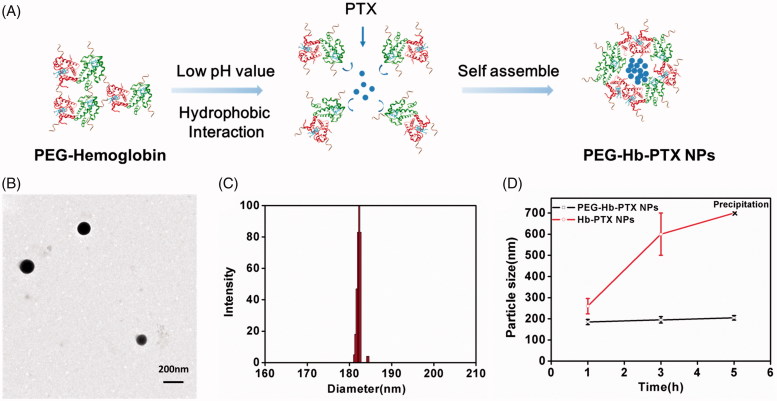
The synthesized PEGylated Hb was detected by SDS-PAGE (Figure S1). We then used one-step acid-denaturing method to encapsulate PTX in Hb NPs (Figure 1(A)). This method takes advantage of the exposure of hydrophobic domains of PEG-Hb under acidic conditions to facilitate hydrophobic interactions with PTX. The TEM image revealed that PEG-Hb-PTX NPs appeared as spherical nanoparticles and showed a homogeneous structure (Figure 1(B)). Hydrodynamic size of the PEG-Hb-PTX NPs was measured by DLS, which was in a narrow distribution and ranged around 180 ∼ 190 nm (Figure 1(C)). The prepared nanoparticles with this size range cannot be easily phagocytized in the blood circulation compared to larger nanoparticles. PEG-Hb-PTX NPs were determined for the cumulative release of encapsulated PTX under different pH value condition (Figure S2). The drug release data showed that PTX encapsulated within PEG-Hb-PTX NPs was released statistically significantly higher at pH 5.5 than pH 7.4. PEGylation was expected to stabilize the NPs in their in vivo application. The stability of the Hb-PTX NPs and PEG-Hb-PTX NPs was investigated by DLS in PBS and fetal blood serum. As demonstrated in Figure 1(D) and Figure S3, the hydrodynamic size of Hb-PTX NPs increased quickly in PBS, which resulted from the aggregation of the NPs. In contrast, the PEG-Hb-PTX NPs had stable particle size during the tested period (Figure 1(D)).
Figure 1.
Assemble and characterization of PEG-Hb-PTX NPs. (A) Preparation of PEG-Hb-PTX NPs using one-step acid-denaturing method. (B) TEM of PEG-Hb-PTX NPs. (C) Size distribution of PEG-Hb-PTX NPs determined by DLS. (D) Changes in particle size of PEG-Hb-PTX NPs at different time points in PBS.
3.2. Mechanism of PEG-Hb NPs formation
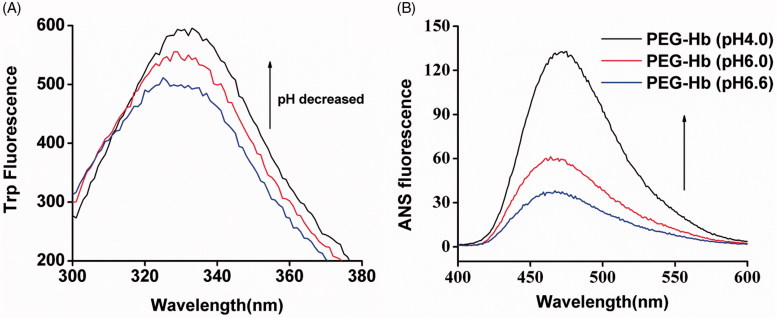
Our previous study showed that hydrophobic interactions play a significant role in the preparation of acid-denaturing Hb NPs (Wang et al., 2015). Hb has a large number of hidden Tryptophan (Trp) residues which are limited to hydrophobic areas in a close proximity to the heme group (Kristinsson, 2002). Trp fluorescence indicates that the exposure of hydrophobic areas is inside of the protein. Under normal physiological conditions, quenching of these residues could take place from surrounding groups and resulting in a limited exposure to the solvent. Here, we test the Trp fluorescence change in PEGylated Hb. As shown in Figure 2(A), while decreasing the pH from 6.6 to 4.0, the fluorescence of Trp was dramatically increased. Because the exposure of hidden Trp residues as the protein is unfolded, the hydrophobic domain inside of the protein is exposed under lower pH. To further confirm the exposure of hydrophobic residues in PEG-Hb, ANS binding assay was used (Gong et al., 2012). The ability of the hydrophobic residues binding the hydrophobic dye ANS was increased at low pH value (pH 4.0), whereas the binding ability decreased when the pH values increased, indicating from the ANS fluorescence intensity in Figure 2(B). Therefore, hydrophobic force may mainly facilitate the formation of PEG-Hb NPs.
Figure 2.
Hydrophobic change of PEG-Hb at acid pH values. (A) Changes in Trp fluorescence in Hb solutions with pH values of 6.6, 6.0, and 4.0. (B) Exposure of hydrophobic domains of Hb at pH 6.6, pH 6.0, and pH 4.0 as assessed by fluorescence emission spectra of ANS bound to PEG-Hb.
3.3. Cytotoxicity and cellular uptake of PEG-Hb-PTX NPs
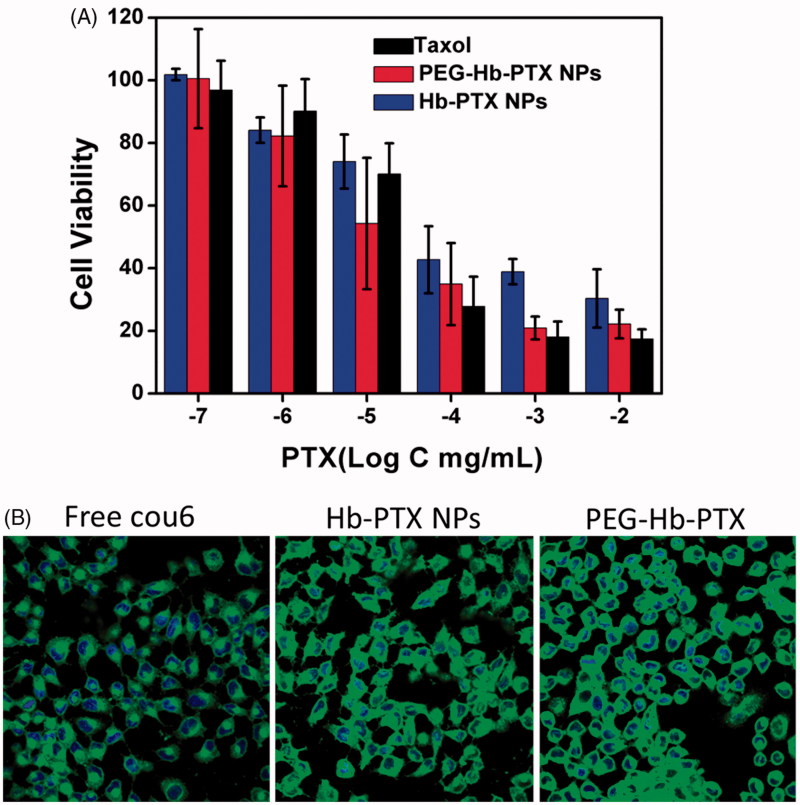
To investigate the cytotoxicity of the NPs with or without PEGylation, the cytotoxicity of the PEG-Hb-PTX NPs was conducted using MCF-7 cells. MCF-7 cells were incubated with TaxolTM, Hb-PTX NPs, and PEG-Hb-PTX NPs at different concentrations (0.0001, 0.001, 0.01, 0.1, 1, and 10 μg/mL) for 24 h. As shown in Figure 3(A), the cell viability of PEG-Hb-PTX NPs was lower than that of Hb-PTX NPs at all detected concentrations. Only when the concentrations of PTX up to 0.1 μg/mL, TaxolTM treatment led to more cell death than PEG-Hb-PTX NPs. This may be due to organic solvent in TaxolTM, while our PEG-Hb-PTX NPs was organic solvent free (Wu et al., 2013).
Figure 3.
Cytotoxicity and cellular uptake of PEG-Hb-PTX NPs in MCF-7 cells. (A) Cell viability of MCF-7 cells incubated with different concentrations of PTX for 24 h. (B) Confocal fluorescence images of MCF-7 cells incubated with free cou-6, Hb-PTX NPs, and PEG-Hb-PTX NPs for 2 h.
To further investigate the details of improving cell killing of PEG-Hb-PTX NPs, we compared the cellular uptake of the PEGylated and non-PEGylated NPs. Cou6, a hydrophobic dye, was simultaneously encapsulated with PTX (1: 100) into PEG-Hb NPs to fluorescently label the NPs. The cellular uptake was evaluated by co-culturing the NPs with MCF-7 cells and imaged using confocal laser microscope. As shown in Figure 3(B), cou6 delivered by PEG-Hb NPs exhibited the most efficient cytoplasmic translocation than free dye and even Hb NPs. These results also explained the improved anticancer cell activity indicated in Figure 3(A). The excellent stability of PEGylated NPs should contribute to the higher cellular uptake and cytotoxicity (Figure 1(D)).
3.4. In vivo imaging of NPs
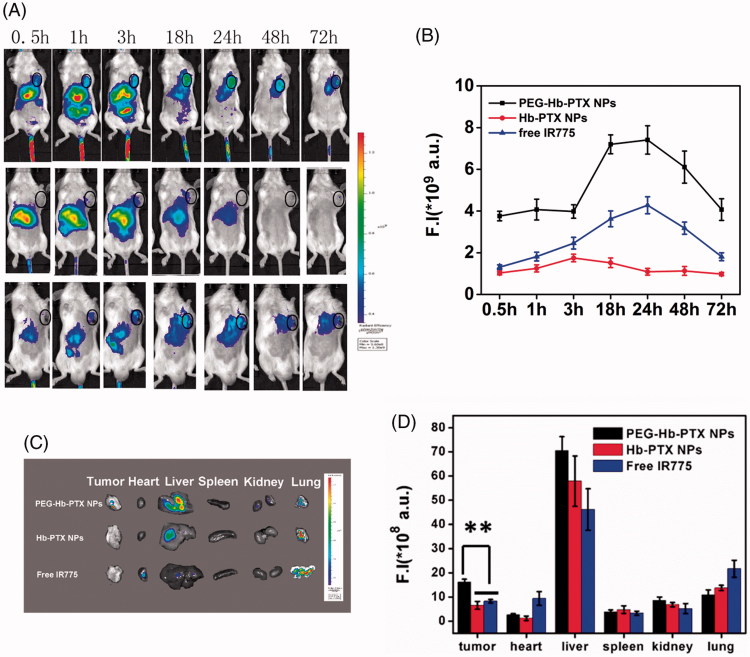
To evaluate whether PEGylated Hb NPs could improve drug delivery to distant tumors via intravenous injection, we conducted in vivo imaging and biodistribution study. IR775 was co-encapsulated into NPs to evaluate biodistribution and estimate tumor accumulation in mice bearing subcutaneous H22 tumors. As shown in Figure 4(A), most of the fluorescence signal of IR775 concentrated in the liver within 3 h after injection. After 1-h post-injection, a strong signal was detected in the tumor area with PEG-Hb-IR775 NPs and the tumor signal reached a peak after 24-h post-injection (Figure 4(A)). Quantification of fluorescent signals in the tumor area confirmed tumor accumulation of PEG-Hb-IR775 NPs (Figure 4(B)). We also detected the distribution of IR775 in tumor and major organs from the ex vivo images after 72-h injection (Figure 4(C–D)). From both of the image and the quantification of fluorescent signals, most of the IR775 accumulated in livers. The accumulation of PEG-Hb-IR775 NPs in tumor tissue was much higher than Hb-IR775 NPs and free IR775. These results indicated that the PEGylated Hb NPs could effectively accumulate in tumor tissues and ensured successful anticancer therapy in vivo.
Figure 4.
In vivo fluorescence imaging and biodistribution of free IR775, Hb-IR775, and PEG-Hb-IR775 NPs in H22 tumor-bearing mice. (A) NIR fluorescence imaging after intravenous injection of PEG-Hb-IR775 NPs, Hb-IR775 NPs, and free IR775 (tumors indicated by black circle). The colors indicated that the fluorescence intensity in the picture increased from blue to red. (B) Fluorescence intensity (F.I) of IR775 in the tumors of three groups. (C) Ex vivo fluorescence images of tumors and major organs after administration at 72 h. (D) Semiquantitative assessment of biodistribution of IR775 after injection. **p < 0.01.
To further analyze the efficiency of PTX delivered by the PEG-Hb NPs, we conducted a pharmacokinetic study. Plasma PTX concentration–time profile was shown in Figure S4. And a summary of the pharmacokinetic variables for PTX administered as both PEG-Hb-PTX NPs and Taxol is presented in Table S1. The results showed that the blood circulation half-life of PEG-Hb-PTX NPs was significantly prolonged compared to Taxol (1.06 vs. 0.39 h). The pharmacokinetic results showed PEGylation strategy for hemoglobin is viable for delivering PTX in vivo.
3.5. Anticancer activity of PEG-Hb-PTX NPs in vivo
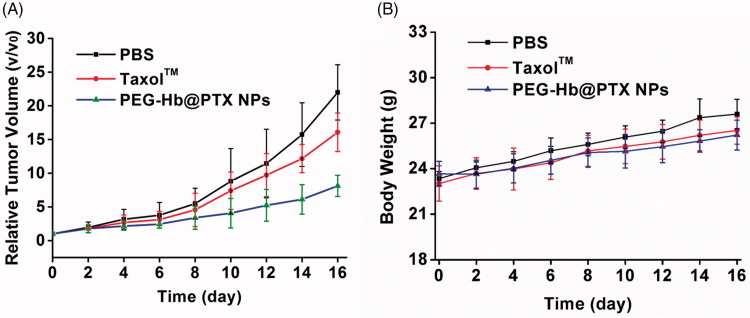
The ability of the PEG-Hb-PTX NPs to inhibit the growth of tumor was evaluated in H22-transplanted tumor-bearing mice. When the tumor volume reached ∼100 mm3, the treatments were initiated. As shown in Figure 5(A), TaxolTM showed great antitumor efficacy compared with that of the PBS group, agreed with the clinical data. However, the PEG-Hb-PTX NPs group exhibited better antitumor ability compared with that in PBS group and even in TaxolTM group. In the present study, the body weight changes were analyzed as an indicator for treatment-induced toxicity. All the mouse groups showed slightly increased body weights. The animals treated with PEG-Hb-PTX NPs did not show significant weight loss over the treatment period (Figure 5(B)).
Figure 5.
Anticancer therapy after intravenous injection of PEG-Hb-PTX-NPs in H22 tumor-bearing mice. (A) Tumor volume measured at different time points after intravenous injection of PBS, TaxolTM, and Tf-PTX-NPs. (B) Body weight changes over the treatment period.
4. Conclusion
In this study, we have successfully synthesized PEG-Hb and prepared PTX-loaded NPs with PEG-Hb by acid-denatured method. Due to the improving stability of PEG-Hb NPs, the PEG-Hb-PTX NPs exhibited enhanced cellular uptake and anticancer cell activity. PEGylated NPs could accumulate more in tumor tissues and exhibited excellent anticancer activity. The PEG-Hb NPs is a promising drug delivery system to improve the therapeutic efficacy of anticancer drugs such as PTX and offers great potential in translational applications in anticancer treatments.
Supplementary Material
Funding Statement
This work was supported by the China Postdoctoral Science Foundation (No. 2016M601923) and by the China National Science Foundation (No. 31671026). Dr Tianqing Liu is supported by the National Health and Medical Research Council (NHMRC) Early Career Fellowship (Grant No. 1112258).
Disclosure statement
No potential conflict of interest was reported by the authors.
References
- Altundag K, Dede DS, Purnak T (2006). Albumin-bound paclitaxel (ABI-007; Abraxane) in the management of basal-like breast carcinoma. J Clin Pathol 60:958. [DOI] [PMC free article] [PubMed] [Google Scholar]
- Brookes S, Biessels P, Ng NFL, et al. (2006). Synthesis and characterization of a hemoglobin-ribavirin conjugate for targeted drug delivery. Bioconjugate Chem 17:530–7. [DOI] [PubMed] [Google Scholar]
- Cho K, Wang X, Nie S, et al. (2008). Therapeutic nanoparticles for drug delivery in cancer. Clin Cancer Res 14:1310–6. [DOI] [PubMed] [Google Scholar]
- Elzoghby AO, Samy WM, Elgindy NA (2012). Protein-based nanocarriers as promising drug and gene delivery systems. J Control Release 161:38–49. [DOI] [PubMed] [Google Scholar]
- Gong G, Xu Y, Zhou Y, et al. (2012). Molecular switch for the assembly of lipophilic drug incorporated plasma protein nanoparticles and in vivo image. Biomacromolecules 13:23–8. [DOI] [PubMed] [Google Scholar]
- Gong G, Zhi F, Wang K, et al. (2011). Fabrication of a nanocarrier system through self-assembly of plasma protein and its tumor targeting. Nanotechnology 22:295603. [DOI] [PubMed] [Google Scholar]
- Ingram VM, Richards DW, Fishman AP (1962). Hemoglobin: molecular structure and function, biosynthesis, evolution and genetics. Science 138:996–1000. [DOI] [PubMed] [Google Scholar]
- Kristinsson HG. (2002). Acid-induced unfolding of flounder hemoglobin: evidence for a molten globular state with enhanced pro-oxidative activity. J Agric Food Chem 50:7669–76. [DOI] [PubMed] [Google Scholar]
- Lai LF, Guo HX (2011). Preparation of new 5-fluorouracil-loaded zein nanoparticles for liver targeting. Int J Pharm 404:317–23. [DOI] [PubMed] [Google Scholar]
- Lalezari I, Lalezari P, Poyart C, et al. (1990). New effectors of human hemoglobin: structure and function. Biochemistry 29:1515–23. [DOI] [PubMed] [Google Scholar]
- Meng Z, Yang X, Hu D, et al. (2015). Replacing heme with paclitaxel to prepare drug-loaded globin nanoassembles for CD163 targeting. J Pharm Sci 104:1045–55. [DOI] [PubMed] [Google Scholar]
- Papi M, Palmieri V, Maulucci G, et al. (2011). Controlled self assembly of collagen nanoparticle. J Nanopart Res 13:6141–7. [Google Scholar]
- Perutz MF. (1978). Hemoglobin structure and respiratory transport. Sci Am 239:92–125. [DOI] [PubMed] [Google Scholar]
- Sun G, Palmer AF (2008). Preparation of ultrapure bovine and human hemoglobin by anion exchange chromatography. J Chromatogr B Analyt Technol Biomed Life Sci 867:1–7. [DOI] [PMC free article] [PubMed] [Google Scholar]
- Veronese FM, Mero A (2008). The impact of PEGylation on biological therapies. BioDrugs 22:315–29. [DOI] [PubMed] [Google Scholar]
- Wang F, Chen L, Zhang R, et al. (2014). RGD peptide conjugated liposomal drug delivery system for enhance therapeutic efficacy in treating bone metastasis from prostate cancer. J Control Release 196:222–33. [DOI] [PubMed] [Google Scholar]
- Wang K, Chen G, Hu Q, et al. (2017). Self-assembled hemoglobin nanoparticles for improved oral photosensitizer delivery and oral photothermal therapy in vivo. Nanomedicine (Lond) 12:1043–55. [DOI] [PubMed] [Google Scholar]
- Wang K, Wang J, Hu W, et al. (2015). Acid denaturation inducing self-assembly of curcumin-loaded hemoglobin nanoparticles. Materials 8:8701–13. [DOI] [PMC free article] [PubMed] [Google Scholar]
- Wang K, Yuan A, Yu J, et al. (2016). One-step self-assembling method to prepare dual-functional transferrin nanoparticles for antitumor drug delivery. J Pharm Sci 105:1269–76. [DOI] [PubMed] [Google Scholar]
- Wu J, Song C, Jiang C, et al. (2013). Nucleolin targeting AS1411 modified protein nanoparticle for antitumor drugs delivery. Mol Pharmaceutics 10:3555–63. [DOI] [PubMed] [Google Scholar]
- Yap TA, Sandhu SK, Workman P, et al. (2010). Envisioning the future of early anticancer drug development. Nat Rev Cancer 10:514–23. [DOI] [PubMed] [Google Scholar]
- Zhang L, Liu F, Li G, et al. (2015). Twin-arginine translocation peptide conjugated epirubicin-loaded nanoparticles for enhanced tumor penetrating and targeting. J Pharm Sci 104:4185–96. [DOI] [PubMed] [Google Scholar]
- Zhang N, Palmer AF (2011). Development of a dichloroacetic acid-hemoglobin conjugate as a potential targeted anti-cancer therapeutic. Biotechnol Bioeng 108:1413–20. [DOI] [PubMed] [Google Scholar]
- Zhang Y, Huo M, Zhou J, et al. (2010). PKSolver: an add-in program for pharmacokinetic and pharmacodynamic data analysis in Microsoft Excel. Comput Methods Programs Biomed 99:306–14. [DOI] [PubMed] [Google Scholar]
- Zhao Y, Zhao W, Lim YC, et al. (2019). Salinomycin-loaded gold nanoparticles for treating cancer stem cells by ferroptosis-induced cell death. Mol Pharm 16:2532–9. [DOI] [PubMed] [Google Scholar]
- Zhu H, Zhang SYu, Ling Y, et al. (2015). pH-responsive hybrid quantum dots for targeting hypoxic tumor siRNA delivery. J Control Release 220:529–44. [DOI] [PubMed] [Google Scholar]
Associated Data
This section collects any data citations, data availability statements, or supplementary materials included in this article.


