

ABSTRACT
Disruption of physiological ageing of the placenta is associated with obstetric complications. Altered lipid metabolism is a known trigger of tissue ageing, but the effect of maternal dyslipidemia on placental ageing is not clearly understood. We examined the relationship between maternal dyslipidemia and placental age acceleration (PAA), an epigenetic ageing measure derived from the difference between DNA methylation age and chronological gestational age. We also assessed whether the association varies by maternal pre-pregnancy obesity status and fetal sex. Placental data were obtained as part of the NICHD Fetal Growth Studies that involved participants from four race/ethnic groups. Placental DNA methylation age was estimated using 62 CpGs that have previously been found to have high placental age prediction accuracy. We used multivariable linear regression to test associations between maternal dyslipidemia during early gestation (i.e., high-density lipoprotein cholesterol (HDLc), low-density lipoprotein cholesterol (LDLc), total cholesterol (TChol), and triglycerides) and PAA adjusting for fetal sex and socio-demographic factors. Among normal-weight women, low HDLc, compared to high HDLc, was associated with 0.82 (95% CI: 0.00, 1.64) weeks higher PAA. Among women with female neonates, low HDLc, compared to high HDLc, was associated with 1.20 (95% CI: 0.17, 2.24) weeks higher PAA. High TChol was associated with 1.28 (95% CI: 0.12, 2.45) weeks higher PAA among Whites. In all, the study found that maternal dyslipidemia due to low HDLc was associated with accelerated epigenetic ageing of the placenta among mothers with normal pre-pregnancy weight and a female fetus.
KEYWORDS: Dyslipidemia, DNA methylation age, epigenetic clock, placental age acceleration, obesity, offspring sex
Introduction
The placenta, a specialized tissue formed during pregnancy to support endocrine and maternal-fetal nutrient transport functions, grows rapidly throughout gestation and matures within the limited time in a physiologic phenomenon known as placental ageing [1]. Timely ageing of the placenta corresponding with gestational age complements optimal fetal growth and development; however, premature placental ageing is associated with adverse obstetric complications such as preeclampsia, low birth weight, and preterm birth [2]. Histopathologic placental calcification and placental trophoblast telomere shortening contributing to premature placenta ageing were linked to offspring fetal growth restriction and low-birth weight [1,2]. Emerging evidence suggests that dysregulation of maternal and placental lipid metabolism is involved in in-utero environment perturbation and may lead to pregnancy complications and adverse perinatal outcomes via epigenetic changes [3,4]. However, currently, there is a paucity of information about the relationship between maternal dyslipidemia in early pregnancy and placental ageing phenotypes. Recent studies have demonstrated that the biological age of a tissue, known as ‘DNA methylation age’, can be estimated with high accuracy using epigenetic markers [5,6]. A placenta-specific epigenetic age predictor has been developed using 62 CpGs in placental DNA. Placental age acceleration (PAA), the difference between DNA methylation-based placental age and the actual chronological age, has been found to be associated with adverse pregnancy outcomes [7].
Dyslipidemia and altered lipid metabolism are linked with ageing [8]. Cumulating studies reveal that disruption of lipid homeostasis is an important driver of cellular senescence, which in turn triggers accelerated tissue ageing induced by oxidative stress, DNA damage, and epigenomic alteration [9–11]. Low-density lipoprotein cholesterol (LDLc) has been found to increase with ageing in adults, whereas high-density lipoprotein cholesterol (HDLc) decreases with ageing [12,13]. During oxidative stress, lipoproteins which are integral parts of the cell membrane are considered to be the first target to be oxidized by reactive oxygen species (ROS), and the process leads to highly damaging lipid peroxidation products and DNA/mitochondrial DNA damage [14]. Dysregulation of lipids augments ageing through the effects of lipid peroxidation on DNA damage and oxidative stress [15]. A recent study has also found that epigenetic ageing in the blood is positively associated with circulating blood levels of triglycerides and the metabolic syndrome [16].
Maternal pre-pregnancy dyslipidemia is associated with adverse pregnancy outcomes [17,18]. Maternal cholesterol contributes to 20% of fetal cholesterol through placental transportation [19,20], and when elevated influences lipid storage by the placental [21–23] that may alter physiological ageing of the placenta. Furthermore, the effect of maternal dyslipidemia on placental lipid storage may vary based on maternal obesity status [8,24] and fetal sex [21–23,25].
Given the increasing obesogenic environment in the US, more pregnant women are confronted with cardiometabolic risk. Despite some data on the role of lipids on ageing, the effects of maternal dyslipidemia during pregnancy on placental epigenetic ageing are unknown. In the present study, using the NICHD Fetal Growth – Singletons sub-cohort, we estimated placental DNA methylation age using 62 CpGs previously known to predict placental epigenetic age with high accuracy [7] and defined each sample’s placental age acceleration (PAA) as the difference between DNA methylation age and chronological gestational age of the placentas. We investigated the association between maternal dyslipidemia (low HDLc, high LDLc, high total cholesterol (TChol) and high triglyceride levels in early gestation) and PAA. We also examined whether associations between dyslipidemia and PAA vary by mother’s pre-pregnancy obesity status and fetal sex.
Results
Participant characteristics (n = 262) are presented in Table 1. The race/ethnic profiles of the 262 pregnant women were 67 Whites, 63 Blacks, 89 Hispanics, and 48 Asians. The mean (s.d.) pre-pregnancy BMI was 23.4 (2.9) kg/m2, and the mean (s.d.) gestational age at the time of blood collection for lipid profiling was 12.7 (0.9) weeks gestation. There was no significant difference in the proportion of male and female fetuses. The mean (s.d.) placental DNA methylation age and PAA were 38.07 (1.52) weeks and -1.39 (1.79) weeks, respectively. The percentages of pregnant women with low HDLc, high LDLc, high triglycerides, and high TChol at enrolment were 14.5%, 46.6%, 19.9%, and 29.4%, respectively.
Table 1.
Characteristics of study participants.
| Characteristics | n = 262 |
|---|---|
| Gestational age (weeks) at first visit, mean (s.d.) | 12.72 (0.93) |
| Gestational age (weeks) at delivery, mean (s.d.) | 39.46 (1.13) |
| Placental DNA methylation age, weeks, mean (s.d.) | 38.07 (1.53) |
| Placental Age Acceleration, weeks, mean (s.d.) | −1.39 (1.79) |
| Offspring female sex n (%) | 131 (50.0) |
| Maternal age, years | 27.54 (5.24) |
| Pre-pregnancy BMI, kg/m2, mean (s.d.) | 23.3 (2.90) |
| Normal BMI (<25), n(%) | 185 (70.88) |
| Overweight or obese (≥25), n (%) | 76 (29.12) |
| Race/ethnic group, n (%) | |
| White | 65 (24.81) |
| Black | 61 (23.28) |
| Hispanic | 88 (33.59) |
| Asian | 48 (18.32) |
| High school or less education, n (%) | 798(29.77) |
| Married or living with partner, n (%) | 195 (74.71) |
| Employed/Student, n (%) | 182 (69.47) |
| Private health insurance, n (%) | 161 (61.45) |
| Preeclampsia-Yes, n (%) | 7 (2.67) |
| High-density lipoprotein cholesterol (HDLc), n (%) | |
| Low HDLc (<50 mg/dl) | 38 (14.50) |
| Low-density lipoprotein cholesterol (LDLc), n (%) | |
| High LDLc (≥100 mg/dl) | 122 (46.56) |
| Triglycerides, n (%) | |
| High triglycerides (≥150 mg/dl) | 52 (19.85) |
| Total cholesterol (TChol), n (%) | |
| High TChol (≥200 mg/dl) | 77 (29.39) |
Among normal-weight women, low HDLc was associated with 0.82 (95% CI: 0.00, 1.64, p = 0.04) weeks higher PAA compared to normal HDLc (p-interaction = 0.11). Among women with female neonates, low HDLc was associated with 1.20 (95% CI: 0.17, 2.24, p = 0.02) weeks higher PAA compared to normal HDLc (p-interaction = 0.12). High TChol was associated with 1.28 (95% CI: 0.12, 2.45, p = 0.03) weeks higher PAA compared to normal TChol among Whites (Table 2). Low HDLc was significantly associated with increased odds of positive placental age acceleration among normal-weight women (Odds Ratio (OR):3.16 [95% CI: 1.14, 8.79], p = 0.02) and female gestations (OR: 6.68 [95% CI: 1.56, 28.53], p = 0.01) (Figure 1).
Table 2.
Association between maternal dyslipidemia and placental epigenetic age acceleration.
| Prepregnancy BMIb |
Offspring sexc |
|||||||||
|---|---|---|---|---|---|---|---|---|---|---|
| Overalla |
Normal weight |
Overweight or Obese |
Male |
Female |
||||||
| Lipids | β (95% CI) | P | β (95% CI) | P | β (95% CI) | P | β (95% CI) | P | β (95% CI) | P |
| Normal HDLc Low HDLc |
Reference 0.41 (-0.27, 1.08) |
0.23 | Reference 0.82 (0.00, 1.64) |
0.04 | Reference -0.32 (-1.62, 0.98) |
0.63 | Reference -0.31 (-1.22, 0.59) |
0.50 | Reference 1.20 (0.17, 2.24) |
0.02 |
| Normal LDLc High LDLc |
Reference 0.05 (-0.41, 0.51) |
0.84 | Reference 0.03 (-0.53, 0.59) |
0.91 | Reference 0.40 (-0.52, 1.31) |
0.39 | Reference -0.21 (-0.84, 0.43) |
0.52 | Reference 0.22 (-0.47, 0.90) |
0.53 |
| Normal triglycerides High triglycerides |
Reference -0.37 (-1.02, 0.28) |
0.27 | Reference -0.48 (-1.27, 0.31) |
0.24 | Reference -0.16 (-1.44, 1.12) |
0.81 | Reference 0.16 (-0.69, 1.02) |
0.71 | Reference -0.83 (-1.83, 0.16) |
0.10 |
| Normal TChol High TChold |
Reference 0.07 (-0.42, 0.57) |
0.78 | Reference -0.09 (-0.73, 0.55) |
0.79 | Reference 0.85 (-0.07, 1.76) |
0.07 | Reference 0.03 (-0.67, 0.73) |
0.93 | Reference -0.001 (-0.74, 0.73) |
1.00 |
aModel included HDLc, LDLc, triglycerides, race/ethnic group, pre-pregnancy obesity status, offspring sex, education, marital status, health insurance, employment, age, gestational age during blood sample collection, preeclampsia status;
bModel included HDLc, LDLc, triglycerides, race/ethnic group, offspring sex, education, marital status, health insurance, employment, age, gestational age during blood sample collection, preeclampsia status;
cModel included HDLc, LDLc, triglycerides, race/ethnic group, pre-pregnancy obesity status, education, marital status, health insurance, employment, age, gestational age during blood sample collection, preeclampsia status;
dModels for TChol included all covariates except HDLc, LDLc, and triglycerides;
HDLc, High-density lipoprotein cholesterol; LDLc, Low-density lipoprotein cholesterol; TChol, Total cholesterol.
Figure 1.
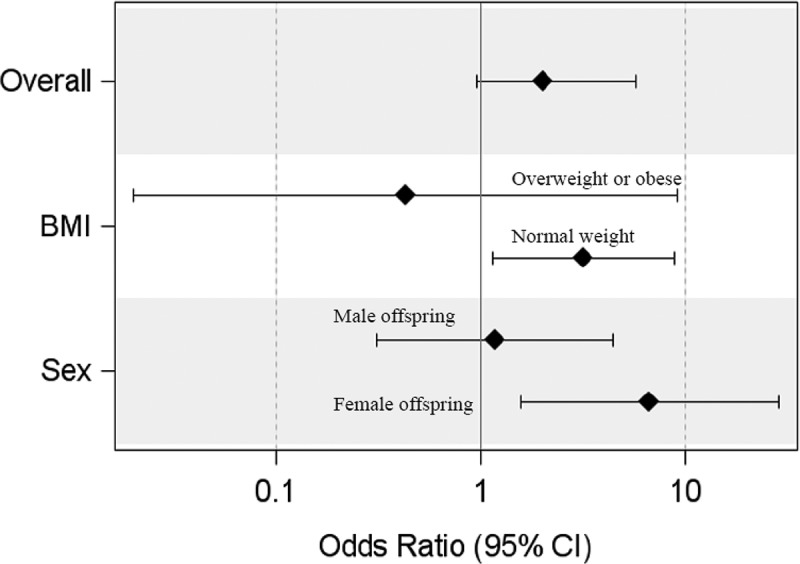
Odds of positive placental age acceleration among women with low HDLc compared to women with normal HDLc. Comparisons were made among all participants (overall), among women with pre-pregnancy normal weight and overweight/obese (BMI), and among gestations with male and female fetuses (sex).
When stratified by race/ethnic groups, among normal-weight women, low HDLc, compared to normal HDLc, was significantly associated with 2.56 (95% CI: 0.20, 4.91, p = 0.03) weeks, and 1.50 (95% CI: 0.13, 2.88, p = 0.03) weeks higher PAA among Asians and Hispanics, respectively (Table 3). Furthermore, among women with female neonates, low HDLc, compared to normal HDLc, was significantly associated with 3.03 (95% CI: 0.11, 5.96, p = 0.04) weeks higher PAA among Blacks (Table 3). Although statistical significance reached only for Blacks, there was a consistent pattern of sexual dimorphism in the relationship between dyslipidemia due to low HDLc on the PAA for all race/ethnic groups.
Table 3.
Association between maternal dyslipidemia and placental epigenetic age acceleration in four race/ethnic groups.
| Whites, n = 67 |
Blacks, n = 63 |
Hispanics, n = 89 |
Asians, n = 48 |
|||||||
|---|---|---|---|---|---|---|---|---|---|---|
| Lipids | β (95% CI) | P | β (95% CI) | P | β (95% CI) | P | β (95% CI) | P | ||
| High-density lipoprotein cholesterol | ||||||||||
| Normal | Reference | Reference | Reference | Reference | ||||||
| Low | Overalla | −0.18 (-1.88, 1.52) | 0.84 | 0.28 (-1.49, 2.04) | 0.75 | 0.70 (-0.38, 1.79) | 0.20 | 2.80 (0.76, 4.84) | 0.01 | |
| Normal weightb | 0.25 (-1.89, 2.38) | 0.81 | 0.03 (-3.59, 3.64) | 0.99 | 1.50 (0.13, 2.88) | 0.03 | 2.56 (0.20, 4.91) | 0.03 | ||
| Overweight or Obese b | -1.73 (-6.76, 3.29) | 0.43 | 0.66 (-2.20, 3.53) | 0.62 | -1.02 (-3.46, 1.43) | 0.39 | NA | 0.03 | ||
| Malec | −1.25 (-4.84, 2.34) | 0.47 | −0.32 (-2.72, 2.07) | 0.78 | −0.06 (-1.31, 1.19) | 0.93 | −1.23 (-5.95, 3.49) | 0.59 | ||
| Femalec | 0.96 (-1.51, 3.43) | 0.43 | 3.03 (0.11, 5.96) | 0.04 | 1.54 (-0.40, 3.47) | 0.12 | 4.90 (-0.31, 10.11) | 0.06 | ||
| Low-density lipoprotein cholesterol | ||||||||||
| Normal | Reference | Reference | Reference | Reference | ||||||
| High | Overalla | 0.90 (-0.14, 1.93) | 0.09 | −0.19 (-1.24, 0.85) | 0.71 | −0.26 (-1.18, 0.65) | 0.57 | 0.13 (-0.95, 1.20) | 0.81 | |
| Normal weightb | 0.44 (-0.82, 1.70) | 0.48 | −0.49 (-2.35, 1.37) | 0.59` | −0.18 (-1.35, 0.99) | 0.76 | 0.21 (-1.01, 1.42) | 0.73 | ||
| Overweight or Obese b | 1.41 (-1.28, 4.09) | 0.25 | 0.24 (-1.87, 2.36) | 0.81 | -0.41 (-2.54, 1.71) | 0.68 | NA | 0.73 | ||
| Malec | −0.58 (-2.52, 1.37) | 0.54 | −1.08 (-2.86, 0.70) | 0.22 | −0.52 (-1.71, 0.67) | 0.38 | −0.84 (-2.65, 0.97) | 0.34 | ||
| Femalec | 0.58 (-1.02, 2.19) | 0.46 | -0.67 (-2.11, 0.77) | 0.34 | -0.09 (-1.56, 1.38) | 0.90 | 0.19 (-2.23, 2.62) | 0.86 | ||
| Triglycerides | ||||||||||
| Normal | Reference | Reference | Reference | Reference | ||||||
| High | Overalla | −0.97 (-2.57, 0.63) | 0.23 | −0.88 (-3.14, 1.39) | 0.44 | −0.22 (-1.48, 1.04) | 0.73 | 0.09 (-1.14, 1.33) | 0.88 | |
| Normal weightb | −1.34 (-4.06, 1.37) | 0.32 0.33 |
−0.97 (-4.58, 2.65) | 0.59 | −0.49 (-1.98, 0.99)) | 0.51 | 0.12 (-1.24, 1.48) | 0.86 | ||
| Overweight or Obese b | -1.37 (-4.53, 1.80) | 0.33 | -0.01 (-4.28, 4.26) | 1.00 | -0.05 (-2.85, 2.76) | 0.97 | NA | 0.86 | ||
| Malec | −3.23 (-6.67, 0.21) | 0.06 | 0.62 (-2.10, 3.34) | 0.64 | 0.60 (-0.90, 2.10) | 0.42 | 1.17 (-0.72, 3.07) | 0.21 | ||
| Malec | −3.23 (-6.67, 0.21) | 0.06 | 0.62 (-2.10, 3.34) | 0.64 | 0.60 (-0.90, 2.10) | 0.42 | 1.17 (-0.72, 3.07) | 0.21 | ||
| Total Cholesterold | ||||||||||
| Normal | Reference | Reference | Reference | Reference | ||||||
| High | Overalla | 1.28 (0.12, 2.45) | 0.03 | −0.15 (-1.18, 0.88) | 0.77 | −0.10 (-1.10, 0.89) | 0.83 | −0.16 (-1.36, 1.03) | 0.78 | |
| Normal weightb | 0.87 (-0.63, 2.38) | 0.25 | −0.52 (-2.36, 1.33) | 0.57 0.44 |
−0.61 (-1.85, 0.63) | 0.33 | −0.07 (-1.39, 1.25) | 0.92 | ||
| Overweight or Obese b | -0.32 (-2.11, 1.47) | 0.71 | 0.64 (-1.08, 2.36) | 0.44 | 1.79 (-0.08, 3.66) | 0.06 | NA | 0.92 | ||
| Malec | 1.43 (-0.89, 3.75) | 0.21 | −1.05 (-2.49, 0.39) | 0.14 | 0.64 (-0.68, 1.97) | 0.33 | 0.005 (-1.64, 1.65) | 1.00 | ||
| Femalec | 0.98 (-0.46, 2.43) | 0.17 | -0.32 (-2.11, 1.47) | 0.71 | -0.55 (-2.02, 0.91) | 0.45 | -0.84 (-3.55, 1.88) | 0.51 | ||
aModel included HDLc, LDLc, triglycerides, race/ethnic group, pre-pregnancy obesity status, offspring sex, education, marital status, health insurance, employment, age, gestational age during blood sample collection, preeclampsia status;
bModel included HDLc, LDLc, triglycerides, race/ethnic group, offspring sex, education, marital status, health insurance, employment, age, gestational age during blood sample collection, preeclampsia status;
cModel included HDLc, LDLc, triglycerides, race/ethnic group, pre-pregnancy obesity status, education, marital status, health insurance, employment, age, gestational age during blood sample collection, preeclampsia status;
dModels for TChol included all covariates except HDLc, LDLc, and triglycerides;
Whites: 48 normal weight and 19 overweight or obese; Blacks: 38 normal weight and 24 overweight or obese; Hispanics: 61 normal weight and 28 overweight or obese; Asians: 42 normal weight and 6 overweight or obese; NA, model was not run because there was only one Asian who was overweight or obese.
Discussion
To our knowledge, this is the first study to investigate the effect of maternal dyslipidemia on epigenetic ageing of the placenta. The findings revealed that the relationships between dyslipidemia and placental ageing may vary by maternal obesity status and fetal sex. Specifically, low HDLc in early pregnancy was associated with accelerated ageing of the placenta among women who had normal pre-pregnancy BMI. We also found that low HDLc in early pregnancy was associated with accelerated ageing of the placenta among gestations of female fetuses. High TChol was associated with increased PAA among Whites only.
We found that low HDLc among normal-weight women was associated with nearly one-week higher epigenetic age of the placenta than its chronological gestational age. In general, plasma HDLc particles exert potent antiatherogenic and anti-inflammatory activities, including antioxidative activity, which endows them with the capacity to protect LDLc against oxidative stress [26,27]. A study in mice models has demonstrated that the placenta may reduce the amounts of cholesterol transported to the fetus when maternal HDLc cholesterol was reduced [28]. Low serum HDLc concentration is strongly correlated with the enhanced status of inflammation and oxidative stress [29], which may propagate epigenetic ageing of the placenta [30]. Our observation that the relationship between low HDLc and PAA was specific to normal weight pre-pregnancy BMI is intriguing. Previous studies found that lean mothers may have low adipose lipoprotein lipase (LPL) [31], an important factor that modulates fatty acid placental transfer [32]. Reduced placental LPL activity contributes to the decreased transfer of lipids to the fetus and leads to increased placental fat storage [31,32], which may trigger lipid peroxidation and cellular ageing. Increased ROS due to oxidative stress increases lipid and protein oxidation creating highly damaging lipid peroxidation that leads to altered placental function [1,22,33]. Our finding is also consistent with studies that found that placentas from normal weight women were more mature than those from obese women [34] as well as DNA methylation and gene expression differences [35–37]. Future studies with larger samples are needed to evaluate whether PAA mediates previously observed associations between low HDLc and birth size [28,38,39].
Our findings also showed that there was a tendency for sexual dimorphism in the relationship between maternal HDLc and PAA, in which the PAA-inducing effect of HDLc was observed only among female gestations. In humans, it was postulated that male fetuses demand more fatty acids than female fetuses [25]. In a rabbit model, sexual dimorphism has been demonstrated in placental response to maternal high fat diet [22]. Placental lipid storage was higher among females than males, whereas fetal dyslipidemia was higher among male than female fetuses, suggesting a physiological adaptation in which the placentas of female fetuses store more lipids during dyslipidemia to protect female fetuses from dyslipidemia [22]. Genes related to programmed cell death are upregulated, and genes associated with cell proliferation are downregulated in female placentas [40]. Greater sensitivity of female gestations to the maternal environment would lead to modest growth changes and provides a survival advantage in in-utero environments with dyslipidemia [25,41,42]. Together, increased placental lipid storage and down-regulation of cell proliferative genes may be the mechanisms that trigger PAA in female gestations with maternal dyslipidemia.
Placental ageing is a complex process that depends upon an individual’s intrinsic factors (genetics, epigenetics, inflammation and comorbidities, change in sex steroids, oxidative stress) and extrinsic environmental factors such as diets, physical activity, and socio-demography that may vary by race/ethnic differences [2,16,35,43–45]. Consistent with this complex scenario, we observed that the relationships of HDLc and TChol with PAA may vary by race/ethnicity. Among normal-weight women, significant associations were found in Hispanics and Asians, and among female gestations, significant associations were found in Blacks. Similarly, TChol was significantly associated with PAA only among Whites.
Cumulative evidence showed that lipogenesis pathways are strongly related to metabolic morbidities, and offspring of high-risk pregnant women are subject to a higher risk of abnormal birth outcomes and atherosclerosis in adulthood [32,46,47]. Although the implication of pre-pregnancy dyslipidemia and lipid metabolism in pregnancy is well established in animal and human studies [3,48,49], there are no pregnancy-specific diagnostic criteria for dyslipidemia. A recent study observed that NCEP III used in V Brazilian Directive guidelines predicted fetus abnormality affecting pregnant women better than the percentiles approach [50]. Our findings may warrant a need for acknowledging the need for pregnancy-specific screening standards for dyslipidemia [51]. Notable, however, the lipid profiles of the pregnant women were measured during the early first trimester, hence would substantially reflect their lipid status pre-pregnancy, justifying the use of the NCEP III criteria in our study.
Our study has some limitations. First, lipids were measured only in early gestation; however, maternal blood lipid levels may increase over the course of pregnancy [18]. Second, DNA methylation and gene expression profile of the placenta has been shown to vary during pregnancy [25]. Therefore, there may be a potentially complex relationship between longitudinal changes in maternal lipids, placental DNA methylation levels and PAA during across gestation that is beyond the scope of our study. The consequences of faster placental ageing due to maternal dyslipidemia on pregnancy complications such as preeclampsia have not been assessed because the number of cases in the cohort is too small. The study has important strengths including the inclusion of women from diverse race/ethnic groups. Moreover, the accuracy of gestational age was expected to be high because the NICHD Fetal Growth Studies implemented a standardized ultrasound protocol with established quality control [52].
In conclusion, our study showed that in lean mothers and in female fetus gestations, maternal dyslipidemia due to low HDLc was associated with accelerated epigenetic ageing of the placenta. Given the evidence for associations of premature ageing of the placenta with early-onset preeclampsia [7], low birth weight, stillbirth, and preterm birth [2], our findings suggest that interventions that control dyslipidemia in early pregnancy may support normal ageing of the placenta and healthy pregnancy.
Materials and methods
Study population and design
We used a sub-cohort of the Eunice Kennedy Shriver National Institute of Child Health and Human Development (NICHD) Fetal Growth Studies-Singletons cohort (n = 2809) that involved pregnant women who provided placenta samples at delivery (n = 312). Women were recruited from 12 participating clinical sites in the US enrolled from July 2009-Jan 2013 from four self-identified race/ethnic groups- Non-Hispanic White (hereafter referred to as White), Non-Hispanic Black (Black), Hispanic, or Asian/Pacific Islander (Asian). Details of the study can be found in previous reports [53–55]. Gestational age was determined using the date of the last menstrual period and confirmed by ultrasound between 8 and 13 weeks gestation [53]. The study was approved by institutional review boards at NICHD and each of the participating clinical sites.
Placenta sample collection and DNA methylation quantification
Placental parenchymal biopsies measuring 0.5 cm x 0.5 cm x 0.5 cm were obtained from placenta samples within 1 h of delivery. Samples were placed in RNALater, frozen for molecular analysis, and then genomic DNA was extracted from the biopsies. As per the manufacturer’s protocols (Illumina Inc., San Diego, CA), about 500 ng was used to profile methylation using HumanMethylation450 Bead Chip. DNA methylation data were processed using Genome Studio, which calculates the fractional methylation (average beta values calculated by taking the ratio of two methylated and unmethylated fluorescent signals) at each queried CpG, after background correction, normalization to internal control probes, and quantile normalization [54]. Normalization was performed using the Beta MIxture Quantile dilation (BMIQ) method described by Teschendorf et al. [56] and modified by Horvath [11]. The method was corrected for the probe design bias in the Illumina Infinium HumanMethylation450 BeadChip and achieved between-sample normalization [11,56]. After BMIQ normalization, missing CpGs were imputed by the k-nearest neighbours method setting k= 10. After removing participants with gender and sample ID mismatch (n = 11), 301 mothers with placenta sample were included in subsequent analyses. Our samples had a high probability of prediction for placental tissue when tested using Horvath’s method [11] implemented in glmnet R function [57].
DNA methylation age prediction
We used 62 CpGs known to predict placental DNA methylation age with high accuracy [7] to determine the DNA methylation age of the placentas. The mean methylation beta-values of the 62 CpGs were regressed by gestational age using an elastic net regression model implemented in glmnet in R [58] to estimate DNA methylation age of the placentas. Placental age acceleration (PAA) was calculated as the difference between DNA methylation age and chronological gestational age of the placentas.
Maternal lipid profiles
TChol, HDLc, LDLc, and triglyceride levels were measured using plasma isolated from blood samples collected at enrollment and stored in -80°F freezers [59]. TChol, HDLc and triglycerides were directly measured using the Roche COBAS 6000 chemistry analyzer (Roche 111 Diagnostics, Indianapolis, IN). LDLc was calculated using the Friedewald formula [60]. We used the third National cholesterol education program (NCEP III) criteria to categorize HDLc as normal HDLc (>50 mg/dl) or low HDLc (≤50 mg/dl), LDLc as normal LDLc (<100 mg/dl) or high LDLc (≥100 mg/dl), triglycerides as normal triglycerides (<150 mg/dl) or high triglycerides (≥150 mg/dl), and TChol as normal TChol (<200 mg/dl) or high TChol (≥200 mg/dl) [61]. Out of the 301 samples that passed DNA methylation quality control, 262 that had lipid profiles were included in subsequent analysis.
Statistical analysis
We tested for associations between maternal dyslipidemia status (low HDLc compared to normal HDLc, high LDLc compared to normal LDLc, high triglycerides compared to normal triglycerides) and PAA using multivariable linear regression models that incorporated the three lipids, offspring sex, maternal race/ethnic group, education, pre-pregnancy BMI, health insurance, marital status, employment, gestational age at time of blood collection for lipid profiling, and preeclampsia status. Associations between TChol and PAA were tested adjusting for the above covariates except for HDLc, LDLc, and triglycerides. Further analyses were performed by stratifying by maternal pre-pregnancy BMI status (normal weight: <25 kg/m2, overweight/obese: ≥25 kg/m2) and offspring sex. Logistic regression was used to test for associations between dyslipidemia and odds of positive age acceleration (i.e., PAA >0 compared with PAA≤0). Analyses were conducted using SAS 9.4 (SAS Institute, Cary NC). P-value < 0.05 was used as evidence for statistical significance.
Funding Statement
This research was supported by the Intramural Research Program of the Eunice Kennedy Shriver National Institute of Child Health and Human Development, National Institutes of Health including American Recovery and Reinvestment Act funding via contract numbers HHSN275200800013C; HHSN275200800002I; HHSN27500006; HHSN275200800003IC; HHSN275200800014C; HHSN275200800012C; HHSN275200800028C; HHSN275201000009C and HHSN27500008. Additional support was obtained from the NIH Office of the Director, the National Institute on Minority Health and Health Disparities and the National Institute of Diabetes and Digestive and Kidney Diseases.
Acknowledgments
The authors wish to thank research teams at all participating clinical centres (which include Christina Care Health Systems, Columbia University, Northwestern University, University of Alabama at Birmingham, University of California-Irvine, Medical University of South Carolina, Fountain Valley Hospital, California, Long Beach Memorial Medical Center, New York Hospital, Queens, Saint Peters University Hospital, Tufts University, and Women and Infants Hospital of Rhode Island). This work utilized the computational resources of the NIH HPC Biowulf cluster (http://hpc.nih.gov).
Disclosure statement
No potential conflict of interest was reported by the authors.
Author Contributions
F.T.-A. conceived the research idea; F.T.-A. and D.S. designed the analysis; D.S. performed statistical analyses and wrote the draft manuscript. All authors contributed to interpretation of the results, provided critical intellectual content, and approved the final manuscript.
References
- [1].Sultana Z, Maiti K, Aitken J, et al. Oxidative stress, placental ageing-related pathologies and adverse pregnancy outcomes. Am J Reprod Immunol. 2017. May;77(5). PubMed PMID: 28240397 DOI: 10.1111/aji.12653. [DOI] [PubMed] [Google Scholar]
- [2].Polettini J, Dutta EH, Behnia F, et al. Aging of intrauterine tissues in spontaneous preterm birth and preterm premature rupture of the membranes: A systematic review of the literature. Placenta. 2015. September;36(9):969–973. PubMed PMID: 26004735. [DOI] [PubMed] [Google Scholar]
- [3].Nasioudis D, Doulaveris G, Kanninen TT.. Dyslipidemia in pregnancy and maternal-fetal outcome. Minerva Ginecol. 2019. April;71(2):155–162. PubMed PMID: 30318877. [DOI] [PubMed] [Google Scholar]
- [4].Jin WY, Lin SL, Hou RL, et al. Associations between maternal lipid profile and pregnancy complications and perinatal outcomes: a population-based study from China. BMC Pregnancy Childbirth. 2016. March 21;16:60 PubMed PMID: 27000102; PubMed Central PMCID: PMCPMC4802610. [DOI] [PMC free article] [PubMed] [Google Scholar]
- [5].Horvath S. DNA methylation age of human tissues and cell types. Genome Biol. 2013;14(10):R115 PubMed PMID: 24138928; PubMed Central PMCID: PMCPMC4015143. [DOI] [PMC free article] [PubMed] [Google Scholar]
- [6].Horvath S, Raj K. DNA methylation-based biomarkers and the epigenetic clock theory of ageing. Nat Rev Genet. 2018. June;19(6):371–384. PubMed PMID: 29643443. [DOI] [PubMed] [Google Scholar]
- [7].Mayne BT, Leemaqz SY, Smith AK, et al. Accelerated placental aging in early onset preeclampsia pregnancies identified by DNA methylation. Epigenomics. 2017. March;9(3):279–289. PubMed PMID: 27894195; PubMed Central PMCID: PMCPMC6040051. [DOI] [PMC free article] [PubMed] [Google Scholar]
- [8].Ericsson S, Eriksson M, Vitols S, et al. Influence of age on the metabolism of plasma low density lipoproteins in healthy males. J Clin Invest. 1991. February;87(2):591–596. PubMed PMID: 1991842; PubMed Central PMCID: PMCPMC296347. [DOI] [PMC free article] [PubMed] [Google Scholar]
- [9].Rodier F, Campisi J. Four faces of cellular senescence. J Cell Biol. 2011;jcb:201009094. [DOI] [PMC free article] [PubMed] [Google Scholar]
- [10].Van Deursen JM. The role of senescent cells in ageing. Nature. 2014;509(7501):439. [DOI] [PMC free article] [PubMed] [Google Scholar]
- [11].Horvath S. DNA methylation age of human tissues and cell types. Genome Biol. 2013;14(10):3156. [DOI] [PMC free article] [PubMed] [Google Scholar]
- [12].Walter M. Interrelationships among HDL metabolism, aging, and atherosclerosis. Arterioscl Throm Vas. 2009. September;29(9):1244–1250. PubMed PMID: WOS:000269098200002; English. [DOI] [PubMed] [Google Scholar]
- [13].Davidson MH, Maki KC, Karp SK, et al. Management of hypercholesterolaemia in postmenopausal women. Drugs Aging. 2002;19(3):169–178. PubMed PMID: 12027776. [DOI] [PubMed] [Google Scholar]
- [14].Ademowo OS, Dias HKI, Burton DGA, et al. Lipid (per) oxidation in mitochondria: an emerging target in the ageing process? Biogerontology. 2017. December;18(6):859–879. PubMed PMID: 28540446; PubMed Central PMCID: PMCPMC5684309. [DOI] [PMC free article] [PubMed] [Google Scholar]
- [15].Flor AC, Wolfgeher D, Wu D, et al. A signature of enhanced lipid metabolism, lipid peroxidation and aldehyde stress in therapy-induced senescence. Cell Death Discov. 2017;3:17075 PubMed PMID: 29090099; PubMed Central PMCID: PMCPMC5661608. [DOI] [PMC free article] [PubMed] [Google Scholar]
- [16].Quach A, Levine ME, Tanaka T, et al. Epigenetic clock analysis of diet, exercise, education, and lifestyle factors. Aging (Albany NY). 2017. February 14;9(2):419–446. PubMed PMID: 28198702; PubMed Central PMCID: PMCPMC5361673. [DOI] [PMC free article] [PubMed] [Google Scholar]
- [17].Vrijkotte TG, Krukziener N, Hutten BA, et al. Maternal lipid profile during early pregnancy and pregnancy complications and outcomes: the ABCD study. J Clin Endocrinol Metab. 2012. November;97(11):3917–3925. PubMed PMID: 22933545. [DOI] [PubMed] [Google Scholar]
- [18].Bartels A, O’Donoghue K. Cholesterol in pregnancy: a review of knowns and unknowns. Obstet Med. 2011. December 4;4:147–151. PubMed PMID: WOS:000219598900004; English. [DOI] [PMC free article] [PubMed] [Google Scholar]
- [19].Woollett LA. Review: transport of maternal cholesterol to the fetal circulation. Placenta. 2011. March;32(Suppl 2):S218–21. PubMed PMID: 21300403; PubMed Central PMCID: PMCPMC4699659. [DOI] [PMC free article] [PubMed] [Google Scholar]
- [20].Woollett LA. Maternal cholesterol in fetal development: transport of cholesterol from the maternal to the fetal circulation. Am J Clin Nutr. 2005. December;82(6):1155–1161. PubMed PMID: 16332646. [DOI] [PubMed] [Google Scholar]
- [21].Montoudis A, Simoneau L, Brissette L, et al. Impact of a cholesterol enriched diet on maternal and fetal plasma lipids and fetal deposition in pregnant rabbits. Life Sci. 1999;64(26):2439–2450. PubMed PMID: 10403503. [DOI] [PubMed] [Google Scholar]
- [22].Tarrade A, Rousseau-Ralliard D, Aubriere MC, et al. Sexual dimorphism of the feto-placental phenotype in response to a high fat and control maternal diets in a rabbit model. PLoS One. 2013;8(12):e83458 PubMed PMID: 24386205; PubMed Central PMCID: PMCPMC3873307. [DOI] [PMC free article] [PubMed] [Google Scholar]
- [23].Picone O, Laigre P, Fortun-Lamothe L, et al. Hyperlipidic hypercholesterolemic diet in prepubertal rabbits affects gene expression in the embryo, restricts fetal growth and increases offspring susceptibility to obesity. Theriogenology. 2011. January 15;75(2):287–299. PubMed PMID: 21040967. [DOI] [PubMed] [Google Scholar]
- [24].Maury E, Brichard SM. Adipokine dysregulation, adipose tissue inflammation and metabolic syndrome. Mol Cell Endocrinol. 2010. January 15;314(1):1–16. PubMed PMID: 19682539. [DOI] [PubMed] [Google Scholar]
- [25].Tarrade A, Panchenko P, Junien C, et al. Placental contribution to nutritional programming of health and diseases: epigenetics and sexual dimorphism. J Exp Biol. 2015. January 1;218(Pt 1):50–58. PubMed PMID: 25568451. [DOI] [PubMed] [Google Scholar]
- [26].Proudfoot JM, Barden AE, Loke WM, et al. HDL is the major lipoprotein carrier of plasma F2-isoprostanes. J Lipid Res. 2009. April;50(4):716–722. PubMed PMID: 19050315; PubMed Central PMCID: PMCPMC2656665. [DOI] [PMC free article] [PubMed] [Google Scholar]
- [27].Proudfoot JM, Barden AE, Croft KD, et al. F2-Isoprostanes in HDL are bound to neutral lipids and phospholipids. Free Radic Res. 2016. December;50(12):1374–1385. PubMed PMID: 27750456. [DOI] [PubMed] [Google Scholar]
- [28].McConihay JA, Honkomp AM, Granholm NA, et al. Maternal high density lipoproteins affect fetal mass and extra-embryonic fetal tissue sterol metabolism in the mouse. J Lipid Res. 2000. March;41(3):424–432. PubMed PMID: 10706590. [PubMed] [Google Scholar]
- [29].Ahmad WNHW, Sakri F, Mokhsin A, et al. Low serum high density lipoprotein cholesterol concentration is an independent predictor for enhanced inflammation and endothelial activation. Plos One. 2015. January 23;10(1). UNSP e0116867 PubMed PMID: WOS:000349122100047; English. [DOI] [PMC free article] [PubMed] [Google Scholar]
- [30].Urdinguio RG, Rodriguez-Rodero S, Fernandez AF, et al. Epigenetics, inflammation, and aging. inflammation, advancing age and nutrition: research and clinical interventions. 1st; 2014. 85–101. PubMed PMID: WOS:000331932900009; English DOI: 10.1016/B978-0-12-397803-5.00008-3 [DOI] [Google Scholar]
- [31].Wang H, Eckel RH. Lipoprotein lipase: from gene to obesity. Am J Physiol Endocrinol Metab. 2009. August;297(2):E271–88. PubMed PMID: 19318514. [DOI] [PubMed] [Google Scholar]
- [32].Herrera E, Ortega-Senovilla H. Lipid metabolism during pregnancy and its implications for fetal growth. Curr Pharm Biotechnol. 2014;15(1):24–31. PubMed PMID: 24720597. [DOI] [PubMed] [Google Scholar]
- [33].Bonomini F, Rodella LF, Rezzani R. Metabolic syndrome, aging and involvement of oxidative stress. Aging Dis. 2015. March;6(2):109–120. PubMed PMID: 25821639; PubMed Central PMCID: PMCPMC4365955. [DOI] [PMC free article] [PubMed] [Google Scholar]
- [34].Huang L, Liu J, Feng L, et al. Maternal prepregnancy obesity is associated with higher risk of placental pathological lesions. Placenta. 2014. August;35(8):563–569. PubMed PMID: 24930988. [DOI] [PubMed] [Google Scholar]
- [35].Yang L, Cartier J, Drake A, et al. DNA methylation differs between lean and obese placenta and is influenced by maternal environment and fetal sex. Endocrine Abstracts. 2017;50:P328. [Google Scholar]
- [36].Myatt L, Maloyan A. Obesity and Placental Function. Semin Reprod Med. 2016. January;34(1):42–49. PubMed PMID: WOS:000369033700008; English. [DOI] [PubMed] [Google Scholar]
- [37].Mitsuya K, Parker AN, Liu L, et al. Alterations in the placental methylome with maternal obesity and evidence for metabolic regulation. PLoS One. 2017;12(10):e0186115 PubMed PMID: 29045485; PubMed Central PMCID: PMCPMC5646778. eng. [DOI] [PMC free article] [PubMed] [Google Scholar]
- [38].Kramer MS, Kahn SR, Dahhou M, et al. Maternal lipids and small for gestational age birth at term. J Pediatr. 2013. October;163(4):983–988. PubMed PMID: 23810722. [DOI] [PubMed] [Google Scholar]
- [39].Ye K, Bo QL, Du QJ, et al. Maternal serum lipid levels during late pregnancy and neonatal body size. Asia Pac J Clin Nutr. 2015;24(1):138–143. PubMed PMID: 25740752. [DOI] [PubMed] [Google Scholar]
- [40].Cox LA, Li C, Glenn JP, et al. Expression of the placental transcriptome in maternal nutrient reduction in baboons is dependent on fetal sex. J Nutr. 2013. November;143(11):1698–1708. PubMed PMID: 24047701; PubMed Central PMCID: PMCPMC3796342. [DOI] [PMC free article] [PubMed] [Google Scholar]
- [41].Martin E, Smeester L, Bommarito PA, et al. Sexual epigenetic dimorphism in the human placenta: implications for susceptibility during the prenatal period. Epigenomics. 2017. March;9(3):267–278. PubMed PMID: 28234023; PubMed Central PMCID: PMCPMC5331919. [DOI] [PMC free article] [PubMed] [Google Scholar]
- [42].Baserga M, Kaur R, Hale MA, et al. Fetal growth restriction alters transcription factor binding and epigenetic mechanisms of renal 11beta-hydroxysteroid dehydrogenase type 2 in a sex-specific manner. Am J Physiol Regul Integr Comp Physiol. 2010. July;299(1):R334–42. PubMed PMID: 20427719; PubMed Central PMCID: PMCPMC2904157. [DOI] [PMC free article] [PubMed] [Google Scholar]
- [43].Krueger PM, Reither EN. Mind the gap: race/ethnic and socioeconomic disparities in obesity. Curr Diab Rep. 2015. November;15(11):95 PubMed PMID: 26377742; PubMed Central PMCID: PMCPMC4947380. [DOI] [PMC free article] [PubMed] [Google Scholar]
- [44].Chen Y, Huang L, Zhang H, et al. Racial disparity in placental pathology in the collaborative perinatal project. Int J Clin Exp Pathol. 2015;8(11):15042–15054. PubMed PMID: 26823843; PubMed Central PMCID: PMCPMC4713629. [PMC free article] [PubMed] [Google Scholar]
- [45].Horvath S, Gurven M, Levine ME, et al. An epigenetic clock analysis of race/ethnicity, sex, and coronary heart disease. Genome Biol. 2016. August 11;17(1):171 PubMed PMID: 27511193; PubMed Central PMCID: PMCPMC4980791. [DOI] [PMC free article] [PubMed] [Google Scholar]
- [46].Herrera E. Lipid metabolism in pregnancy and its consequences in the fetus and newborn. Endocrine. 2002. October;19(1):43–55. PubMed PMID: 12583601. [DOI] [PubMed] [Google Scholar]
- [47].Herrera E, Ortega-Senovilla H. Disturbances in lipid metabolism in diabetic pregnancy - Are these the cause of the problem? Best Pract Res Clin Endocrinol Metab. 2010. August;24(4):515–525. PubMed PMID: 20832733. [DOI] [PubMed] [Google Scholar]
- [48].Jiang S, Jiang J, Xu H, et al. Maternal dyslipidemia during pregnancy may increase the risk of preterm birth: A meta-analysis. Taiwan J Obstet Gynecol. 2017. February;56(1):9–15. PubMed PMID: 28254234. [DOI] [PubMed] [Google Scholar]
- [49].de Araujo EV, Guimaraes K, Magnani M, et al. Maternal dyslipidemia during pregnancy and lactation increases blood pressure and disrupts cardiorespiratory and glucose hemostasis in the female rat offspring. Appl Physiol Nutr Metab. 2019. January 16; PubMed PMID: 30649894 DOI: 10.1139/apnm-2018-0756. [DOI] [PubMed] [Google Scholar]
- [50].Feitosa ACR, Barreto LT, Silva IMD, et al. Impact of the use of different diagnostic criteria in the prevalence of dyslipidemia in pregnant women. Arq Bras Cardiol. 2017. July;109(1):30–38. PubMed PMID: 28591252; PubMed Central PMCID: PMCPMC5524473. [DOI] [PMC free article] [PubMed] [Google Scholar]
- [51].Barrett HL, Dekker Nitert M, McIntyre HD, et al. Normalizing metabolism in diabetic pregnancy: is it time to target lipids? Diabetes Care. 2014. May;37(5):1484–1493. PubMed PMID: 24757231. [DOI] [PubMed] [Google Scholar]
- [52].Hediger ML, Fuchs KM, Grantz KL, et al. Ultrasound quality assurance for singletons in the national institute of child health and human development fetal growth studies. J Ultrasound Med. 2016. August;35(8):1725–1733. PubMed PMID: 27353072; PubMed Central PMCID: PMCPMC6309992. [DOI] [PMC free article] [PubMed] [Google Scholar]
- [53].Buck Louis GM, Grewal J, Albert PS, et al. Racial/ethnic standards for fetal growth: the NICHD fetal growth studies. Am J Obstet Gynecol. 2015. October;213(4):449 e1–449 e41. PubMed PMID: 26410205; PubMed Central PMCID: PMCPMC4584427. [DOI] [PMC free article] [PubMed] [Google Scholar]
- [54].Delahaye F, Do C, Kong Y, et al. Genetic variants influence on the placenta regulatory landscape. Plos Genet. 2018. November;14(11):e1007785 PubMed PMID: 30452450; PubMed Central PMCID: PMCPMC6277118. [DOI] [PMC free article] [PubMed] [Google Scholar]
- [55].Grewal J, Grantz KL, Zhang C, et al. Cohort profile: NICHD fetal growth studies-singletons and twins. Int J Epidemiol. 2018. February 1;47(1):25–25l. PubMed PMID: 29025016; PubMed Central PMCID: PMCPMC5837516. [DOI] [PMC free article] [PubMed] [Google Scholar]
- [56].Teschendorff AE, Marabita F, Lechner M, et al. A beta-mixture quantile normalization method for correcting probe design bias in Illumina Infinium 450 k DNA methylation data. Bioinformatics. 2012;29(2):189–196. [DOI] [PMC free article] [PubMed] [Google Scholar]
- [57].Friedman J, Hastie T, Tibshirani R. Regularization paths for generalized linear models via coordinate descent. J Stat Softw. 2010;33(1):1. [PMC free article] [PubMed] [Google Scholar]
- [58].Yuan GX, Ho CH, Lin CJ. An Improved GLMNET for L1-regularized Logistic Regression. J Mach Learn Res. 2012. June;13:1999–2030. PubMed PMID: WOS:000307020700010; English. [Google Scholar]
- [59].Bao W, Dar S, Zhu Y, et al. Plasma concentrations of lipids during pregnancy and the risk of gestational diabetes mellitus: A longitudinal study. J Diabetes. 2018. June;10(6):487–495. PubMed PMID: 28436169; PubMed Central PMCID: PMCPMC5837900. [DOI] [PMC free article] [PubMed] [Google Scholar]
- [60].Friedewald WT, Levy RI, Fredrickson DS. Estimation of the concentration of low-density lipoprotein cholesterol in plasma, without use of the preparative ultracentrifuge. Clin Chem. 1972. June;18(6):499–502. PubMed PMID: 4337382. [PubMed] [Google Scholar]
- [61].Rodriguez-Ortiz D, Reyes-Perez A, Leon P, et al. Assessment of two different diagnostic guidelines criteria (National Cholesterol Education Adult Treatment Panel III [ATP III] and International Diabetes Federation [IDF]) for the evaluation of metabolic syndrome remission in a longitudinal cohort of patients undergoing Roux-en-Y gastric bypass. Surgery. 2016. April;159(4):1121–1128. PubMed PMID: 26747228. [DOI] [PubMed] [Google Scholar]