

ABSTRACT
Sensory neurons of the peripheral nervous system are critical in health and disease. Sensory neurons derived from induced pluripotent stem (iPS) cells are now being used increasingly for in vitro models of neuropathy, pain, and neurotoxicity. DNA methylation is critical for neurodevelopment and has been implicated in many neuronal diseases, but has not been examined in iPS-derived sensory neurons. In order to better characterize the iPS-derived sensory neuron model, we have undertaken a genome-wide DNA methylation study on the cells from human iPS to iPS-derived sensory neurons during differentiation through reduced representation and bisulfite sequencing. We report decreasing DNA methylation with iPS-derived sensory neuronal differentiation that is reflected in increasing numbers and proportions of hypomethylated individual CpGs and regions, as well as lowered DNMT3b expression. Furthermore, genes with changes in DNA methylation near their TSS suggest key pathways that may be involved in iPS-derived sensory neuronal differentiation. These findings provide insights into sensory neuronal differentiation and can be used for further in vitro modelling of disease states.
KEYWORDS: DNA methylation, iPSC, sensory neuron, differentiation
Introduction
Transduction of somatosensory signals begins with the peripheral sensory neurons, whose cell body resides within the dorsal root ganglia (DRG), which are of neural crest origin. Disorders of the peripheral sensory nerves commonly present as polyneuropathy, and arise due to many aetiologies (e.g. diabetes mellitus, neurotoxic chemotherapy, Charcot Marie Tooth disease) that cause significant morbidity [1]. In most cases, treatment of polyneuropathy is focused on symptomatic pain management and does not treat the underlying pathology of the peripheral nerves. A deeper understanding of sensory neuronal biology will be required in order to develop strategies to preserve neuronal function under a variety of conditions.
In order to study sensory neurons, we have employed human-induced pluripotent stem cell (iPSC) technology [2,3]. This approach carries unique advantages, including: 1) the ability to utilize human biology and genetics, 2) providing sensory neuronal development insights, 3) the opportunity to develop iPSC lines from specific patients who may have genetic disorders or susceptibilities to disease. The use of human iPSC-derived sensory neurons has been employed to study several genetic disorders and neurotoxicology conditions [4,5].
DNA methylation is an important epigenetic regulator of gene expression both during development and in the adult nervous system [6]. It is mediated by three main DNA methylation genes, DNMT1, DNMT3a and DNMT3b. Each of the genes is associated with significant genetic disorders of development and neurons in humans. DNA methylation patterns have not been investigated in human iPSC-derived sensory neurons. This study describes the DNA methylation patterns in human iPSCs and during their differentiation to neural crest sensory neuronal phenotype, which provides novel insights into neuronal development and maintenance methylation.
Results
Human iPSCs from healthy volunteers were differentiated into sensory neurons (iSN)
iSN-specific differentiation was performed according to a previously described protocol [2], which at Day 15 shares morphological characteristics with primary rodent DRG neuronal cultures by exhibiting grouping of neurons into small ganglia that project axons (Figure 1). These neurons stained positive for the neuronal marker beta-III tubulin (Tuj-1) and Peripherin, an intermediate filament present peripheral nervous system neurons (Figure 2(a–c)).
Figure 1.
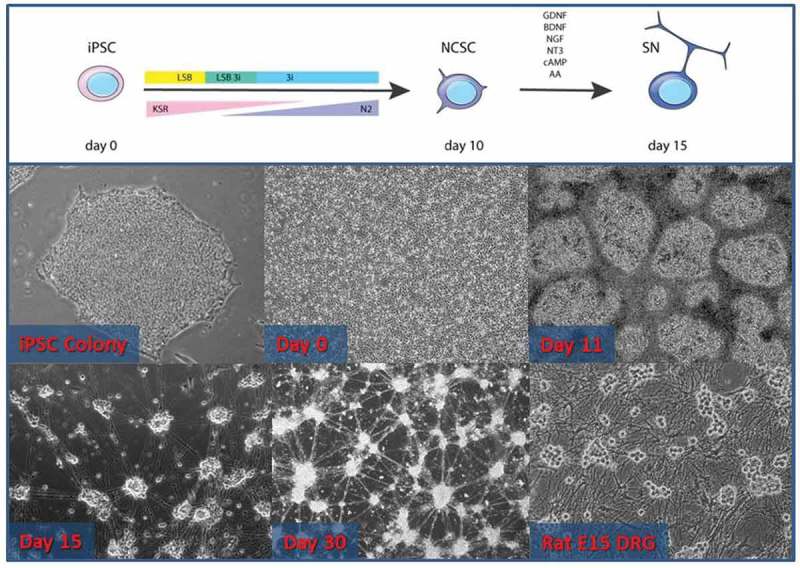
Neuronal differentiation from human iPSCs shares characteristics of rodent dorsal root ganglia neuronal cultures. (Top panel) Schematic of the protocol to produce sensory neurons. From days 1–10, media is changed with a decreasing percentage of KSR and an increasing percentage of N2. LSB and later 3i are added to the media, resulting in a neural crest stem cell phenotype (NCSC – Day 11). At that point, cells are re-seeded and growth factors (GDNF, BDNF, NGF, NT-3), cAMP, and ascorbic acid are provided, resulting in the sensory neuronal phenotype (iSN15). These neurons may be kept in prolonged culture (iSN30) and maintain their sensory neuronal phenotype. Note the similarity in the morphology of the iPSC-derived neurons and the rat embryonic day 15 DRG primary neuronal cultures.
Figure 2.
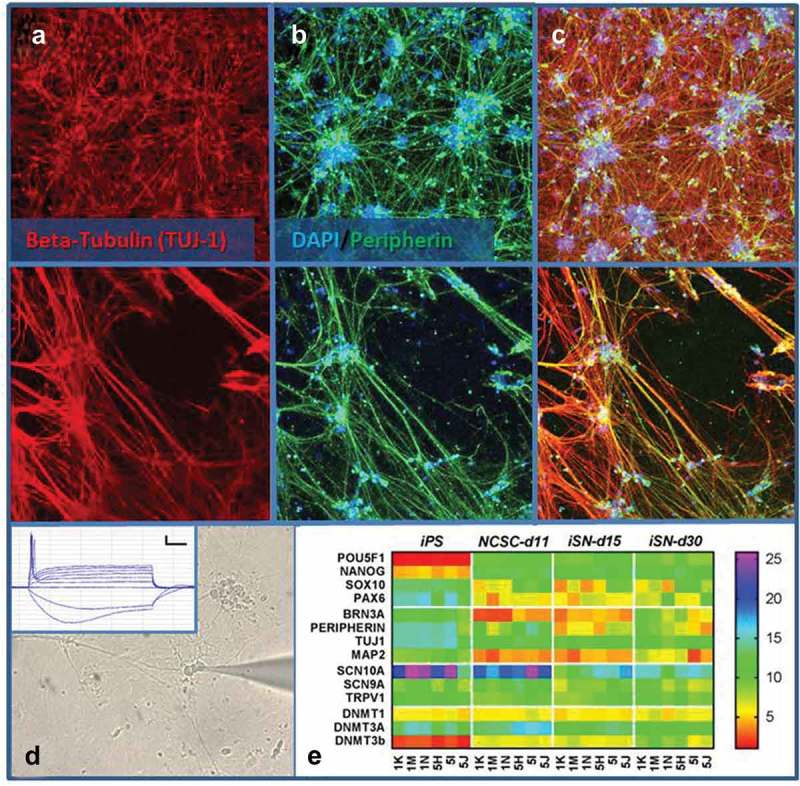
iSN express markers of sensory neurons. iSN15 neurons exhibit staining of both peripherin and Tuj-1. Most Tuj-1 positive neurons are also peripherin-positive (a-c). Photomicrograph of whole cell patch clamp recording from iSN30 (d) demonstrates action potential when injected with positive current (scale bar 10mV and 100 ms) and hyperpolarization-activated depolarization when injected with negative current (d Inset). (e) Heatmap representation of RT-PCR during iSN differentiation. Subject 1 (clones 1K, 1M, 1N) and Subject 2 (clones 5H, 5I, 5J) are arranged along the bottom horizontal axis with genes interrogated along the vertical axis. Data presented as ΔCT (CTgene-CTGAPDH) with red representing higher expression and violet representing a lower expression.
RT-PCR studies demonstrated the loss of pluripotency transcription factor OCT4 and NANOG gene expression by the neural crest stem cell (NSCS) stage of differentiation (Day 11; Figure 2(e)). During the same period, there was increased expression of markers of the sensory neuron (BRN3A) and the peripheral nervous system (PERIPHERIN) (Figure 2(e)). Gene expression of voltage-gated sodium ion channels and the capsaicin receptor (TRPV1), as markers of a maturing sensory neuronal cell phenotype, increased during differentiation (Figure 2(e)). Notably, the largest increase of ion channel expression in iSN was with SCN10A, which is specifically observed in human DRG small neuron nociceptors [7]. The expression of ion channels produced functional output within the iSN. Whole cell patch clamp electrophysiological recording from iSN exhibited action potentials and signs of hyperpolarization-activated depolarizing currents (n = 4, recorded after 30–40 days in culture and n = 8 after 60 days in culture, Figure 2(d)). Our data show successful differentiation of iPSCs toward functional sensory neurons that could be purified from an undefined iPSC-derived cell population
Genome-wide DNA methylation patterns in iPSC and iSN
Genome-wide gene-methylation analysis was performed with reduced representation bisulfite sequencing (RRBS) on iPSC and iSN at day 15 (iSN15) and day 30 (iSN30). About 2.2 million CpG sites were detected in 80% of samples with at least 5X coverage. For visualization and global methylation pattern assessment, we used 713K CpGs with complete data in all the samples. As shown in Figure 3(a), most of CpG sites in each sample were at low methylation (median close to 0) and CpG methylation distribution genome-wide was quite similar at different times and across samples. However, clear differences were seen in the mean CpG methylation of replicate samples for different time points (Figure 3(a–b)) where with differentiation from iPSCs to iSN15 and iSN30, the mean methylation decreased (ANOVA p-value 7.42e-06. Statistical significance was observed between iSN30 and iPSC and iSN30 and iSN15 but not between iSN15 and iPSC by pair-wise comparison). Decreased global methylation during sensory neuronal differentiation was associated with decreased expression of DNMT3B over the same time period (Figure 3(c)). The clear difference in DNA methylation was further demonstrated from principal components analysis (PCA, Figure 3(d)). Samples formed three distinct clusters by time points although the samples at iPSC and iSN15 were closer. PC1 explained 33% of the variance and was the major driver for the separation over time during neuron differentiation. PC2 contributed to about 16% of variability. The unsupervised clustering showed a similar picture where the iPSC cell clones were clearly different from the iSN30, while the iSN15 were somewhat similar to either iPSC or iSN30 depending on cell clones. Genetic background of the two patients appeared contributing to variability as within the time point the clones from the same individual clustered tighter and the iPSC clones clustered with those that were from one individual (1BT1, older) yet iSN30 clustered were from another individual (6BT1, younger) (Figure 3(e)).
Figure 3.
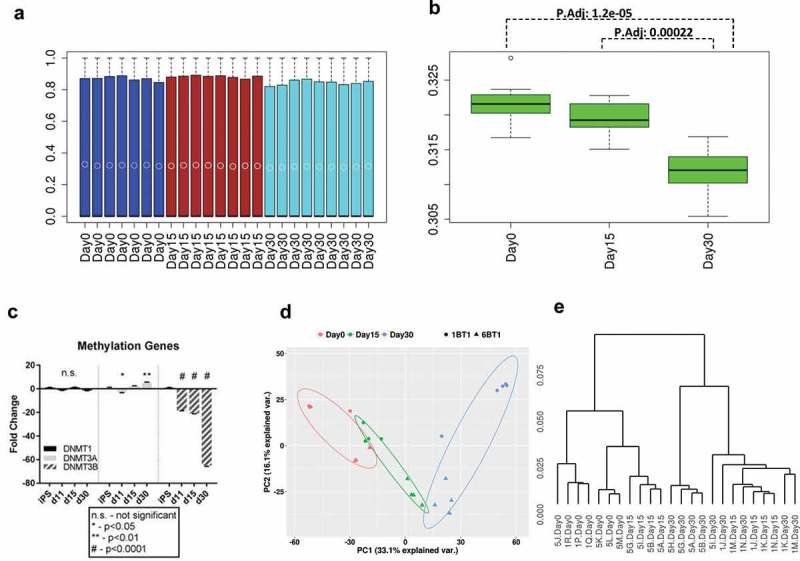
Methylation patterns during iSN differentiation. (a) Boxplot of CpG methylation across the genome of each sample at iPSC (Day 0: blue), iSN15 (Day 15: maroon) or iSN30 (Day 30: turquoise). Each bar represents a single patient sample. Median CpG methylation was near zero in all samples. Open circles within the boxplot denote mean values. (b) The boxplot of CpG methylation mean of each sample by time point. The mean methylation is decreasing with neural differentiation. P.adj is adjusted pair-wise comparison p-value by Bonferroni method. (c) Fold change of methylation gene expression during differentiation, expressed as 2−ΔΔCT. There was no statistically significant change in DNMT1 gene expression during differentiation, whereas there was a biphasic increase/decrease of DNMT3A and a drop in DNMT3B expression over the same period. (d) Principal components analysis (PCA) for all samples, colored differently for different time points. PC1 distinguishes samples at different times of differentiation and PC2 separates cells by their donors. (e) Unsupervised clustering for all samples. While iPSC and iSN30 samples are distinct, iSN15 samples are mixed with iPSC and iSN30 samples.
Reduced CpG methylation at CpG level during differentiation from iPS to mature iSN
We conducted differential methylation analysis between iPSC, iSN15, iSN30 using iPSC (culture day 0) as reference. We first analysed differentially methylated CpGs (DMCs) using a beta-binomial model. Under FDR less than 0.05 and methylation difference greater than 10%, we found the DMCs were increasing from iSN15 to iSN30 (70,265 and 115,803 DMCs vs. iPSC, respectively). The vast majority of these DMCs were in hypo-methylation at differentiated stages (75% and 83%, respectively, Figure 4(a)). The differences between iSN30 and iSN15 were very small as there were only 6,820 DMCs although hypo-methylation was still dominant (96%).
Figure 4.
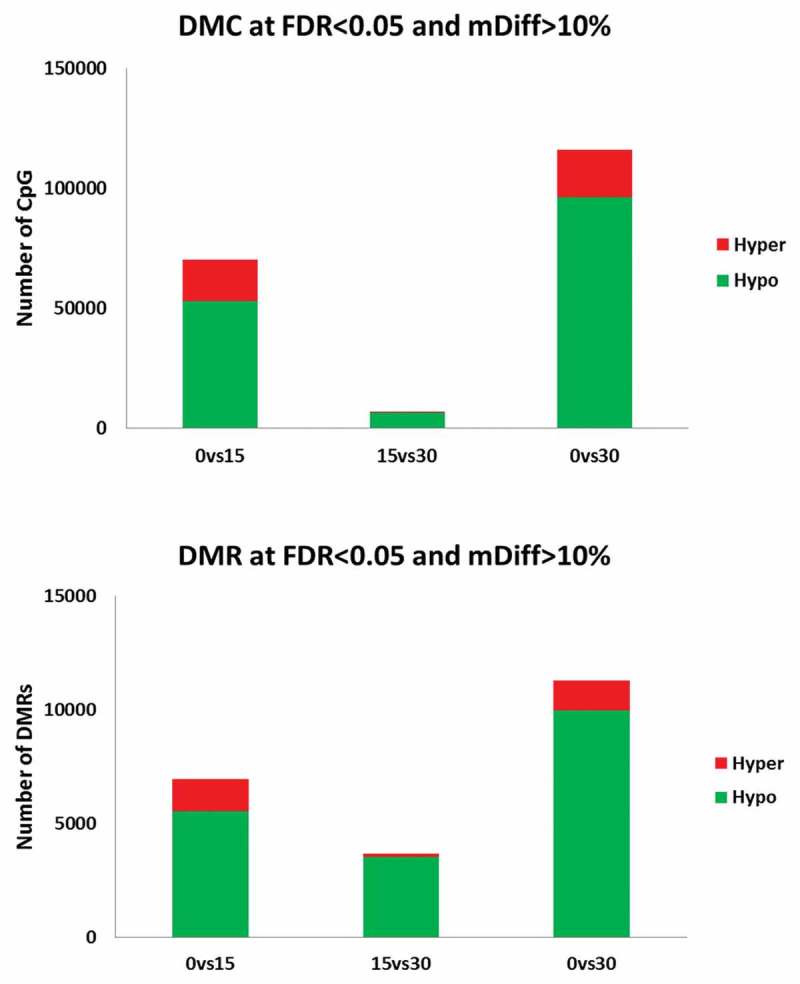
The majority of differentially methylated CpGs (DMCs) and regions (DMRs) exhibit hypomethylation. Differential methylation was most prominent when comparing iPSC and either iSN15 or iSN30. There were fewer DMCs and DMRs between iSN15 and iSN30.
As nearby CpGs are more likely correlated, we then conducted differentially methylated region (DMR) detection by aggregating CpGs with similar change patterns. This analysis led to 6,938 and 11,270 DMRs in iSN15 and iSN30 compared to iPSC (Figure 4(b)). Not surprisingly, the DMRs had the similar hypomethylation patterns as the DMCs (80% and 88%, respectively). Similar to DMCs, the number of DMRs between iSN30 and iSN15 was only 3,680, 95% of which were hypomethylated.
DMRs associated genes and pathways from iPSC to sensory neurons
To interrogate which genes were involved in the sensory neuronal differentiation process, we used the differentially methylated DMRs from iSN30 versus iPSC for comparison. Most of these DMRs were concentrated around transcription start site (TSS, Figure 5(a)). Upstream of TSS had the most DMRs and inside of genes was the next most common (Figure 5(b)). These DMRs were associated with 3,600 Ensembl (2219 RefSeq) genes within 5KB of their TSSs. Using these genes, we conducted pathway enrichment analysis by Ingenuity Pathway Analysis (Qiagen). At p-value less than 0.05, 108 canonical pathways were significantly enriched where 37 had a p-value less than 0.01 (Figure 5(c), the full pathway list and gene members are provided in Supplementary Table 1). Notably, the top two pathways were related to neural crest derivatives (Melanocyte Development) and axonal mechanisms (Axonal Guidance Signalling).
Figure 5.
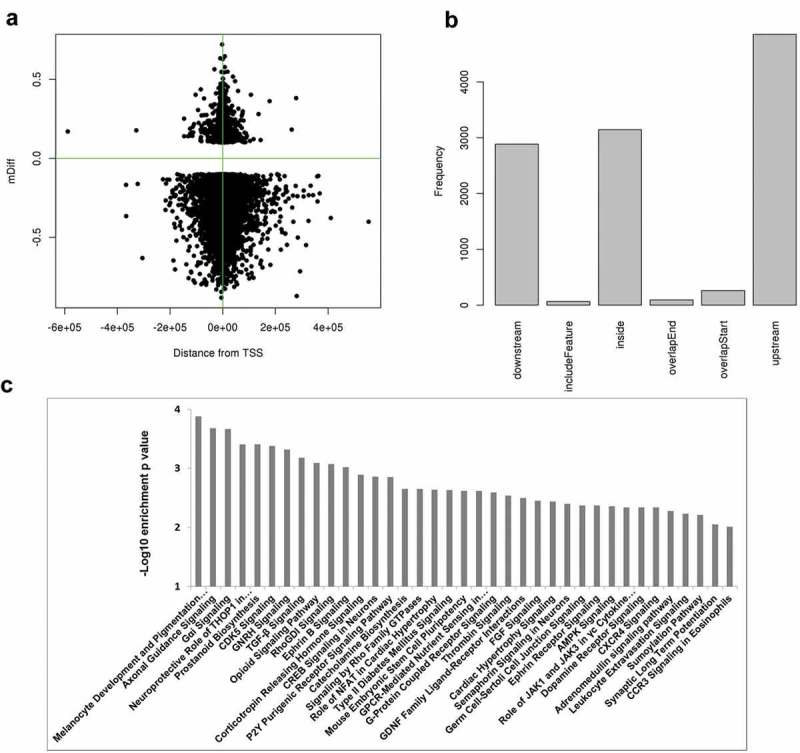
Genomic distribution of DMRs at iSN30 relative to iPSC and pathway enrichment analysis. (a) DMR locations relative to transcription start sites (TSS). Most of them are around TSS and hypomethylated. (b) DMR location relative to genes. The largest group is in the upstream of regulation region. (c) The top-enriched canonical pathways (p-value less than 0.01) from IPA analysis of DMR associated genes. X-axis is for – log10 enrichment p-value.
We investigated the methylation status of the genes known to be associated with iSN differentiation and DNA methylation. Of those that we performed RT-PCR analysis on (Figure 2(e)), there were DNA methylation changes in the regions around TSS of POU5F1, SOX10, PAX6, TUBB3, and DNMT3B. Increased methylation during differentiation was observed in DNMT3B, POU5F1, and PAX6, whereas decreased methylation was measured in SOX10 and TUBB3 (Table 1 and Figure 6). In the cases of POU5F1, SOX10, TUBB3, and DNMT3B, decreased DNA methylation was associated with increased gene expression during iSN differentiation and vice versa. This was not true for PAX6, where there was both increased DNA methylation and increased expression during iSN differentiation.
Table 1.
DNA methylation at the differential methylation regions near TSS for genes where RT-PCR data was available
| GENE | CHR | Start | End | Width | nCG | Diff. Methyl | Location | Distance | Entrez_id |
|---|---|---|---|---|---|---|---|---|---|
| POU5F1 | chr6 | 31,148,370 | 31,148,458 | 89 | 11 | 0.124,945 | Inside | 138 | 5460 |
| POU5F1 | chr6 | 31,148,516 | 31,148,577 | 62 | 11 | 0.137,701 | Upstream | −8 | 5460 |
| SOX10 | chr22 | 38,382,185 | 38,383,464 | 1280 | 27 | −0.15,277 | Overlapstart | 1244 | 6663 |
| PAX6 | chr11 | 31,840,560 | 31,842,051 | 1492 | 39 | 0.151,689 | Upstream | −1051 | 5080 |
| PAX6 | chr11 | 31,842,115 | 31,842,208 | 94 | 13 | 0.123,573 | Upstream | −2606 | 5080 |
| PAX6 | chr11 | 31,844,216 | 31,845,180 | 965 | 4 | 0.251,056 | Upstream | −4707 | 5080 |
| TUBB3 | chr16 | 89,988,252 | 89,988,329 | 78 | 5 | −0.14,906 | Inside | 452 | 10,381 |
| DNMT3B | chr20 | 31,353,440 | 31,353,522 | 83 | 8 | 0.140,618 | Inside | 3249 | 1789 |
Figure 6.
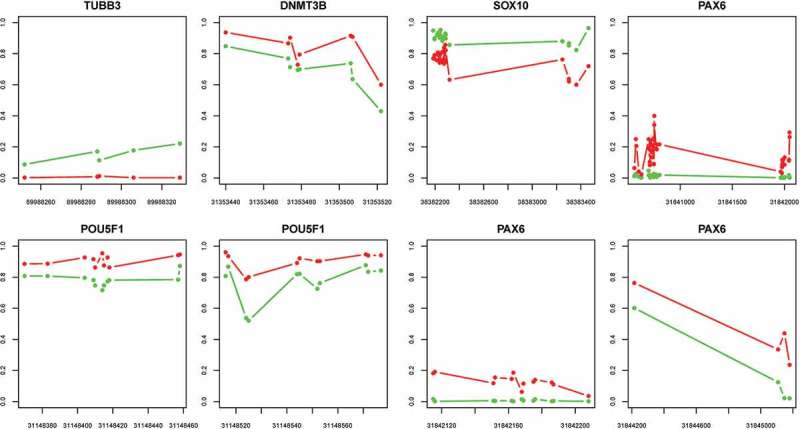
DNA methylation at the differential methylation regions near TSS for genes where RT-PCR data was available; iPSC (green) and iSN day 30 (red). See Table 1 for further details.
Discussion
Human iSN cultures are proving to be a useful tool to study neuronal biology and disease [4,5]. While the characterization of this cell type has been performed by other groups, [8,9] DNA methylation has never previously been described in this cell type, including the methylation changes that occur during the iSN differentiation process. iPSC-derived neuronal DNA methylation and gene expression appear to be robust and comparable to embryonic stem cell methodologies [10], further supporting the iPSC approach. Overall, in our study, we have demonstrated that mean DNA methylation decreases during iSN differentiation, which was further shown in DMC and DMR analyses. Notably, these methylation changes are overly represented by the genes in neuronal growth and development pathways, suggesting some degree of lineage specificity.
Our findings support the notion described in other systems that there is overall decreased DNA methylation from the pluripotent state through terminal differentiation [11]. Furthermore, when comparing our RT-PCR data with DNA methylation, these changes are associated with altered gene expression during iSN differentiation where DNA methylation near a gene acts to suppress that gene’s expression [12]. There was an association with decreased DNA methylation in specific neuronal lineage genes that increase expression during iSN development. Conversely, increased DNA methylation was seen in the pluripotency genes that decreased expression during iSN development [13]. Interestingly PAX6, where this association was not seen in our study, has previously been shown to have a high degree of gene expression variability in hESC lines despite typically exhibiting very low promotor methylation [14]. Overall, these findings suggest that DNA methylation plays an important role in gene expression and iSN differentiation in this human iPSC in vitro system; however, expanded RNAseq and chromatin immunoprecipitation data in future studies should better clarify this relationship.
We employed RRBS for quantification of DNA methylation in this study, which is known to capture 12% of methylome and biases to CpG rich regions of the human genome [15]. Therefore, genes with poor CpGs may be missed in the assay. It has also been reported that brain tissues or cells have higher percentages of CpG hydroxymethylation [16]; however, regular bisulfite sequencing does not distinguish methylcytosine from hydroxymethyl-cytosine. Whether and how hydroxymethyl-cytosine plays a role in sensory neuronal differentiation is a critical question of a future study, but there are some data to suggest a role in pain modulation in sensory neurons [17].
The relevance of DNA methylation in sensory neuronal health is evidenced that mutations in DNMT1 lead to peripheral nerve degeneration in the hereditary sensory and autonomic neuropathy type 1E [18]. In this disorder, DNMT1 mutations appear to lead to a loss-of-function, with decreased enzymatic activity and global hypomethylation and local hypermethylation [18,19]. Mental retardation is a feature in patients with mutations of DNMT3B, which is referred to as the ICF (immunodeficiency, centromeric region instability and facial anomalies) syndrome, further demonstrating the importance of DNA methylation in neurodevelopment. In our current study, DNMT3B gene expression dropped dramatically during iSN differentiation, which has been reported in embryonic stem cell systems [11], whereas there was a mild increase in DNMT3A and stable expression of DNMT1. Further examination of DNA methylation in iPS and iSN from patients with these mutations is warranted in future studies.
Methods
Human iPSC generation and maintenance
Following Mayo Clinic IRB-approved informed consent, punch skin biopsies were performed on two healthy volunteers’ skins (Patient 1: 21-year-old female (6BT1), Patient 5: 77-year-old female (1BT1)) and skin fibroblasts were isolated. IPSCs were generated using Sendai virus transfection (Cytotune 2.0) with the transcription factors known to generate iPSCs (OCT4, SOX2, MYC, KLF4) in order to produce 2–3 clones per patient sample (Regen Theranostics). iPSCs underwent a qualification process where the clones are karyotyped (Mayo Clinic Cytogenetics Core), measured for expression of stem cell factors (OCT 4, SSEA4, Tra-1–60 and Nanog) by flow cytometry and immunocytochemistry and differentiated to the three primitive germ layers using Ecto, Endo, and Meso Stem Diff kits (StemCell Technologies). iPSC cultures were maintained in mTeSR1 media (StemCell Technologies) on Geltrex LDEV-Free substrate coating (Life Technology). iPSC cultures were manually passaged every four days at a split ratio of 1:4. Care was taken to not exceed 50 passages for each line. Aseptic techniques and biological safety cabinets (Level2) were followed to prevent contamination.
Sensory neuron differentiation
For sensory neuron differentiation, iPSC were treated according to the protocol described by Chambers with modifications [2]. In brief, iPSCs were seeded at 2 × 10⁵ cells/cm2 in mTeSR1 media on Geltrex with 10 ng/ml Y-27632 (Calbiochem). Day 0 treatment was initiated when cultures reach ~80% confluence (approximately 24 h after seeding). During Days 0–10, daily media exchanges were made wherein KSR is sequentially converted to N2. KSR medium was prepared by supplementing Knockout DMEM with 15% knockout serum replacement, 1% Glutamax, 1% MEM non-essential amino acids and 55 µM 2 b-mercaptoethanol (Life Technologies). Additionally, media were supplemented with 100 nM LDN193189 and 10 µM SB431542 (LSB treatment, compounds purchased from Stemgent) on days 0–4 and with 3µM CHIR99021 (Tocris), 10µM DAPT (Tocris), and 5µM SU5402 (Sigma) (3i treatment) on days 2–10.
Once the cultures exhibited a conformation as depicted in Figure 1 (day 11), the putative neural crest stem cells (NCSC) were dissociated with accutase (EMD Millipore) and seeded with neuronal media (N2 supplemented with growth factors: 25 ng/ml NGF, BDNF, GDNF, and NT3 (R&D systems)), 0.5 mM cAMP (Sigma Aldrich), and 200 µM L-ascorbic acid (Sigma Aldrich). It was in this final supplemented N2 media that the induced sensory neurons (iSN) differentiated to day 15 and day 30.
All experiments were performed on both human iPS clones, with each clone undergoing iSN differentiation in triplicate prior to processing.
Whole cell patch clamp electrophysiology
Patch-clamp experiments were performed in whole-cell configuration at room temperature (20–22°C) using an Axopatch 200B patch-clamp amplifier controlled by pClamp 10 software (Molecular Devices). Patch pipettes had resistances between 1.5 MΩ and 3 MΩ. Extracellular solution contained 140 mM NaCl, 4.7 mM KCl, 2.5 mM CaCl2, 1.2 mM MgCl2, 10 mM HEPES and 10 mM glucose; pH was adjusted to 7.4 with NaOH. The intracellular (pipette) solution for current-clamp contained 130 mM KCl, 1 mM MgCl2, 5 mM MgATP, 10 mM HEPES and 0.5 mM EGTA; pH was adjusted to 7.3 with KOH. The osmolarity of all solutions was maintained at 320 mOsm/L for an extracellular solution and 300 mOsm/L for intracellular solutions. All chemicals were purchased from Sigma. Currents were sampled at 10 kHz. Action potentials were recorded only from patched cells with resting membrane potential near −60 mV and injecting increasing currents to elicit action potentials. Whole-cell patch-clamp data were analysed using Clampfit 10 (Molecular Devices).
Immunocytochemistry and microscopy
Cells were washed with DPBS and fixed with 4% paraformaldehyde for 20 min at room temperature. They were then permeabilized using 0.5% TritonX-100 for 15 min, blocked with 10% donkey serum for 1 h and incubated with primary antibodies overnight (Mouse anti-TUBB3, 1:1000, MO14013, Covance; Goat anti-Peripherin, 1:750, SC-7604, Santa Cruz). The cells were then labelled with secondary antibodies (Alexa Fluor 488/594, Invitrogen) for 1 h and counterstained with DAPI (1 µg/ml) for 30 min. The samples were washed with 1X TBS after fixing, permeabilization, primary, secondary and DAPI. Vectashield was used for mounting and imaged using a Zeiss LSM710 confocal microscope.
Genomic DNA extraction
DNA samples were extracted from cells grown as a monolayer using Qiagen Blood and Cell culture DNA Kit (Qiagen). In brief, 1 × 10⁷ cells were lysed using ice-cold buffer C1 and digested with buffer G2 and treated with Proteinase K. The Qiagen genomic tip 20/G was equilibrated with buffer QBT before passing the digested cell lysate through the column. The column was then washed thrice with buffer QC. Genomic DNA was eluted from the columns using buffer QF and precipitated with isopropanol. The pellet was washed once with 70% ethanol and air dried for 5–10 min before resuspending the DNA in TE buffer, pH 8.0). Purity and concentration were measured using nanodrop.
mRNA extraction
mRNA were extracted from differentiation day 0 (iPSC), day 11 (NCSC), iSN at day 15 (iSN15) and iSN at day 30 (iSN30) using a hybrid Qiazol-Column method. The cells were washed with room temperature 1X PBS and dissociated with 1ml Qiazol (10 cm2). Qiazol volume was adjusted according to cell density (1 ml for 10 million cells). Chloroform was added to qiazol mixture at 1/5 volume and vigorously shaked for 15 s. Samples were then incubated on ice for 15 min and centrifuged at 15000 g, 30 min, 4°C. Aqueous phase containing the RNA was carefully collected (50–60% of total volume) and passed through the Qiagen RNeasy purification column. RNA was precipitated with 100% ethanol onto the column and washed once with 700 µl RW1 buffer and thrice with 700 µl RPE buffer. Samples were centrifuged at 15000 g for 1 min at room temperature for all column washes. RNA was eluted with 35–50 µl PCR grade water. Concentration and purity were measured using nanodrop and stored at −80.
cDNA preparation and real-time PCR
Genomic DNA was digested with ezDNase (Thermofisher) for 20 min at 37°C in a dry bath. These samples were ready to be used for reverse transcription without further purification steps. Superscript IV Vilo master mix (Thermofisher) was used for cDNA preparation from mRNA samples. Each RT reaction was run at 25°C for 10 min to anneal the primers, 50°C for 10 min to reverse transcribe and 85°C for 5 min to inactivate the enzyme in a Bio-Rad CFX Connect Real-Time PCR System (manager software version 3.1, Bio-Rad Laboratories Inc.). A 15µl real-time PCR reaction was prepared in triplicate using 2µl (20ng) of diluted cDNA template, 2x Fast SYBR® Green Master Mix (Applied Biosystems) and 150nM of each forward and reverse gene-specific primer. QPCR reactions were run by activating the DNA polymerase at 95°C for 20 s, followed by 40 cycles of denaturation at 95°C for 1 s and annealing/extension at 60°C for 20 s. Primers used in this study are listed in Supplementary Table 2. Real-time PCR data were presented as values of 2−∆∆Ct, where the ∆Ct is calculated as the mean of triplicate Ct values of the gene of interest subtracted by the mean Ct values of the internal control gene GAPDH on the same PCR run and ∆∆Ct is the difference between ∆Ct of target gene in differentiated sample (NCSC, iSN15, iSN30) and ∆Ct of target gene in undifferentiated sample (iPSC) [20].
Reduced Representation Bisulfite Sequencing (RRBS)
RRBS was performed at the Mayo Clinic Genotyping Shared Resource facility as described before [21]. Briefly, DNA was digested with Msp1 and purified using Qiaquick Nucleotide Removal Kit. End-repair A tailing was performed and TruSeq methylated indexed adaptors were ligated with T4 DNA ligase. Size selection was performed with Agencourt AMPure XP beads. Bisulfite conversion was performed using EZ-DNA Methylation Kit (Zymo Research, Catalog Number: D5001) as recommended by the manufacturer with the exception that incubation was performed using 55 cycles of 95°C for 30 sec and 50°C for 15 min. Following bisulfite treatment, the DNA was purified and library quantification was performed using Qubits dsDNA HS Assay Kit and the Bioanalyzer DNA 1000 Kit.
Completed libraries are pooled and 20% commercially prepared PhiX library (Illumina) is added to increase base diversity for improved sequencing quality. Samples are sequenced at 8 samples per lane to generate 25–35 million reads per sample following Illumina’s standard protocol using the Illumina cBot and HiSeq 3000/4000 PE Cluster Kit. The flow cells were sequenced as 100 base single end reads on an Illumina HiSeq 4000 using HiSeq 3000/4000 sequencing kit and HCS v3.3.52 collection software. Base-calling is performed using Illumina’s RTA version 2.7.3.
RRBS data pre-processing and quality assessment
RRBS data were analysed using a streamlined analysis and annotation pipeline for reduced representational bisulfite sequencing, SAAP-RRBS [22]. Briefly, FASTQ files were trimmed to remove adaptor sequences, and any reads with less than 15bp were discarded. Trimmed Fastqs were then aligned against the reference genome using BSMAP [23]. Samtools [24] were used to get mpileup and custom PERL scripts to determine CpG and non-CpG methylation and bisulfite conversion ratios. Methylation was reported along with custom CpG annotation. A minimum of five read coverage was required for inclusion of a cytosine in subsequent high-level analyses.
Approximately 37.8 (11.4–52.2) million-single end reads at 100 bp length were generated for each individual sample and 44–86% of these reads were mapped to the human reference genome (hg19). These sequencing results covered 3–6 million cytosines in CpG context from both forward and reverse strands, which are equivalent to 1.5–3 million unique CpG sites (out of ~28 million total CpGs in the genome). The bisulfite conversion rate was assessed using all non-CpG cytosine methylation status with ≥ 5X coverage, and was found close to 1 (all > 0.99), indicating we obtained almost complete conversion.
Statistical analysis for differential methylation
Further quality control and global methylation profile check were visualized by box-plot and principal components analysis. Differential methylation of individual CpG loci was detected by performing a Wald test for beta-binomial distribution using Dispersion Shrinkage for Sequencing (DSS) [25]between the different time points. The differentially methylated CpGs (DMCs) were selected according to the combination of nominal P value (≤0.05) and mean methylation difference between groups (delta ≥ 10%).
Coordinated DNA methylation change often occurs in a cluster or a region, and it is important to evaluate the differentially methylated regions (DMRs) scattered across the genome. Statistically significant DMCs were used to detect DMRs with these criteria: a minimum DMR length of 50 bp, a minimum of 3 CpG sites in the region, and the percentage of CpG sites with significant differential P values greater than 50%. Additionally, nearby DMRs were merged if they were within 100 bp window.
Statistical analysis for PCR gene expression data
Gene expression levels are presented as ΔCT (CTgene-CTGAPDH). For relative expression changes between differentiation time points, gene expression fold change is presented as 2−ΔΔCT = [(CTgene-CTGAPDH) differentiation day – (CTgene-CTGAPDH) iPS] with mean ± SEM [20]. ANOVA was conducted using Prism software (GraphPad Software, La Jolla, CA) to determine significance and Tukey’s test was used for post-hoc analysis for PCR.
Funding Statement
This study was supported by the National Institutes of Health [grants K08 CA169443, R01 CA 211887 (NPS)] and the Mayo Clinic Center for Regenerative Medicine.
Disclosure statement
No potential conflict of interest was reported by the authors.
Supplementary material
Supplemental data for this article can be accessed here.
References
- [1].Hoffman EM, Staff NP, Robb JM, et al. Impairments and comorbidities of polyneuropathy revealed by population-based analyses. Neurology. 2015;84:1644–1651. [DOI] [PMC free article] [PubMed] [Google Scholar]
- [2].Chambers SM, Qi Y, Mica Y, et al. Combined small-molecule inhibition accelerates developmental timing and converts human pluripotent stem cells into nociceptors. Nat Biotechnol. 2012;30:715–720. [DOI] [PMC free article] [PubMed] [Google Scholar]
- [3].Takahashi K, Yamanaka S.. Induction of pluripotent stem cells from mouse embryonic and adult fibroblast cultures by defined factors. Cell. 2006;126:663–676. [DOI] [PubMed] [Google Scholar]
- [4].Hoelting L, Klima S, Karreman C, et al. Stem cell-derived immature human dorsal root ganglia neurons to identify peripheral neurotoxicants. Stem Cells Transl Med. 2016;5:476–487. [DOI] [PMC free article] [PubMed] [Google Scholar]
- [5].Lee G, Papapetrou EP, Kim H, et al. Modelling pathogenesis and treatment of familial dysautonomia using patient-specific iPSCs. Nature. 2009;461:402–406. [DOI] [PMC free article] [PubMed] [Google Scholar]
- [6].Klein CJ, Benarroch EE.. Epigenetic regulation: basic concepts and relevance to neurologic disease. Neurology. 2014;82:1833–1840. [DOI] [PubMed] [Google Scholar]
- [7].Dib-Hajj SD, Tyrrell L, Cummins TR, et al. Two tetrodotoxin-resistant sodium channels in human dorsal root ganglion neurons. FEBS Lett. 1999;462:117–120. [DOI] [PubMed] [Google Scholar]
- [8].Schwartzentruber J, Foskolou S, Kilpinen H, et al. Molecular and functional variation in iPSC-derived sensory neurons. Nat Genet. 2018;50:54–61. [DOI] [PMC free article] [PubMed] [Google Scholar]
- [9].Young GT, Gutteridge A, Fox H, et al. Characterizing human stem cell-derived sensory neurons at the single-cell level reveals their ion channel expression and utility in pain research. Mol Ther. 2014;22:1530–1543. [DOI] [PMC free article] [PubMed] [Google Scholar]
- [10].de Boni L, Gasparoni G, Haubenreich C, et al. DNA methylation alterations in iPSC- and hESC-derived neurons: potential implications for neurological disease modeling. Clin Epigenetics. 2018;10:13. [DOI] [PMC free article] [PubMed] [Google Scholar]
- [11].Laurent L, Wong E, Li G, et al. Dynamic changes in the human methylome during differentiation. Genome Res. 2010;20:320–331. [DOI] [PMC free article] [PubMed] [Google Scholar]
- [12].Gifford CA, Ziller MJ, Gu H, et al. Transcriptional and epigenetic dynamics during specification of human embryonic stem cells. Cell. 2013;153:1149–1163. [DOI] [PMC free article] [PubMed] [Google Scholar]
- [13].Mohn F, Weber M, Rebhan M, et al. Lineage-specific polycomb targets and de novo DNA methylation define restriction and potential of neuronal progenitors. Mol Cell. 2008;30:755–766. [DOI] [PubMed] [Google Scholar]
- [14].Bock C, Kiskinis E, Verstappen G, et al. Reference maps of human ES and iPS cell variation enable high-throughput characterization of pluripotent cell lines. Cell. 2011;144:439–452. [DOI] [PMC free article] [PubMed] [Google Scholar]
- [15].Harris RA, Wang T, Coarfa C, et al. Comparison of sequencing-based methods to profile DNA methylation and identification of monoallelic epigenetic modifications. Nat Biotechnol. 2010;28:1097–1105. [DOI] [PMC free article] [PubMed] [Google Scholar]
- [16].Mellen M, Ayata P, Heintz N. 5-hydroxymethylcytosine accumulation in postmitotic neurons results in functional demethylation of expressed genes. Proc Natl Acad Sci U S A. 2017;114:E7812–E21. [DOI] [PMC free article] [PubMed] [Google Scholar]
- [17].Wu Q, Wei G, Ji F, et al. TET1 overexpression mitigates neuropathic pain through rescuing the expression of mu-Opioid receptor and Kv1.2 in the primary sensory neurons. Neurotherapeutics. 2018. DOI: 10.1007/s13311-018-00689-x [DOI] [PMC free article] [PubMed] [Google Scholar]
- [18].Klein CJ, Botuyan MV, Wu Y, et al. Mutations in DNMT1 cause hereditary sensory neuropathy with dementia and hearing loss. Nat Genet. 2011;43:595–600. [DOI] [PMC free article] [PubMed] [Google Scholar]
- [19].Klein CJ, Bird T, Ertekin-Taner N, et al. DNMT1 mutation hot spot causes varied phenotypes of HSAN1 with dementia and hearing loss. Neurology. 2013;80:824–828. [DOI] [PMC free article] [PubMed] [Google Scholar]
- [20].Schmittgen TD, Livak KJ. Analyzing real-time PCR data by the comparative C(T) method. Nat Protoc. 2008;3:1101–1108. [DOI] [PubMed] [Google Scholar]
- [21].Baheti S, Singh P, Zhang Y, et al. Adipose tissue DNA methylome changes in development of new-onset diabetes after kidney transplantation. Epigenomics. 2017;9:1423–1435. [DOI] [PubMed] [Google Scholar]
- [22].Sun Z, Baheti S, Middha S, et al. SAAP-RRBS: streamlined analysis and annotation pipeline for reduced representation bisulfite sequencing. Bioinformatics. 2012;28:2180–2181. [DOI] [PMC free article] [PubMed] [Google Scholar]
- [23].Xi Y, Bock C, Muller F, et al. RRBSMAP: a fast, accurate and user-friendly alignment tool for reduced representation bisulfite sequencing. Bioinformatics. 2012;28:430–432. [DOI] [PMC free article] [PubMed] [Google Scholar]
- [24].Li H, Handsaker B, Wysoker A, et al. Genome project data processing S. The sequence alignment/map format and SAMtools. Bioinformatics. 2009;25:2078–2079. [DOI] [PMC free article] [PubMed] [Google Scholar]
- [25].Park Y, Wu H. Differential methylation analysis for BS-seq data under general experimental design. Bioinformatics. 2016;32:1446–1453. [DOI] [PMC free article] [PubMed] [Google Scholar]
Associated Data
This section collects any data citations, data availability statements, or supplementary materials included in this article.