Abstract
Conventional preclinical positron emission tomography (PET) scanners consist of arrays of discrete scintillators and photosensors. We presented and evaluated a preclinical PET detector constructed with a single-piece monolithic scintillator ring (MSR) and two rings of silicon photomultipliers, which is different from any PET systems that have been constructed. The scintillator ring has an outer diameter of 58.5 mm, an inner diameter of 48.5 mm and a length of 25.12 mm. The two SiPM rings, constructed with 46 SiPMs, were air-coupled to the two ends of the MSR. The experimental results show energy resolution of 10.7% @ 511keV for a 22Na point source placed outside of the MSR. The center of gravity and artificial neural network methods were used to decode the positions of the gamma interactions in both circumferential (θ) and axial (Z) directions. A hot-rod Derenzo phantom filled with 18F-FDG was used to evaluate the image quality of the MSR PET detector. The energy resolution of the phantom experiment was 12.3% for the peak of single events, and 11.4% for the peak of coincidence events. The average intrinsic full width half maximums (FWHMs) and mean absolute errors (MAEs) of the position of gamma photons were 0.94 mm and 0.33 mm in the circumferential direction, 2.45 mm and 1.08 mm in the axial direction. For the hot-rod phantom imaging studies, rods with a diameter of as low as 1.2 mm can be resolved. The circumferential parallax caused by “photon interference” was investigated. The average positioning error in the θ direction was less than 0.37 mm when Δθ of two events was bigger than 70°. Experimental results show excellent energy resolution, decoding accuracy and image quality. It is concluded that the MSR approach may be an effective and feasible way to construct preclinical PET scanners.
Keywords: the PET detector, the scintillator crystal ring, phantom imaging, resolution, the artificial neural network
1. Introduction
Positron Emission Tomography (PET) became commercially available 40 years ago with successful applications in oncology, cardiology and neurology (Hoh 2007; Ohira et al 2013; Portnow et al 2013; Singhal 2012). With the increased use of mouse models for biomedical research, preclinical small-animal PET has become a well-established modality in preclinical investigations in pharmacology, genetics and pathology (Hoh 2007; Ohira et al 2013; Portnow et al 2013; Singhal 2012). The limiting factor in the performance of current preclinical PET scanners is demonstrably the performance of the gamma detector (Berg & Cherry 2018). The assembly accuracy of the detectors has a significant impact on reconstruction imaging of the PET scanner. Conventional preclinical PET detector modules consist of an array of discrete scintillators and photosensors (Hsu et al 2018; Xie et al 2017; Yang et al 2016).
The performance of the detector module determines the imaging quality of the scanner in terms of discrete crystal decoding (Moses 2011), depth of interaction (DOI) decoding (Bieniosek et al 2016), energy resolution, and intrinsic efficiency. Many factors may affect the performance of detector modules, including the properties of the scintillator crystals, the optical properties of the light guides and coupling materials, the surface treatment of the scintillator crystals and light guides, the optical reflectance properties of the reflectors, the pattern and depth of the slots in the light guide (for PMT-based block detectors) and the performance of the photodetectors.
For the discrete scintillator detector, size reduction of the discrete crystals can help improve the positioning accuracy of 511KeV gamma photons (Moses 2011; Moese & Derenzo 1993). However, this strategy also causes the lower filling factor of the crystal array, which in turn lowers the sensitivity and the energy resolution. In detector modules for sub-millimeter preclinical PET imaging, the thickness of the reflector is a critical factor limiting the detector module’s filling factor (Song et al 2008). For example, the high-resolution PET scanner constructed with sub-millimeter scintillator crystals is constructed with detectors that use crystals 0.8 mm × 0.8 mm in size and that have 0.1 mm-thick reflectors. The filling factor of the detector is lower than 79%, and the resulting efficiency is lower. The energy resolution of the detectors also decreases significantly when a crystal is smaller than 1 mm. Moreover, the assembly accuracy of the discrete scintillator arrays in conventional architecture is also an issue that can deteriorate the performance of PET. Therefore, the conventional architecture of PET based on discrete scintillator arrays is a fundamental technical obstacle preventing preclinical PET systems from achieving better performance and being applied to preclinical research (Britt et al 2018; Santangelo et al 2015; Shi et al 2018).
There are always tradeoffs among positioning accuracy, energy resolution and efficiency in the conventional architecture used for discrete scintillator arrays. Monolithic scintillator blocks can achieve much higher efficiency and provide better energy resolution (Aguilar et al 2016; Mikhaylova et al 2017; Zhang et al 2017). Nonetheless, the decoding accuracy of monolithic scintillator blocks is limited by the edge effects (Cabello et al 2015). Some special and similar detector structures have been proposed to improve decoding accuracy. The curve-plate NaI (Tl) detector was presented to achieve high performance of a whole-body PET scanner (Adam et al 2001). The long and axially oriented scintillator crystals were shown by the AX-PET demonstrator as a possible solution for a high resolution and high efficiency PET detector (Casella et al 2013). In this paper, we presented a monolithic scintillator ring (MSR) detector consisting of a single continuous ring that with no edges around it. The MSR PET detector is able to achieve a 100% fill factor (not including the photosensors and readout electronics), with potential outstanding decoding accuracy and excellent energy resolution. On top of this, innovative methods were established to read out the distribution of the scintillating photons. Then, innovative signal processing methods were developed to decode the single event interactions positioned in the MSR. A prototypical MSR PET detector was constructed and the design and performance evaluation of the MSR scanner regarding its energy resolution and decoding accuracy in detail were conducted.
Although the scope of this paper focuses on design and fabrication of the monolithic detector ring, and the readout method and the performance of the detector in terms of energy resolution and decoding performance in both θ and z directions, we have also performed an initial imaging experiment on a Derenzo phantom to demonstrate the feasibility of imaging with a single MSR detector. However, this paper does not include the comprehensive assessment of the imaging performance of the MSR imager constructed using one or multiple MSR detectors in term of spatial resolution, count rate, sensitivity and etc.
2. Methods
2.1. MSR PET detector/scanner
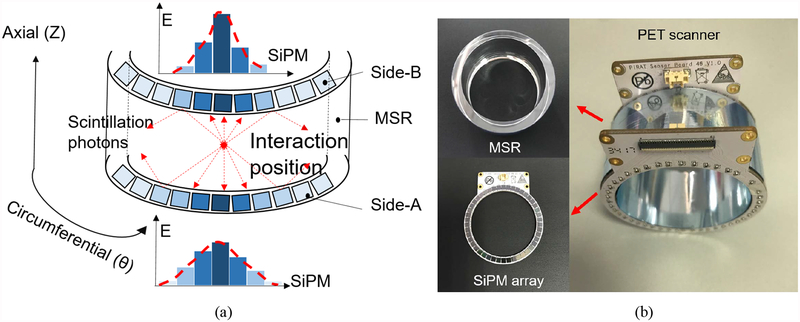
The prototypical MSR scanner is composed of a single piece of the monolithic lutetium–yttrium oxyorthosilicate (LYSO) crystal in a ring (provided by Suzhou Jtcrystal, JTC), which is used to stop gamma rays emitted from the object which has been injected with radiotracers. The positions of the gamma interactions in a MSR will be localized accurately using the distribution of the scintillating photons on the surfaces of the MSR detector (Fig. 1a). The positioning accuracy of gamma photons directly determines the quality of the reconstructed image. Two reflectors (Enhanced Specular Reflectors, ESR) were attached to the inner and outer cylindrical surface of a polished MSR. Two silicon photomultipliers (SiPM) rings, constructed with 46 SiPMs, were air-coupled to the two sides of the MSR. Fig. 1b shows the assembled MSR PET scanner, the MSR and the SiPM array ring.
Fig. 1.
(a) The localization method of gamma photons: the scintillating photons propagate in the MSR and will be received by SiPM arrays; the light distribution of SiPM arrays will be used to calculate the positions. (b) The assembled MSR scanner module consists of a LYSO MSR and two rings of SiPM arrays.
We established a way of cutting a hollow cylindrical ring (with the inner diameter of 48.5mm, the outer diameter of 58.5mm, the thickness of 5 mm and the length of 25.1 mm) from a LYSO boule by using two customized core drills with different diameters. The 46 SiPMs were evenly distributed on a ring-shaped SiPM array, with the angle and pitch between the SiPMs being 7.83°, and 3.7 mm measured from center to center. The SiPMs (MicroFJ-30035-TSV, SensL) had a 3 mm × 3 mm active area with a 3.16 mm pitch and 5,601 microcells of 35 × 35 μm2. The two SiPM arrays were connected to a high-performance custom-designed electronic module via two 100 mm FPC cables. The electronic module read out all 92 SiPM channels in parallel and transmitted the single event data to a host PC via a USB 2.0 cable (Zhao et al 2018; Zhao et al 2017).
2.2. Circumferential collimation
The gamma photons will be localized by separately calculating their circumferential (θ) and axial (Z) directions for the MSR scanner. Experiments were performed to measure the decoding accuracy of the MSR detector in both θ and Z directions.
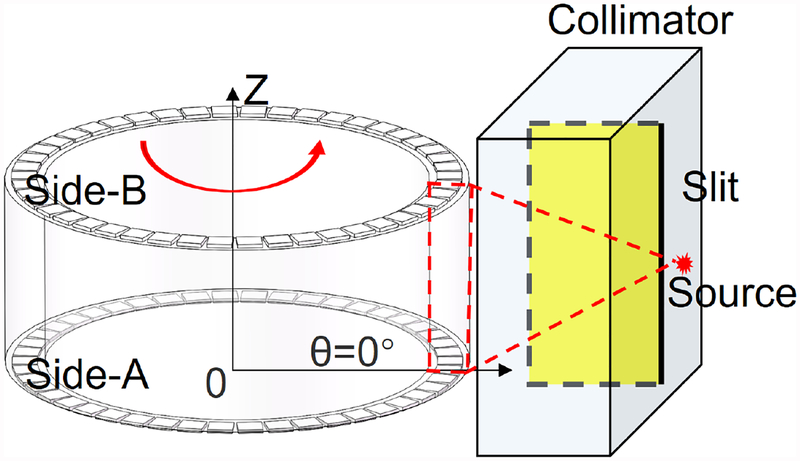
The θ coordinate is the angle of the interaction position relative to the coordinate axis (θ=0°). A 20 mm thick tungsten collimator with a 0.5 mm slit and a 22Na point source (100 μCi, the active area: 0.25 mm in diameter) was used to assess the decoding accuracy of the prototypical MSR detector in the θ direction. The source was mounted on the slit of the collimator and the MSR detector was fixed tightly to the center on the rotation platform with a rotation accuracy of 0.05°/10°. The collimator was set up with its slit on the same plane as the common axis of the MSR detector and the rotation platform. In the first experiment, the rotation platform rotated the MSR detector at 10° per step from − 90° to 90° (Fig. 2). In the second experiment, the rotation platform rotated the MSR detector at 1° per step for 37 steps (from −18° to 18°). At each position, when a single event was triggered, energy signals from all 92 SiPMs were measured and transmitted to the host PC. All the detector setups were placed in a dark chamber. The single event data of thirty seconds was recorded in each position.
Fig. 2.
Illustrations of the experimental settings to assess the decoding accuracy of the MSR detector in the θ direction.
The total energy of the single events was calculated by summing the energy signals from all the SiPMs. A 450–650 keV energy window was applied. Nine SiPM signals around the SiPM with the maximum signal were used to calculate the position of gamma interactions in the θ direction by the center of gravity (COG) method. The positions calculated from the side-A and side-B rings of the SiPMs were averaged to derive the positions (P) of the θ direction gamma interactions, thus:
| (1) |
Where PA and PB in the position measured from the side-A and side-B SiPM rings respectively. Note that the variance in the positions measurements in the θ direction has two components: and . is the variance introduced by the non-ideal collimator with a 0.5 mm slit. is the intrinsic variance of the MSR detector and the COG method. Thus, the intrinsic variance () also has two components: and . It is reasonable to assume that and are independent of each other. Therefore, the intrinsic variance of the MSR detector and the COG method can be expressed as:
| (2) |
2.3. Circumferential parallax
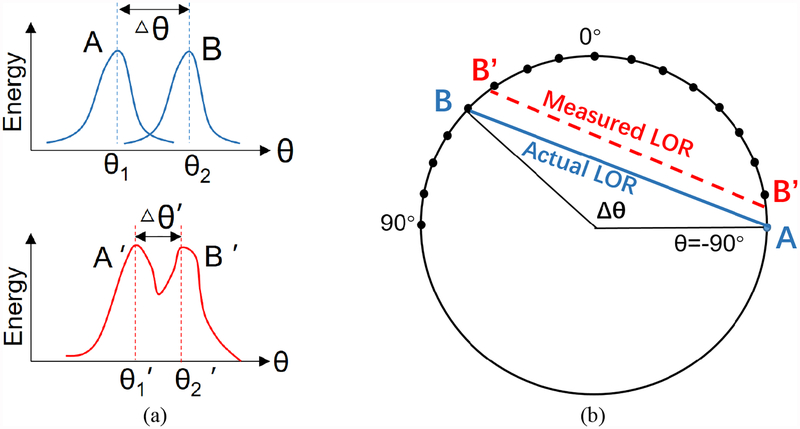
As shown in Fig. 3a, when two 511 KeV gamma photons were detected by the MSR PET detector at the same time, the light distribution of the two events (A and B, the blue curve) would interfere with each other. When there was no interference, the calculated interaction positions of the two events were θ1 and θ2. However, due to the interference, the actual calculated position would be biased (θ1’ and θ2’, the red curve), which might cause parallax. Therefore, the collimated data with the step of 10° at the θ direction was used to investigate the interference of circumferential parallax. As shown in Fig. 3b, the actual line of response (LOR) was generated by connecting the average position of the interactions calculated separately. Then, the energy signals at − 90° were added to the other collimation angles (− 80° to 90°) to obtain 18 sets of energy distributions of the coincidence events, which were used to calculate the measured LORs. The MAE and FWHM of the interaction positions of single events and coincidence events were calculated respectively. The MAE is defined as the mean of the absolute value of the positioning error:
| (3) |
where N is the total number of valid single events; θi is the calculated position; θ is the known calibration position.
Fig. 3.
(a) The light distribution of a coincidence event. (b) Date processing of circumferential parallax.
2.4. Axial collimation
At the axial direction, the Z coordinate is the distance from the interaction position to the side-A (Z=0). The displacement platform moved the MSR detector up at 1 mm per step for 25 steps to cover the range from 1 mm to 25 mm (Fig. 4). The same tungsten collimator and the point source were used to assess the decoding accuracy of the prototypical MSR detector. The tungsten collimator was set up with its slit perpendicular to the axial of the MSR detector. The MSR detector was fixed tightly on the displacement platform with a kinematic accuracy of 0.03mm/10mm. The displacement platform moved the MSR detector up at 1 mm per step from 1 mm to 25 mm. In the same way, when a single event was triggered, energy signals from all 92 SiPMs were measured and transmitted to the host PC.
Fig. 4.
(a) Illustrations of the experimental settings to assess the decoding accuracy of the MSR detector in the Z direction. (b) The structure of the ANN. It has one input layer with 27 inputs, one hidden layer with 20 nodes, and one output layer.
To decode the positions of the gamma interactions in the Z direction, we used a feedforward artificial neural network (ANN) with one hidden layer, which is a toolkit in Matlab. The train function was Levenberg–Marquardt algorithm. 16,000 sets of light distributions were selected at each collimation position. 30% of them were used to train the ANN and 70% of them were used to evaluate the decoding performance of the trained ANN. As shown in Fig. 4b, the ANN had one input layer with 27 inputs, one hidden layer with 20 neurons, and one output layer. The 27 inputs were: the index of the SiPM with the maximum energy signal on the side-A ring, 13 SiPM energy signals from the side-A ring, and 13 SiPM energy signals from the side-B ring. The 13 SiPM energy signals were chosen from the SiPM with the maximum signal, the 6 SiPMs to its left, and the 6 to its right.
2.5. Initial imaging experiment
The prototype MSR PET detector constructed in this study is essentially a single ring PET imager with a limited axial field of view (axial FOV: 25mm). An initial experiment has been performed to demonstrate the feasibility of imaging with the MSR PET detector. A hot-rod Derenzo phantom was used to evaluate the image quality obtained with the scanner. The list mode data was preprocessed with attenuation correction, and reconstructed with the full 3D maximum likelihood expectation maximization (MLEM) algorithm with 50 iterations. Corrections for random and scatter coincidences, and normalization were not included in the reconstruction.
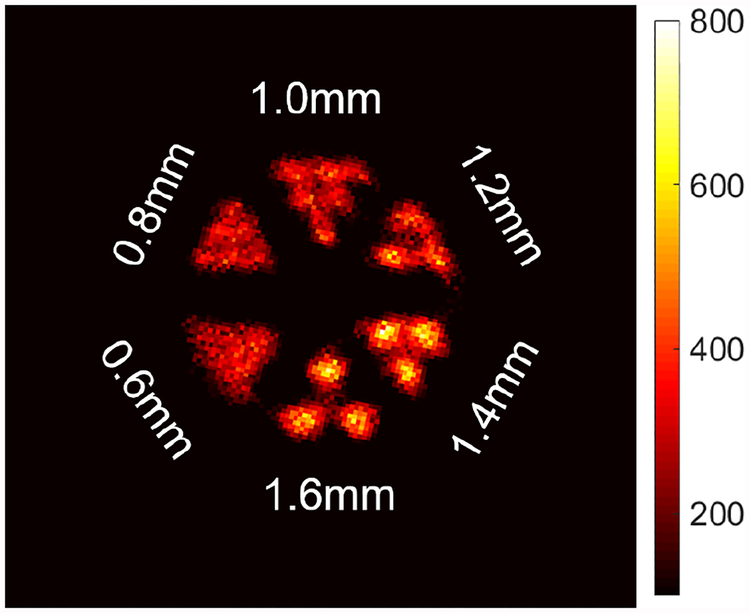
The phantom contained six sectors with rods of different diameters (0.6, 0.8, 1.0, 1.2, 1.4 and 1.6 mm respectively). The distance between the centers of the rods was two times the rod diameter. The phantom was filled with 3.7 MBq of 18F-FDG and placed in the field of view (FOV) of the scanner. Data were collected about 120 minutes, and 4.5 million coincidence events were used.
3. Results
3.1. Typical signals and energy resolution
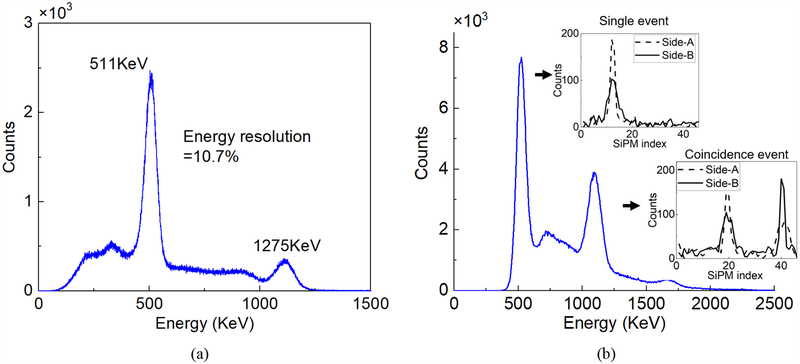
In the MSR scanner, the scintillating photons can be reflected many times and travel around the ring. The critical angle between a LYSO scintillator (refractive index n=1.82) and the air (n=1) is 33.7°. Theoretical calculation shows that in our prototypical MSR ring (where H=25.1 mm), most of the scintillating photons would be detected by 6~8 adjacent SiPMs with an arc length of 21.7 mm~28.9 mm. The typical energy signals measured by the two rings in a single event and a coincidence event are shown in Fig. 5b respectively. The measured energy signals represent the distribution of the scintillating photons at the side-A and side-B of the MSR detector. The position and the shape of the peaks correspond to the θ coordinate and the Z coordinate of the interaction respectively.
Fig. 5.
(a) The energy spectrum of collimation data at the circumferential direction. (b) The energy spectrum of the hot-rod Derenzo phantom filled with the 18F-FDG liquid source, and placed inside of the MSR.
Fig. 5a shows the energy spectrum of a 22Na point source based on the collimation data at the Z direction. First, SiPM with the highest average energy was selected at each collimation step. Second, the single events that the peak of light distributions were located on those SiPMs were picked out. Third, we summarized all selected events and calculated the energy spectrum. The MSR detector was proved to have an outstanding energy resolution of 10.7% at the peak of 511keV. Fig. 5b shows the energy spectrum of the hot-rod Derenzo phantom filled with 18F-FDG liquid source (100μCi) and placed inside of the MSR. The energy spectrum was calculated by adding together the energy signals measured by all the SiPMs. The energy resolution was 12.3% for the peak of single events, and 11.4% for the peak of coincidence events. Note that we used the first method for deploying the photosensors and covered the internal and external walls of the MSR with ESR reflectors, and reading the distribution of the scintillating photons on the two sides of the ring by using two rings of SiPMs. The width of the SiPM (3.16 mm) was smaller than the thickness of the MSR ring (5 mm). This means that part of the crystal surface was not covered by SiPMs, thus forming the ‘dead zone’ for the photons. Better energy resolution and decoding accuracy might be expected if the width of the SiPM ring was increased to 5 mm to cover the whole side-A and side-B surfaces of the MSR ring.
3.2. Decoding in the circumferential direction
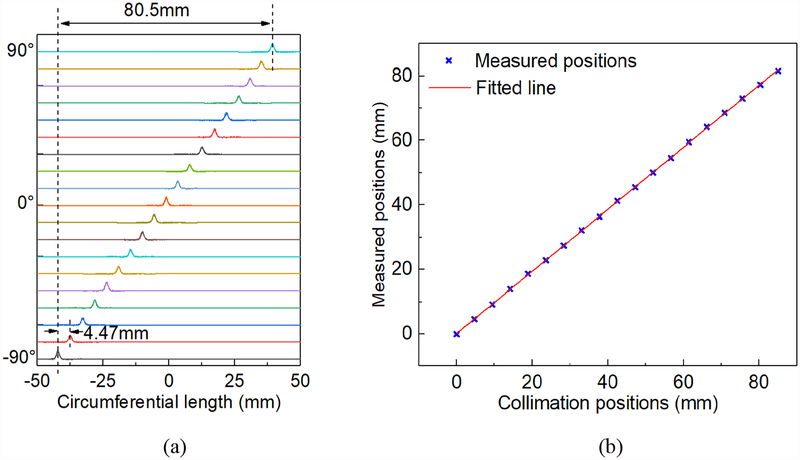
Fig. 6a shows the histograms of all the positions of the gamma interactions in θ the direction. The histograms were shifted up in the y-axis in order to display results from all steps in one plot. The corresponding position shift (the circumferential length) per step was 4.47 mm. The circumferential length was defined as arc length between the two interaction positions:
| (4) |
where Δθ was the angle difference of the interaction positions, and rc was the known radius of interaction positions, which were set as 25.6mm, since the wall thickness of the MSR detector was 5 mm.
Fig. 6.
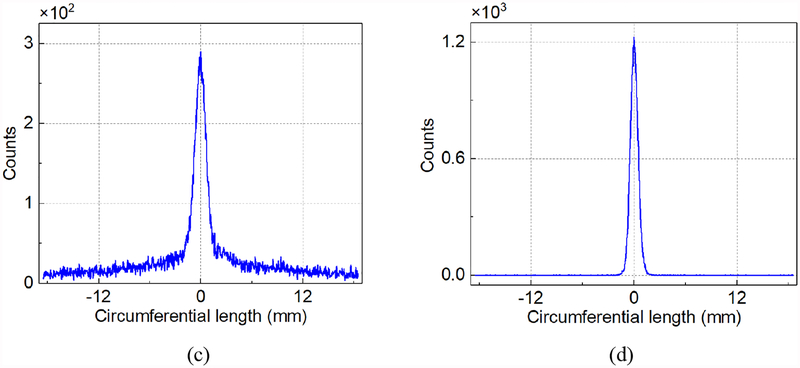
(a) The histograms of the positions of the gamma interactions in the θ direction at the step of 10°. (b) The mean of measured positions. (c) A typical histogram of the positions of the gamma interactions in the θ direction, calculated by the average of PA and PB. (d) A typical histogram of Pd.
Fig. 6b shows the mean of the measured positions in each step and the fitted line. Excellent linearity was achieved. The differences between the collimation positions and the mean of the measured positions were smaller than 0.4 mm. Fig. 6c shows a typical histogram of the positions of the gamma interactions in the θ direction, calculated by the average position from the side-A and side-B rings (PA and PB). We calculated the full-width-half-maximum (FWHM) and MAE of the 19 histograms and the distribution of the FWHMs across 19 steps. The mean and standard deviations (STD) of the FWHMs and MAEs were 1.44 mm ± 0.09 mm and 0.65 mm ± 0.02 mm respectively. Fig. 6d shows a typical histogram of Pd, which was defined as half of the difference between the positions calculated from the side-A and side-B rings. The intrinsic resolution in the θ direction was represented by the FWHMs and MAEs of the 19 positions of Pd. The mean and STD of the intrinsic FWHMs and MAEs across 19 positions were 0.94 mm ± 0.05 mm and 0.34 mm ± 0.01 mm respectively.
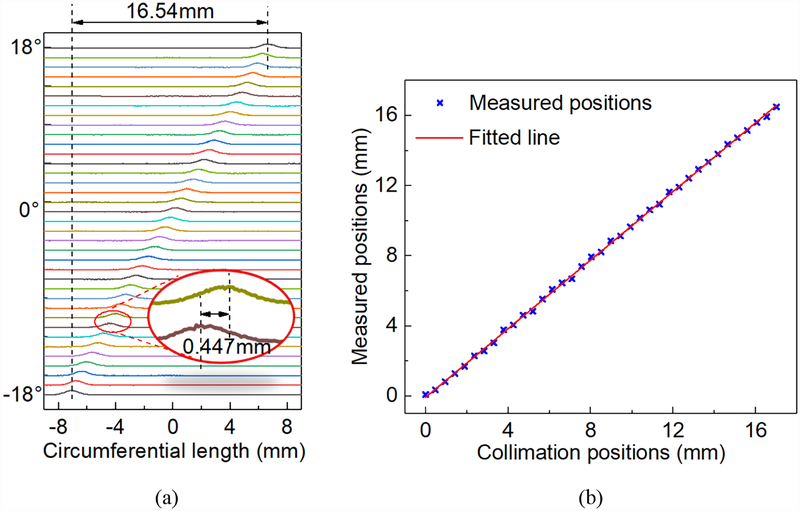
In the second experiment, the rotation platform rotated the MSR detector at 1° per step from − 18° to 18°. Fig. 7a shows the histograms of all the 37 positions of the gamma interactions. The corresponding position shift per step was 0.447 mm. Fig. 7b shows the mean of the measured positions in each step and the fitted line. The differences between the collimation positions and the mean of the measured positions were smaller than 0.15 mm. The mean and the STD of the FWHMs and MAEs of the measured positions were 1.48 mm ± 0.07 mm and 0.64 mm ± 0.02 mm respectively. The mean and the STD of the intrinsic FWHMs and MAEs across 37 positions were 0.91 mm ± 0.01 mm and 0.33 mm ± 0.002 mm respectively.
Fig. 7.
(a) The histograms of the positions of the gamma interactions in the θ direction at the step of 1°. (b) The mean of measured positions at the step of 1°.
3.3. Analysis of circumferential parallax
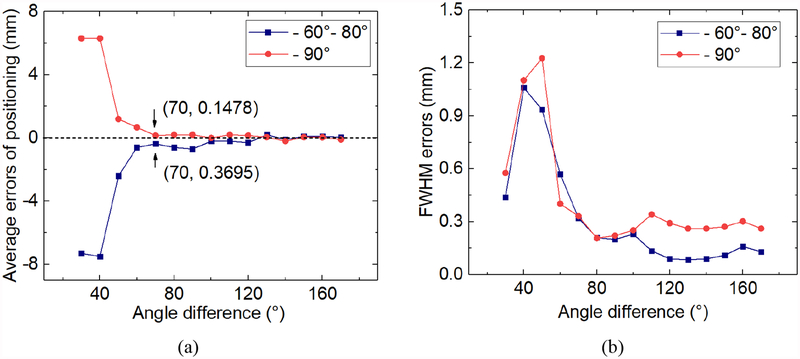
Fig. 8 shows the error between the actual LOR and the measured LOR with the angle difference (Δθ) of 50 °, 70 ° and 100 °. The LOR error is the angle and positional deviation between the measured LOR and the actual LOR. When Δθ increases, the LOR error decreases. When the Δθ was bigger than 70 °, there was almost no LOR error. Fig. 9a shows the average positioning error of the interactions. The average positioning error in θ direction was less than 0.37 mm when Δθ was bigger than 70 °, i.e. the FOV was 39.7mm. Fig. 9b shows the change in the FWHMs error of interaction positioning, which was the absolute difference between the FWHM of single events and coincidence events. The average FWHM increased slightly from ~0.9 mm to ~1.1 mm because of photon interferences when Δθ was bigger than 70 °.
Fig. 8.
(a) The errors between the actual LORs and the measured LORs. (a) Δθ = 50°; (b) Δθ = 70°; (c) Δθ = 100°.
Fig. 9.
(a) The average error of the interaction positions. (b) The FWHM error of the interaction positions.
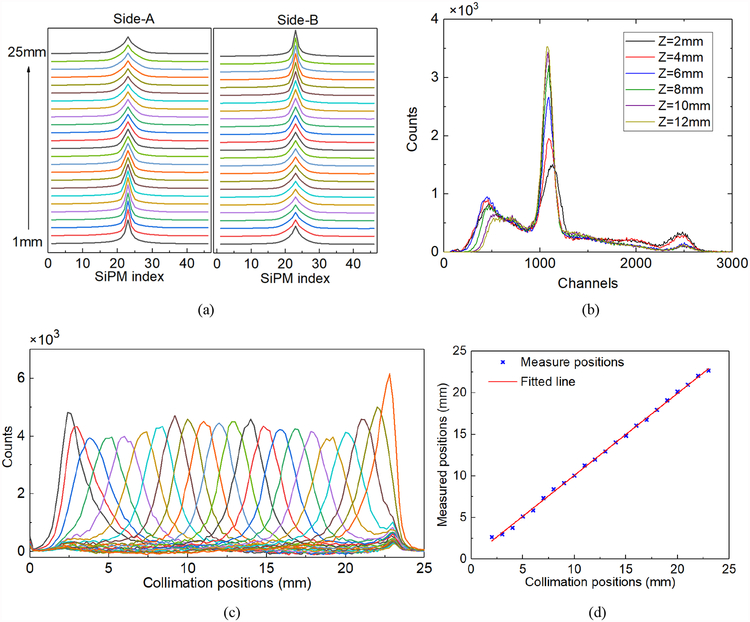
3.4. Decoding in axial direction
Fig. 10a shows the average light distribution at different collimation positions, which is averaged energy signals measured by side-A and side-B SiPM rings:
| (5) |
| (6) |
where N is the number of valid single events at the collimation positions, and Di_A (Di_B) is the energy distribution of per single event at side-A (side-B) SiPM rings. The peak positions of the energy signals on the SiPMs were aligned before averaging. The closer the position of the gamma interactions to the side-A/side-B SiPM rings, the sharper and narrower the distributions of the scintillating photons (or energies) measured by that SiPM rings will be. Thus, we used light distribution to decode the positions of the gamma interactions in Z direction. Fig. 10b shows the energy spectrums at different axial collimation positions. The relative light outputs are 100%, 96.5%, 96.5%, 96.5%, 95.6%, and 94.7%, and the energy resolutions are 16.8%, 12.1%, 10.9%, 10.7%, 10.5%, and 11.2% when the collimation position moves from 2 mm to 12 mm. It can be inferred that the light output contributes to axial decoding, especially when the interaction position is close to one of the SiPM rings. It should be noted that the energy spectrums are not corrected for saturation effects of SiPMs. An event that occurs at axial extremes of scanner may well produce signals so high that SiPM saturation becomes an issue. The difference in light output will increase when saturation correction is applied and it will contribute to axial decoding.
Fig. 10.
(a) The averaged energy signals measured by side-A SiPM ring and side-B SiPM ring. (b) The energy spectrums at different axial collimation positions. (c)The histograms of the 22 decoded positions in the Z direction. (d) The mean of the measured positions and the fitted line.
Fig. 10c shows the histograms of the 22 decoded positions in the Z direction ranging from 2 mm to 23 mm. Fig. 10d shows the mean of the measured positions in each step and the fitted line. The differences between the collimation positions and the mean of the measured positions were smaller than 0.8mm. The mean and the STD of the FWHMs and MAEs were 2.45 mm ± 0.48 mm and 1.08 mm ± 0.16 mm respectively. Note that the variance of the position measurements in the Z direction (s′ measured) also has two components: s′col and s′int. s′col is the variance introduced by the non-ideal collimator with a 0.5 mm slit. σ′int is the intrinsic variance of the MSR detector and the ANN method. However, the width of the slit in the collimator (0.5 mm) is much smaller than the mean of the FWHM (2.45 mm). Thus, the difference between s′ measured and s′int is small.
3.5. Initial imaging
Fig. 11 shows a sum of the four middle slices of the 18F-FDG hot-rod phantom at the energy window of 950–1300 KeV without the compensation of circumferential parallax. The θ coordinates were calculated by the mean position from side-A and side-B rings. The reconstructed matrix is 180 × 180 × 25 with a voxel size of 0.25 mm × 0.25 mm × 1 mm based on the positioning accuracy of gamma photons and the size of MSR detector. The peak-valley ratio of 1mm rods is 1.95. For images acquired with the prototype, rods with a diameter of as low as 1.2 mm can be resolved.
Fig. 11.
The reconstructed image of a hot-rod Derenzo phantom.
4. Discussion
The maximum diameter and the length of LYSO boules grown using the Czochralski method (Mao et al 2013) are about 100 mm and 250 mm respectively. Thus, it is theoretically possible to fabricate a hollow MSR of up to about 80 mm in diameter, 10 mm thick and 240 mm long. Alternately, one could combine a few shorter MSR rings to construct a ring with a long axial FOV. For example, a system with a 100.4 mm axial FOV could be constructed by combining four of our prototypical MSR rings (each 25.1 mm in length). Conceptually, MSR technology could even be applied to the construction of full-scale clinical PET systems. Even though there are still difficulties of fabricating a whole ring with a diameter of about 750 mm using LYSO boules grown through the Czochralski method, it is possible to assemble multiple arc segments to construct a whole ring. This study gives a preliminary notion for constructing the MSR ring approach up to this scale.
There are a few different ways of deploying the photosensors for the MSR scanner (Xie et al 2017). The first method is to couple one photosensor ring on one of sides of the MSR, or two photosensors rings on both sides of the MSR, while covering the rest of the surfaces with reflectors. This method normally uses fewer photosensors and it can decode the positions of gamma interactions in θ direction and the Z direction. The second method is to couple photosensors on the inner or outer surfaces of the MSR ring and cover the rest of the surfaces with reflectors. The third method is to combine the first and the second method to couple photosensors across most or even all the surfaces. Significantly, this method uses more photosensors but has the potential to achieve better position decoding accuracy across three directions (the θ direction, the Z direction, and the radius direction). Schematically, we used the first scenario to validate the MSR design.
In this study, the performance of the detector of the monolithic ring was assessed in terms of energy resolution and decoding performance in both θ and z directions. The sensitivity of a PET scanner is determined by the detector efficiency and the solid angle. The MSR detector has a 100% filling factor (not including the photosensors and readout electronics). Thus, it has a higher detector efficiency than that of the counterpart detectors constructed with discrete crystals 5 mm in length. Note that the prototype MSR PET detector constructed in this study is essentially a single ring PET imager with a short axial FOV (25 mm) and a thin wall (5 mm). It is expected to have a low system sensitivity. A system with a larger axial FOV and a higher sensitivity can be constructed conveniently using multiple MSR detectors.
It is unnecessary to measure the depth of interaction (DOI) in the prototype MSR detector, since it is only 5 mm in thickness. For the MSR detector with a much thicker wall, the SiPMs could be coupled on the inner or outer surfaces of the MSR ring. That may allow us to calculate the DOI in the radius direction using the distribution of the scintillating photons measured on the walls.
There are some potential drawbacks in an imager constructed with MSR detectors. In a conventional PET imager, the scintillating photons do not travel across the block detectors. The single events occurred in different block detectors are triggered independently and their timings are measured independently too. However, light signals generated by different single events in the MSR detector may partially overlap with each other. And their timing measurements may interfere with each other too. The electronics system used in this study is capable of measuring both the energy and the timing from all 92 SiPM channels individually and simultaneously. Thus, it is possible to use those information to compensate the timing measurements. However, that might not be necessary for an animal PET which does not require a high timing resolution.
Another potential issue of an imager constructed with MSR detectors is the system’s count-rate performance characteristics when a higher dose is used. In the conventional PET imagers constructed with block detectors, the maximum single count rate (MSCR) is limited in order to minimize the effects of the event pileup in the detectors. Similarly, the MSCR of a MSR detector is also limited by pileup effects. Theoretically, the MSCR of the MSR imager is a factor of (N/2) lower compared with the conventional PET imager constructed with N block detectors using the same volume of scintillators. This issue can be mitigated by shortening the axial length of the MSR detectors to reduce the volume of the scintillators. The drawback of reducing the axial length is that more MSR detectors are required in order to keep the axial FOV and the system sensitivity. Next, we will perform the NEMA study to quantitatively assess the count-rate performance characteristics of the MSR imager.
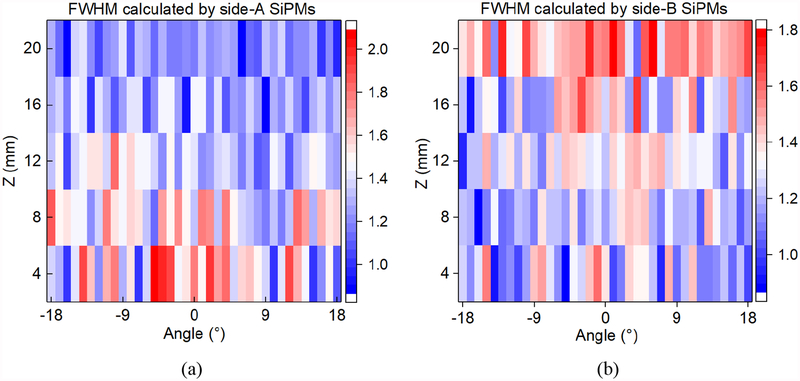
The interaction positions at θ direction were calculated by the mean position from side-A and side-B SiPMs. However, in fact, it may not be the best algorithm. We attempted to calculate the θ coordinates of the events at different collimation positions using side-A and side-B respectively, as shown in Fig. 12. The mean FWHMs were 1.22mm, 1.21mm, 1.31, 1.30mm, and 1.49mm calculated by side-A SiPMs (Fig. 12a), 1.51mm, 1.49mm, 1.36mm, 1.27mm, and 1.21mm calculated by side-B SiPMs (Fig. 12a) when the axial collimation position ranges from 4mm to 20mm. The further away the interaction position is from the side-A (side-B) SiPM ring, the larger the error of the θ coordinates calculated by side-A (side-B) SiPM ring will be. It contributes to improving the accuracy of θ coordinates in the future. However, it needs to improve the accuracy in the axial direction first.
Fig. 12.
The FWHM of events at different collimation positions calculated by side-A SiPMs (a) and side-B SiPMs (b).
5. Conclusion
In this study, we have constructed the first preclinical PET scanner with a monolithic scintillator ring and evaluated its basic performance in terms of energy resolution, decoding accuracy. An initial imaging experiment has been performed to demonstrate the feasibility of imaging with a single MSR PET detector. Next, we will comprehensively investigate the imaging performance of the scanner constructed with one or multiple MSR PET detectors using the NEMA protocol. Animal experiments will be conducted to evaluate the performance of the MSR scanner across a wider set of test conditions. For example, we intend to perform mobility imaging experiments that allow freedom of movement.
Acknowledgements
This work was supported by the National Natural Science Foundation of China (51627807) and the National Natural Science Foundation-Guangdong Joint Funds of China (U1501256). We sincerely thank the Micro and Nano Fabrication and Measurement Laboratory of Mechanical Science and Engineering in Huazhong University of Science and Technology.
References:
- Xie S, Zhao Z, Yang M, et al. 2017. LOR-PET: a novel PET camera constructed with a monolithic scintillator ring[C]//2017 IEEE Nuclear Science Symposium and Medical Imaging Conference (NSS/MIC). IEEE, 2017: 1–3. [Google Scholar]
- Adam L, Karp JS, Daube-Witherspoon ME, Smith RJ. 2001. Performance of a Whole-Body PET Scanner Using Curve-Plate NaI(Tl) Detectors. The Journal of Nuclear Medicine 42:1821. [PubMed] [Google Scholar]
- Aguilar A, Gonzalez-Montoro A, Gonzalez AJ, Hernandez L, Monzo JM, et al. 2016. Pilot tests of a PET detector using the TOF-PET ASIC based on monolithic crystals and SiPMs. J INSTRUM 11 [Google Scholar]
- Berg E, Cherry SR. 2018. Innovations in Instrumentation for Positron Emission Tomography. SEMIN NUCL MED 48:311–31 [DOI] [PMC free article] [PubMed] [Google Scholar]
- Bieniosek MF, Cates JW, Levin CS. 2016. A multiplexed TOF and DOI capable PET detector using a binary position sensitive network. PHYS MED BIOL 61:7639–51 [DOI] [PMC free article] [PubMed] [Google Scholar]
- Britt CJ, Maas AM, Kennedy TA, Hartig GK. 2018. Incidental Findings on FDG PET/CT in Head and Neck Cancer. OTOLARYNG HEAD NECK 158:484–8 [DOI] [PubMed] [Google Scholar]
- Cabello J, Etxebeste A, Llosa G, Ziegler SI. 2015. Simulation study of PET detector limitations using continuous crystals. PHYS MED BIOL 60:3673–94 [DOI] [PubMed] [Google Scholar]
- Casella C, Heller M, Holme O, Joram C. 2013. 42: Usage of long axial crystals for PET applications: the AX-PET demonstrator and beyond. RADIOTHER ONCOL 110:S21 [Google Scholar]
- Cherry SR. 2004. In vivo molecular and genomic imaging: new challenges for imaging physics. PHYS MED BIOL 49:R13–48 [DOI] [PubMed] [Google Scholar]
- Deroose CM, De A, Loening AM, Chow PL, Ray P, et al. 2007. Multimodality imaging of tumor xenografts and metastases in mice with combined small-animal PET, small-animal CT, and bioluminescence imaging. J NUCL MED 48:295–303 [PMC free article] [PubMed] [Google Scholar]
- Hoh CK. 2007. Clinical use of FDG PET. NUCL MED BIOL 34:737–42 [DOI] [PubMed] [Google Scholar]
- Hsu DFC, Freese DL, Reynolds PD, Innes DR, Levin CS. 2018. Design and Performance of a 1 mm(3) Resolution Clinical PET System Comprising 3-D Position Sensitive Scintillation Detectors. IEEE T MED IMAGING 37:1058–66 [DOI] [PubMed] [Google Scholar]
- Mao R, Wu C, Dai L, Lu S. 2013. Crystal growth and scintillation properties of LSO and LYSO crystals. J CRYST GROWTH 368:97–100 [Google Scholar]
- Mikhaylova E, Tabacchini V, Borghi G, Mollet P, D’Hoe E, et al. 2017. Optimization of an ultralow-dose high-resolution pediatric PET scanner design based on monolithic scintillators with dual-sided digital SiPM readout: a simulation study. PHYS MED BIOL 62:8402–18 [DOI] [PubMed] [Google Scholar]
- Moses WW. 2011. Fundamental limits of spatial resolution in PET. NUCL INSTRUM METH A 648S1:S236–40 [DOI] [PMC free article] [PubMed] [Google Scholar]
- MOSES WW, DERENZO SE. 1993. EMPIRICAL OBSERVATION OF RESOLUTION DEGRADATION IN POSITRON EMISSION TOMOGRAPHS UTILIZING BLOCK DETECTORS. J NUCL MED 34S:P101 [Google Scholar]
- Myers R 2001. The biological application of small animal PET imaging. NUCL MED BIOL 28:585–93 [DOI] [PubMed] [Google Scholar]
- Ohira H, Mc Ardle B, Cocker MS, DeKemp RA, DaSilva JN, Beanlands RS. 2013. Current and Future Clinical Applications of Cardiac Positron Emission Tomography. CIRC J 77:836–48 [DOI] [PubMed] [Google Scholar]
- Portnow LH, Vaillancourt DE, Okun MS. 2013. The history of cerebral PET scanning From physiology to cutting-edge technology. NEUROLOGY 80:952–6 [DOI] [PMC free article] [PubMed] [Google Scholar]
- Santangelo PJ, Rogers KA, Zurla C, Blanchard EL, Gumber S, et al. 2015. Whole-body immunoPET reveals active SIV dynamics in viremic and antiretroviral therapy-treated macaques (vol 12, pg 427, 2015). NAT METHODS 12:893. [DOI] [PMC free article] [PubMed] [Google Scholar]
- Shi S, Chen F, Goel S, Graves SA, Luo H, et al. 2018. In Vivo Tumor-Targeted Dual-Modality PET/Optical Imaging with a Yolk/Shell-Structured Silica Nanosystem. NANO-MICRO LETT 10 [DOI] [PMC free article] [PubMed] [Google Scholar]
- Singhal T 2012. Positron Emission Tomography Applications in Clinical Neurology. SEMIN NEUROL 32:421–31 [DOI] [PubMed] [Google Scholar]
- Song TY, Wu H, Komarov S, Siegel SB, Tai YC. 2008. A sub-millimeter resolution PET detector module using a multi-pixel photon counter array. Physics in Medicine & Biology 55:2573–87 [DOI] [PMC free article] [PubMed] [Google Scholar]
- Thunemann M, Schörg BF, Feil S, Lin Y, Voelkl J, et al. 2017. Cre/lox-assisted non-invasive in vivo tracking of specific cell populations by positron emission tomography. NAT COMMUN 8 [DOI] [PMC free article] [PubMed] [Google Scholar]
- Toyama H, Ichise M, Liow JS, Vines DC, Seneca NM, et al. 2004. Evaluation of anesthesia effects on [F-18]FDG uptake in mouse brain and heart using small animal PET. NUCL MED BIOL 31:251–6 [DOI] [PubMed] [Google Scholar]
- Xie S, Chen J, Yang M, Shi H, Peng Q, Xu J. 2017. A gamma-photon detector based on liquid light guide for whole-body PET. J INSTRUM 12 [Google Scholar]
- Yamasaki T, Fujinaga M, Mori W, Zhang Y, Wakizaka H, et al. 2017. In Vivo Monitoring for Regional Changes of Metabotropic Glutamate Receptor Subtype 1 (mGluR1) in Pilocarpine-Induced Epileptic Rat Brain by Small-Animal PET. SCI REP-UK 7 [DOI] [PMC free article] [PubMed] [Google Scholar]
- Yang Y, Bec J, Zhou J, Zhang M, Judenhofer MS, et al. 2016. A Prototype High-Resolution Small-Animal PET Scanner Dedicated to Mouse Brain Imaging. J NUCL MED 57:1130–5 [DOI] [PMC free article] [PubMed] [Google Scholar]
- Zhang X, Wang X, Ren N, Kuang Z, Deng X, et al. 2017. Performance of a SiPM based semi-monolithic scintillator PET detector. PHYS MED BIOL 62:7889–904 [DOI] [PubMed] [Google Scholar]
- Zhao Z, Huang Q, Gong Z, Su Z, Moses WW, et al. 2017. A Novel Read-Out Electronics Design Based on 1-Bit Sigma-Delta Modulation. IEEE T NUCL SCI 64:820–8 [Google Scholar]
- Zhao Z, Xie S, Zhang X, Yang J, Huang Q, et al. An Advanced 100-Channel Readout System for Nuclear Imaging. IEEE T INSTRUM MEAS:1–11 [DOI] [PMC free article] [PubMed] [Google Scholar]


