

Abstract
The analysis of time‐varying activity and connectivity patterns (i.e., the chronnectome) using resting‐state magnetic resonance imaging has become an important part of ongoing neuroscience discussions. The majority of previous work has focused on variations of temporal coupling among fixed spatial nodes or transition of the dominant activity/connectivity pattern over time. Here, we introduce an approach to capture spatial dynamics within functional domains (FDs), as well as temporal dynamics within and between FDs. The approach models the brain as a hierarchical functional architecture with different levels of granularity, where lower levels have higher functional homogeneity and less dynamic behavior and higher levels have less homogeneity and more dynamic behavior. First, a high‐order spatial independent component analysis is used to approximate functional units. A functional unit is a pattern of regions with very similar functional activity over time. Next, functional units are used to construct FDs. Finally, functional modules (FMs) are calculated from FDs, providing an overall view of brain dynamics. Results highlight the spatial fluidity within FDs, including a broad spectrum of changes in regional associations, from strong coupling to complete decoupling. Moreover, FMs capture the dynamic interplay between FDs. Patients with schizophrenia show transient reductions in functional activity and state connectivity across several FDs, particularly the subcortical domain. Activity and connectivity differences convey unique information in many cases (e.g., the default mode) highlighting their complementarity information. The proposed hierarchical model to capture FD spatiotemporal variations provides new insight into the macroscale chronnectome and identifies changes hidden from existing approaches.
Keywords: brain dynamic, functional domain, functional module, high‐order independent component analysis, intrinsic activity, resting state fMRI, schizophrenia, spatial domain state, spatial dynamics
1. INTRODUCTION
Neuronal populations interact with each other at different spatial scales (from micro to macro). At the macroscale, studying functional interactions using functional magnetic resonance imaging (fMRI) has significantly enhanced our knowledge of brain functional systems. Examining functional connectivity across the brain using univariate and multivariate analyses has revealed replicable, large‐scale brain networks, also known as functional domains (FDs). Alterations of FDs may be significantly associated with different physiological and psychological conditions (Arbabshirani, Plis, Sui, & Calhoun, 2017; Garrity et al., 2007; Greicius, 2008; Iraji et al., 2015; Menon, 2011; Seeley, Crawford, Zhou, Miller, & Greicius, 2009; Sorg et al., 2007). Each FD is comprised of a set of spatially distinct and temporally covarying functional units (sub‐networks), which putatively orchestrate various brain functions (van den Heuvel & Hulshoff Pol, 2010). A functional unit can be defined as a pattern of regions with very similar functional activity over time given the associated imaging modality. Hierarchical models of brain function posit that the brain has different levels of functional granularity, where lower levels are associated with reduced complexity. In other words, lower levels of the hierarchy display less functional dynamic behavior and higher functional homogeneity (Blumensath et al., 2013; Felleman & Van Essen, 1991; Meunier, Lambiotte, & Bullmore, 2010; Zhou, Zemanova, Zamora, Hilgetag, & Kurths, 2006).
At the same time, given the dynamic nature of the brain, recent studies have focused on capturing the time‐varying information of the blood oxygenation‐level dependent (BOLD) signal (Calhoun, Miller, Pearlson, & Adali, 2014; Hutchison et al., 2013; Preti, Bolton, & Van De Ville, 2017). Several strategies have been proposed to study time‐varying information of BOLD signal, but most can be divided into one of two major categories. The first identifies reoccurring temporal coupling among fixed spatial nodes/networks (Allen et al., 2014; Barttfeld et al., 2015; Chen, Cai, Ryali, Supekar, & Menon, 2016; Damaraju et al., 2014; Hutchison et al., 2013; Leonardi et al., 2013; Sakoglu et al., 2010; Shine, Koyejo, & Poldrack, 2016; Yaesoubi, Adali, & Calhoun, 2018). The most common approach for this category is the sliding‐window technique (Allen et al., 2014; Sakoglu et al., 2010). The second category extracts the moment‐to‐moment dominant spatial co‐activation or connectivity pattern without capturing the spatiotemporal variations within and between functional organizations (Karahanoglu & Van De Ville, 2015; Liu, Chang, & Duyn, 2013; Liu & Duyn, 2013; Preti & Van De Ville, 2017; Tagliazucchi, Balenzuela, Fraiman, & Chialvo, 2012; Trapp, Vakamudi, & Posse, 2018; Vidaurre, Smith, & Woolrich, 2017). The co‐activation patterns (CAPs) approach and its derivatives are used most frequently within this category (Karahanoglu & Van De Ville, 2015; Liu et al., 2013). However, these approaches do not capture the ongoing spatial variations of brain functional organization, such as FDs, over time. These approaches are not dissimilar to EEG microstate analyses, which identify global stable spatial states over time (space × time). Microstate EEG studies could benefit from this work by adding another dimension (i.e., functional organization) and identify microstates for individual functional organizations (space × time × functional organization) (Khanna, Pascual‐Leone, Michel, & Farzan, 2015; Koenig et al., 2002; Lehmann, Strik, Henggeler, Koenig, & Koukkou, 1998).
In early work, Kiviniemi et al. (2011) used sliding‐window ICA and observed spatial variations in the default mode network. Different spatial patterns were also observed for CAPs of the posterior cingulate cortex and the intraparietal sulcus over time (Liu & Duyn, 2013). Ma, Calhoun, Phlypo, and Adali (2014) shows fluctuations in spatial couplings by measuring residual mutual information between spatial components derived from independent vector analysis (IVA). These findings justify the need for an approach to measure variations in spatial patterns of brain functional organization over time. Additionally, given that the brain reorganizes its activity at different interacting spatial and temporal scales, investigating spatial dynamics (spatiotemporal variations) within and between different spatial scales provides a broader perspective of how the brain functions naturally. Here, we propose a novel, data‐driven approach to capture and characterize both the spatiotemporal variations of FDs and the dynamic interactions between them. The approach utilizes the concept of the functional hierarchy and encapsulates the spatiotemporal variations of each FD from its associated functional units. We suggest high‐order intrinsic connectivity networks (hICNs) obtained from a high‐order spatial independent component analysis (ICA) are good approximations of functional units of macroscale brain communication.
Using hICNs, we construct the elements of the higher hierarchical level (i.e., FDs) and study their spatial dynamics. Our findings highlight that FDs evolve spatially over time, (i.e., spatially vary over time). We characterize highly reproducible and distinct activity patterns called spatial domain states, within each FD. At various times, the interactions within and between FDs involve different spatial regions of the brain. Furthermore, evaluating the associations between FDs (i.e., functional state connectivity) identified distinct coupling patterns, called functional modules (FMs). FMs represent the transient patterns of temporal coupling between FDs and provide information of global brain temporal dynamics. One key advantage of the approach is its ability to successfully capture spatiotemporal changes of FDs, without applying constraints on their spatial and/or temporal couplings. The approach does not require a sliding‐window technique, so it can capture the maximum temporal frequency variations in the temporal profile (Yaesoubi et al., 2018). Furthermore, it allows the detection of fluctuations in the spatial coupling of FDs up to the maximum spatial resolution of the data.
We further evaluate the clinical utility of our approach by studying alterations in spatial dynamics within patients with schizophrenia (SZ) relative to healthy controls. Schizophrenia is a functionally heterogeneous disorder which can include delusions, hallucinations, disorganized speech, disorganized or catatonic behavior, and negative symptoms (e.g., apathy, blunted affect; American Psychiatric Association, 2013). It has been suggested that schizophrenia is related to a reduced capacity to integrate information across different regions (Kahn et al., 2015; Stephan, Baldeweg, & Friston, 2006), which can lead to reduced functional connectivity (Damaraju et al., 2014; Kahn et al., 2015). However, previous work does not provide much information regarding how this reduced integration manifests. The application of our hierarchical approach to study the spatial dynamics of FDs could potentially identify underlying mechanisms that define how patients with SZ integrate information. Furthermore, the approach has the unique ability to not only detect nuanced transient alterations in the spatial patterns of FDs, whereas previous functional connectivity analyses report hypoconnectivity among patients with SZ, our approach is in line with this trend, but also detects transient reductions in the functional activity within specific FDs. Importantly, alterations in functional activity can occur in the absence of changes in functional connectivity and vice versa suggesting the complementarity of these two phenomena. Furthermore, functional state connectivity, measured for the first time, displayed similar but also distinct differences between healthy controls and patients with SZ compared to previous functional connectivity analyses, including: decreased functional state connectivity between subcortical and somatosensory and somatomotor domains within the FMs.
In summary, we introduce an innovative framework to shed new light on time‐varying spatial characteristics of brain function. The approach provides the backbone for examining spatiotemporal variations of brain functional organizations and the hierarchy of spatial dynamics which can improve our understanding of brain function. Results also show the potential of further leveraging this time‐varying behavior for characterizing mechanisms of clinical features in patient groups.
2. MATERIALS AND METHODS
2.1. Glossary and outline of the approach
There have been many terms and jargon used to define the functional architectures of the brain, for example, “network,” “circuit,” “module,” “domain,” and “system” have all been used to define the same functional structure. At the same time, each term can also refer to different functional structures across studies. For instance, the term “network” has referred to a collection of elements but at different levels from a set of anatomically separated regions to a cluster of functionally homogeneous voxels to cell‐specific regulatory pathways inside of neurons (Erhardt, Allen, Damaraju, & Calhoun, 2011; Petersen & Sporns, 2015). As described in Erhardt, Allen, et al. (2011), the way to avoid confusion is to ensure that all terms are clearly defined, thus here we provide a glossary of key terms used throughout this article (Figure 1).
High‐order intrinsic connectivity network (hICN): An hICN is composed of a set of voxels (pattern of regions) with very similar functional activity over time (high functional homogeneity) that can be approximated as one functional unit. hICNs were obtained by applying high‐order spatial ICA. The use of high‐order ICA to generate hICNs instead of predefined anatomical locations allows us to detect functionally homogeneous regions from data itself (Calhoun & de Lacy, 2017).
Functional domain (FD): An FD is a formation of functionally linked hICNs. Focusing on cortical and subcortical regions, we define nine FDs based on a priori knowledge and results of low‐order static spatial ICA. hICNs were categorized into FDs through a semi‐automatic process. FDs, at a given point in time, were reconstructed from the associated hICNs and their time courses at that time point.
State of FD: The spatial patterns of FDs vary over time due to the dynamic nature of neural activity. Spatial dynamics of FDs can be summarized as a set of spatial domain states using a clustering approach, in which each cluster (i.e., state) includes time points with a similar activity pattern.
Functional module (FM): The chronnectome occurs at different scales. At a global scale, the chronnectome can be captured by evaluating variations in temporal coupling of FDs. States of FDs that reoccur together more often than with others in a distinguishable manner are designated FMs, which are estimated using the Newman modularity detection approach.
Figure 1.
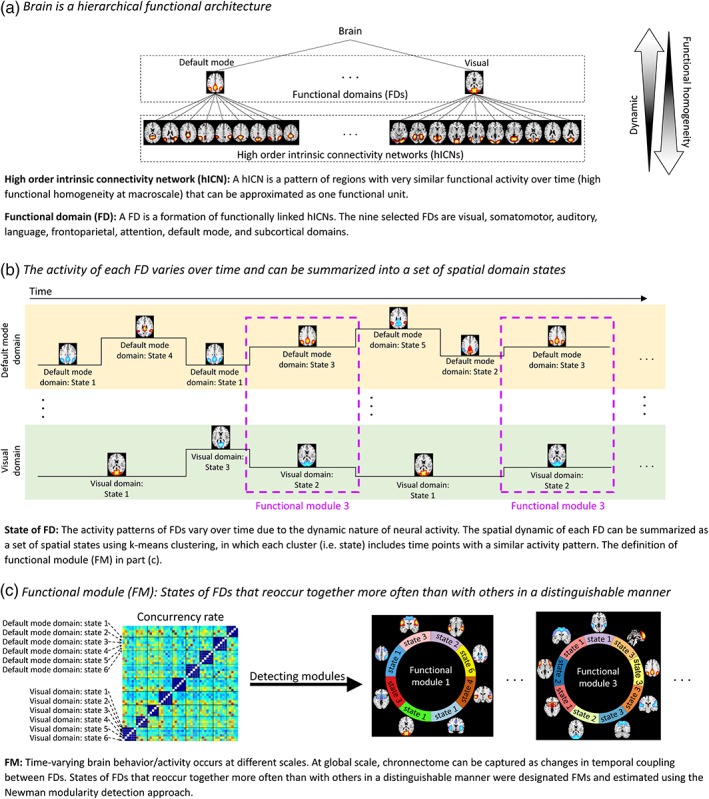
Hierarchical functional architectures of the brain and notations used in this work [Color figure can be viewed at https://wileyonlinelibrary.com]
2.2. Data acquisition and preprocessing
Data collection was performed at seven imaging sites across the United States and passed data quality control. All participants were at least 18 years old and written informed consent was given prior to enrollment. Data were collected from 160 healthy controls including 46 females and 114 males (average age: 36.71 ± 10.92; range: 19–60 years) and 149 age‐ and gender‐matched patients with SZ including 36 females and 113 males (average age: 37.95 ± 11.47; range: 18–60 years). Further details can be found in our earlier work (Damaraju et al., 2014).
MRI data were collected using a 3‐Tesla Siemens Tim Trio scanner for six of the seven sites and on 3‐Tesla General Electric Discovery MR750 scanner for the seventh site. Resting‐state fMRI data was collected using a standard gradient echo EPI sequence with following imaging parameters: pixel spacing size = 3.4375 × 3.4375 mm, FOV of 220 × 220 mm, matrix size = 64 × 64, slice thickness = 4 mm, slice gap = 1 mm, TR/TE = 2000/30 ms, flip angle = 77°, number of excitations (NEX) = 1, and acquisition time ≈ 5.4 minutes. During the resting‐state fMRI scans, participants were instructed to keep their eyes closed.
Data were preprocessed using a combination of SPM (http://www.fil.ion.ucl.ac.uk/spm/) and AFNI (https://afni.nimh.nih.gov) software packages including brain extraction, motion correction using the INRIAlign, slice‐timing correction using the middle slice as the reference time frame, and despiking using AFNI's 3dDespike. The data of each subject was subsequently registered to a Montreal Neurological Institute (MNI) template and resampled to 3 mm3 isotropic voxels, and spatially smoothed using a Gaussian kernel with a 6 mm full‐width at half‐maximum (FWHM = 6 mm). Finally, voxel time courses were z‐scored (variance normalized), as z‐scoring has displayed improved parcellation of functional organizations structures (hICNs) compared to other scaling methods for ICA analysis.
2.3. hICNs extraction
ICA analysis was applied to obtain hICNs. Group ICA was performed using the GIFT software package from MIALAB (http://mialab.mrn.org/software/gift/) (Calhoun & Adali, 2012; Calhoun, Adali, Pearlson, & Pekar, 2001). First, data dimensionality reduction was performed using subject‐specific spatial principal components analysis (PCA) followed by group‐level spatial PCA (Erhardt et al., 2011). The 200 principal components that explained the maximum variance were selected as the input for a high‐order group‐level spatial ICA to calculate 200 group independent components (Figure 2a). High‐order ICA allows us to segment the brain into a set of spatial patterns with very similar functional activity (high functional homogeneity) at the macroscale called hICNs (Allen et al., 2011; Kiviniemi et al., 2009). Infomax was chosen as the ICA algorithm because it has been widely used and compares favorability with other algorithms (Correa, Adali, & Calhoun, 2007; Correa, Adali, Li, & Calhoun, 2005). Infomax ICA was repeated 100 times. The estimated components from all runs were clustered together, and the centrotype of each cluster was selected as the “best run” as part of the ICASSO framework, which was used for further analyses (Calhoun & Adali, 2002; Calhoun, Liu, & Adali, 2009; Correa, Adali, & Calhoun, 2007; Du, Ma, Fu, Calhoun, & Adali, 2014; Himberg, Hyvarinen, & Esposito, 2004; Ma et al., 2011). Sixty‐five cortical and subcortical hICNs were selected and categorized into nine FDs based on their anatomical and common functional properties, and their relationships (spatiotemporal similarity) with independent components obtained from low‐order spatial ICA (Figure 2b). The selected hICNs should have peak activations in the gray matter and their time‐courses be dominated by low‐frequency fluctuations evaluated using dynamic range and the ratio of low‐frequency to high‐frequency power (Allen et al., 2011).
Figure 2.
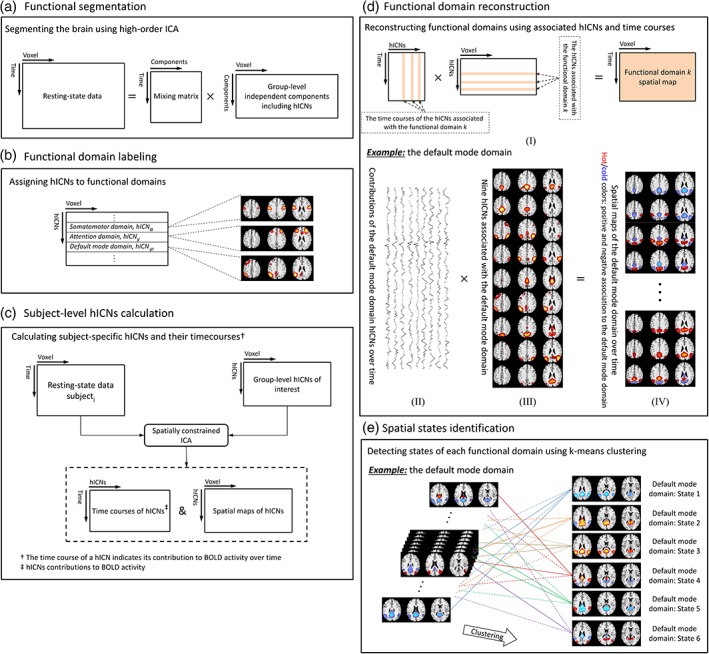
Schematic of the analysis pipeline. (a) High‐order group‐level spatial ICA (# components = 200) was applied on the processed resting‐state fMRI data from 309 individuals. (b) Sixty‐five components were identified as the high‐order intrinsic connectivity networks (hICNs) of interests and assigned to one of nine cortical and subcortical functional domains (FDs) including attention, auditory, default mode, frontal default mode, frontoparietal, language, somatomotor, subcortical, and visual domains (Figure 3). (c) Spatially constrained ICA (Lin, Liu, Zheng, Liang, & Calhoun, 2010) was used to estimate the time courses of hICNs and their spatial maps for each individual. The time course of a hICN indicates the contribution of the hICN at different time points. (d) FDs were reconstructed using the linear combination of the associated hICNs and their contributions at any given time. (e) Spatial domain states associated with each FD were estimated using k‐means clustering on the spatial maps of the FD [Color figure can be viewed at https://wileyonlinelibrary.com]
2.4. FD construction
At any given time point, FDs were constructed from the associated hICNs and their contributions as follows. First, subject‐specific hICNs and their time courses were calculated via a spatially constrained ICA approach using the group‐level hICNs as references (Figure 2c; Lin et al., 2010). The time course of each hICN describes its temporal evolution and represents its contributions to the BOLD signal over time. Next, to reduce noise, a post hoc cleaning procedure was also performed. For this purpose, various cleaning procedures were compared. The evaluated post hoc cleaning procedures include (C1) orthogonalizing with respect to estimated subject motion parameters, linear detrending, despiking, and band‐pass filtering using a fifth‐order Butterworth (0.001–0.15 Hz), (C2) replacing the Butterworth filter with a Gaussian moving average filter with different window sizes (10 × TR to 90 × TR) and keeping the rest of cleaning steps the same as the first procedure, (C3) using only a Gaussian moving average (with different window size from 10 × TR to 90 × TR), and (C4) no post hoc cleaning procedure. The cleaning procedures were also evaluated for two scenarios: (a) cleaning procedures were applied on the time courses of hICNs and (b) cleaning procedures were applied on voxel‐level after reconstructing the spatial maps of FDs. The various approaches resulted in almost identical spatial domain states (the definition of spatial domain states in Section 2.5) suggesting that post hoc cleaning procedures do not substantially alter the dynamic properties of FDs. Given the similarity of the two scenarios, we suggest utilizing the first and applying cleaning procedures on the time courses of hICNs as the computational load is much lower. C1 procedure was selected a post hoc cleaning procedure, as it is commonly used as a cleaning procedure and has previously demonstrated its effectiveness at noise reduction (Damaraju et al., 2014). Finally, after the post hoc cleaning step, each FD was reconstructed using the linear combination of the associated hICNs and their contributions at any given time point resulting in 49,749 (309 subjects × 161 time points) spatial maps for each FD (Figure 2d and Equation (1)).
| (1) |
Where FDk(t, v) is the FD k at the time point t, v is voxel index, Nk is the number of hICNs belongs to the FD k, is the hICN #ik of the FD k, and is the contribution of at the time point t.
2.5. Spatial domain states identification and verification
The spatial dynamics of FDs were captured via spatial domain states. The spatial domain states for a given FD are a set of distinct spatial patterns and can be obtained using a clustering approach (Figure 2e). Here, we used k‐means clustering, and the correlation distance metric was used as the distance function because it detects spatial patterns irrespective of voxels' intensities. The number of states (clusters) for each FD was determined using the elbow criterion by searching for the number of clusters from 3 to 15 (Damaraju et al., 2014; Yaesoubi, Miller, & Calhoun, 2017). Similar to what we have done previously (Allen et al., 2014), initial clustering was performed on a subset of the data exhibiting maximal deviation from the mean (called exemplars) and was repeated 100 times with different initializations using k‐means++ (Arthur & Vassilvitskii, 2007). Exemplars are the data points in which the amount of variance explained by either of hICNs is significantly (p < 0.001) higher than the average amount of variance explained by hICNs across the whole dataset (49,749 fMRI volumes). The estimated centroids from initial clustering using exemplar were then used as cluster center initializations to cluster the whole dataset.
We further verified the spatial domain states by evaluating the average BOLD signal of associated regions across states. In other words, we examine how well variations in the FDs reflect the underlying BOLD signal. Let us assume region j is only associated with FD k. Then, if the association of region j to FD k is positive/negative at state i, the neural activity of region j measured by the BOLD signal at the state i of FD k should be above/below its average (i.e., the average BOLD signal of region j). We expect to observe a very similar pattern of agreement between the regions' associations to FDs and their amplitude of BOLD signals even if regions are simultaneously involved in different FDs at a given spatial domain state.
2.6. Spatial dynamic evaluation
To study the spatial dynamics of FDs, we first evaluated variations in regions' associations with each FD across different spatial domain states. A voxel‐wise, one sample t test was applied to the data of each state (i.e., the spatial maps of a given FD at time points belongs to the spatial domain state), and the average t value was calculated for 246 regions of the Brainnetome atlas (Fan et al., 2016). A region was assigned to a spatial domain state if its average t value falls outside the Tukey inner Fences (below lower inner fence or above upper fence). A Tukey inner fence is defined as [Q1 − 1.5 × (Q3 − Q1) Q3 + 1.5 × (Q3 − Q1)], where Q1 and Q3 are the first and third quartiles (Hoaglin, Iglewicz, & Tukey, 1986). Next, we investigated the overall spatiotemporal variations within each FD. Previously, Cole et al. (2013) developed an index called the “global variability coefficient (GVC)” to evaluate variations in the connectivity of the brain networks across different tasks using multi‐task fMRI data. Here, we introduced a related measure called the variability index (VI) to evaluate the level of variability for each FD. Similar to GVC, VI is defined as the standard deviation (SD) of a region's association to an FD which can be estimated using the standard deviation equation of binomial distribution. For example, if FD i has five states, and region j is involved in only one state, the SD of the region j being associated with the FD i is (5 × 0.2 × 0.8)0.5. The average of VI values within each FD characterizes the overall spatiotemporal variability of the FD.
2.7. Functional state connectivity and FMs
Like other structures of this hierarchical functional architecture, FDs interact with each other. To evaluate these interactions, we need to calculate functional connectivity between FDs. Functional connectivity is defined as the temporal dependency of neural activity (Friston, Frith, Liddle, & Frackowiak, 1993). In fMRI, functional connectivity is typically measured by calculating the temporal coherence between BOLD time series or time series associated with brain networks. Using the same strategy, we can estimate functional connectivity between FDs by calculating the temporal coherence (coupling) between states of FDs. For this purpose, we calculate the level of concurrency between pairs of states using a coincidence index known as the Dice similarity coefficient (DSC; Dice, 1945). The functional inter‐domain state connectivity (called functional state connectivity for clarity) is defined as the ratio between the number of time points in which two states from different FDs occur simultaneously and the average occurrence of both states. In other words, functional state connectivity between state i of FD m (FDm, i) and state j of FD n (FDn, j) was calculated as the ratio of the number of the time points that state i of FD m and state j of FD n occurred simultaneously to the average occurrence of state i of FD m and state j of FD n (Equation (2)).
| (2) |
We further used functional state connectivity values to identify FMs. A FM is defined as a set of spatial domain states of FDs that reoccur together frequently in a distinguishable manner. In other words, a set of spatial domain states with higher connectivity with each other than with other states. FMs can be extracted using graph‐based community detection approaches like the Newman modularity detection approach (Newman, 2006).
2.8. Group comparison analysis
The clinical utility of our approach was evaluated by comparing spatial domain states of FDs between patients with SZ and healthy controls. For each region associated with a given spatial domain state, the average value of the FD was compared between patients with SZ and healthy controls using a general linear model (GLM) with age, gender, data acquisition site, and mean framewise displacement (Power, Barnes, Snyder, Schlaggar, & Petersen, 2012) as covariates. Framewise displacement measures instantaneous head motion as a single scalar value by calculating changes in the six rigid body transform parameters (framewise displacement (t) = ∣Δdx(t)∣ + ∣Δdy(t)∣ + ∣Δdz(t)∣ + ∣Δα(t)∣ + ∣Δβ(t)∣ + ∣Δγ(t)∣) and was included as a covariate to mitigate effects of head motion (Power et al., 2012). Statistical comparison was further performed on FMs by comparing each pair of functional state connectivity between patients with SZ and healthy controls using the previously explained procedure. For all analysis, statistical results were corrected for multiple comparisons using a 5% false discovery rate (FDR; Benjamini & Hochberg, 1995).
3. RESULTS
3.1. hICN extraction
Figure 3 displays the composite view of the hICNs selected from the group‐level spatial ICA results. Among 200 independent components, 65 were selected as cortical and subcortical hICNs and categorized into nine FDs. The nine FDs were defined based on the prior knowledge from previous studies (Allen et al., 2011, 2014; Damaraju et al., 2014; Iraji et al., 2016) and large‐scale brain networks obtained from low‐order ICA. The nine FDs are attention (Allen et al., 2011; Damoiseaux et al., 2006; Lee, Smyser, & Shimony, 2013), auditory (Allen et al., 2011, 2014; Damoiseaux et al., 2006), default mode (Allen et al., 2011;Iraji et al., 2016 ; Zuo et al., 2010), frontal default mode (Iraji et al., 2016; Zuo et al., 2010), frontoparietal (Allen et al., 2011; Iraji et al., 2016; Lee et al., 2013; Zuo et al., 2010), language (Lee et al., 2013; Tie et al., 2014), somatomotor (Allen et al., 2011; Damoiseaux et al., 2006; Iraji et al., 2016), subcortical (Allen et al., 2011, 2014), and visual (Allen et al., 2011; Damoiseaux et al., 2006; Iraji et al., 2016; Zuo et al., 2010). hICN selection and FD labeling were performed using the anatomical and presumed functional properties of hICNs, and their relationships with large‐scale brain networks obtained from low‐order ICA. Detailed information of the hICNs including spatial maps, coordinates of peak activations, and temporal information can be found in Supporting Information File S1. The selected hICNs are primarily in cortical and subcortical gray matter and show high spatial similarity with hICNs identified in previous works (Allen et al., 2011; Damaraju et al., 2014). After selecting hICNs of interest, spatially constrained ICA was utilized to calculate the subject‐specific hICNs and their time courses (Figure 2c) which were further used to reconstruct the FDs for each individual and time point.
Figure 3.

Composite maps of nine functional domains (FDs) generated from the 65 high‐order intrinsic connectivity networks (hICNs). Each color in a composite map corresponds to one of hICNs associated with the given FD. The detailed information of hICNs can be found at Supporting Information File S1 [Color figure can be viewed at https://wileyonlinelibrary.com]
3.2. Functional domain construction
At each time point, FDs were reconstructed using the associated hICNs and their contributions at that time point, resulting in 49,749 (309 subjects × 161 time points) spatial maps for each FD. Figure 2d illustrates an example of FD reconstruction for the default mode domain which contains nine hICNs shown in Figure 2d(III). At each time point, the default mode domain (Figure 2d[IV]) was calculated using the linear combination of the nine hICNs, and their contributions (Figure 2d[I]). In Figure 2d(IV), hot and cold colors represent positive and negative associations to the default mode domain. The spatial maps of FDs over time for randomly selected individuals are provided as Supporting Information Movies S1–S9 and also at the following link https://www.youtube.com/playlist?list=PLZZPPK0O_qFuil41n4U_HSZ668cFDuG7l. FDs display highly dynamic behaviors, and the contributions of brain regions to FDs vary significantly over time. Brain regions show both strong positive and strong negative associations to FDs over time. Moreover, as will be demonstrated later in Section 3.4., variations in regional association to FDs go beyond amplitude modulation. For example, some brain regions which are strongly involved in FDs at a given time point become dissociated at other time points.
3.3. Spatial domain state identification and verification
K‐means clustering was applied to the spatial maps of each FD and summarized into a set of reoccurring spatial patterns called spatial domain states. Figure 4 and Supporting Information File S2 show the spatial maps of cluster centroids as representations of spatial domain states. The number of clusters (k) for each FD was determined using the elbow criterion. Additionally, exploratory analyses over a large range of k demonstrate that these clusters are fully reproducible and spatial domain states are very similar (Supporting Information File S3). In general, we can categorize the states into voxel‐wise coherent and incoherent states. In voxel‐wise coherent states, the regions associated with FDs show a similar pattern of association, either positive or negative, while voxel‐wise incoherent states contain regions with both positive and negative associations to FDs. In Figure 4 and Supporting Information File S2, the total number and percentage of states occurrences are listed above each centroid. Occurrence rates range from 10% to 25%. For all FDs, the top two dominant states are voxel‐wise coherent states with occurrence rates above 20%.
Figure 4.
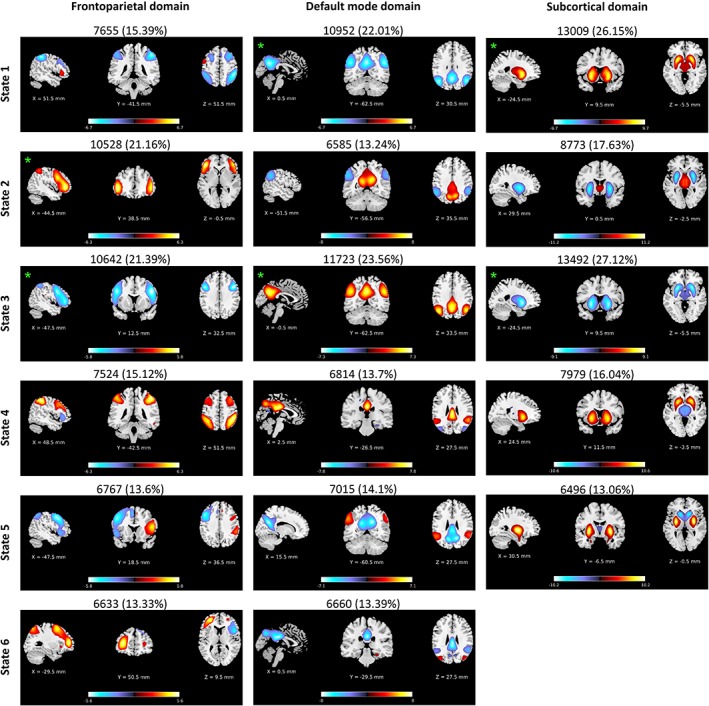
Examples of spatial domain states associated with three functional domains (FDs) including frontoparietal, default mode, and subcortical domains. Orthogonal views of spatial domain states, thresholded at |Z| > 1.96 (p = 0.05). Each spatial map represents the centroid of a cluster; and sagittal, coronal, and axial slices are shown at the peak activation of the centroids. Hot and cold colors represent positive and negative association of voxels to the FDs. The total number and percentage of occurrences are listed above each centroid. Voxel‐wise coherent states were marked using green asterisks. In voxel‐wise coherent states, the associated regions show a similar pattern of association (either positive or negative), and voxel‐wise incoherent states contain both regions with positive and negative associations to FDs. The spatial domain states for all nine FDs can be found at Supporting Information File S2. For further details regarding variations in regions associations to FDs please see Figure 6 [Color figure can be viewed at https://wileyonlinelibrary.com]
Investigating the relationships between BOLD signal of regions and their contributions to FDs exhibit overall the same pattern that regions have higher/lower activity when they have positive/negative association to their corresponding FDs. We observe this agreement between BOLD signals and regions associations to FDs for 96.02% of the cases. An example of the relationship between BOLD signal and regional association is presented in Figure 5 and Supporting Information File S4. Further investigation determined that different directionalities between regions associations to FDs and the amplitude of their BOLD signals only occur in regions with a weak contribution to FDs and/or small BOLD signal difference from the baseline (Supporting Information File S5).
Figure 5.
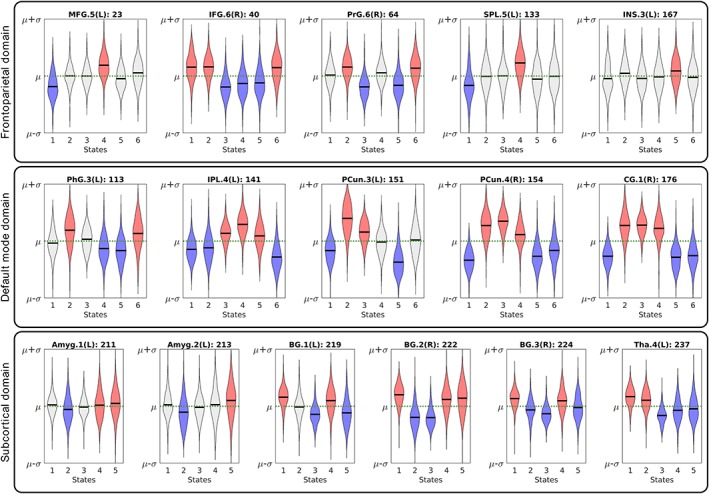
The relationship between the amplitude of the BOLD signal and regions associations with functional domains (FDs). Examples of average BOLD signal of regions across spatial domain states for the same three FDs as Figure 4. Example for all nine FDs can be found at Supporting Information File S4. Each violin plot represents the average BOLD signal of a region for spatial domain states of a given FD. The μ (green dashed line) and σ are the average and standard deviation of BOLD signal for each region across all time points, and the black line represents the average of the BOLD signal of a region across all subjects in the corresponding state. Red and blue colors represent the states with positive and negative associations of regions to FDs, the light gray color indicates no association between corresponding FD and region. The results suggest regions associations to FDs are related to their neural activities measured by the amplitude of BOLD signal. When regions are positively/negatively associated with FDs, their average BOLD signals are above/below their own average across all time points. This suggests the variations in a region's association to an FD are related to its neural activity, as observed by the amplitude of BOLD signal. The abbreviation and regions labels listed above each violin plot are based on the Brainnetome atlas (Fan et al., 2016). Amyg (amygdala), BG (basal ganglia), CG (cingulate gyrus), IFG (inferior frontal gyrus), INS (insular Gyrus), IPL (inferior parietal lobule), MFG (middle frontal gyrus), PCun (precuneus), PhG (parahippocampal gyrus), PrG (precentral gyrus), SPL (superior parietal lobule), and Tha (thalamus) [Color figure can be viewed at https://wileyonlinelibrary.com]
3.4. Spatial dynamic evaluation
Our analysis reveals that FDs are spatially fluid, and brain regions are transiently associated with FDs. FDs display distinct spatial patterns across their spatial states which include changes in the regions associated with them. Figure 6 and Supporting Information File S6 summarize variations in regions associations to FDs in which t value indicates the strength of each association. The results highlight changes in regions' memberships and the strengths of their associations to FDs over time. As an example, CG4 (cingulate gyrus subregion 4) is positively associated with the default mode in State 2 and 3 (presented in hot color), negatively associated with the default mode at States 1 and 5 (presented in cold), and becomes dissociated at States 4 and 6 (presented in gray). The list of associated regions, their coordinates, and the strengths of their associations to FDs can be found at Supporting Information File S7. The variations in regions membership to FDs over time can potentially explain inconsistencies in findings of previous static analyses regarding regions memberships to brain networks. Furthermore, examining the overall spatiotemporal variations of FDs using a variability index (VI) reveals that the FDs such as the frontoparietal and attention which are engaged in a wide variety of cognitive functions have higher variations than other FDs. The mean and standard error of VI values are listed above the chart of each functional domain in Figure 6 and Supporting Information File S6. Interestingly, in a previous multi‐task fMRI study, the same patterns variations were observed across a variety of tasks in which frontoparietal, attention and auditory, in order, show the highest variation, and the subcortical has the lowest changes in their connectivity patterns (Cole et al., 2013).
Figure 6.
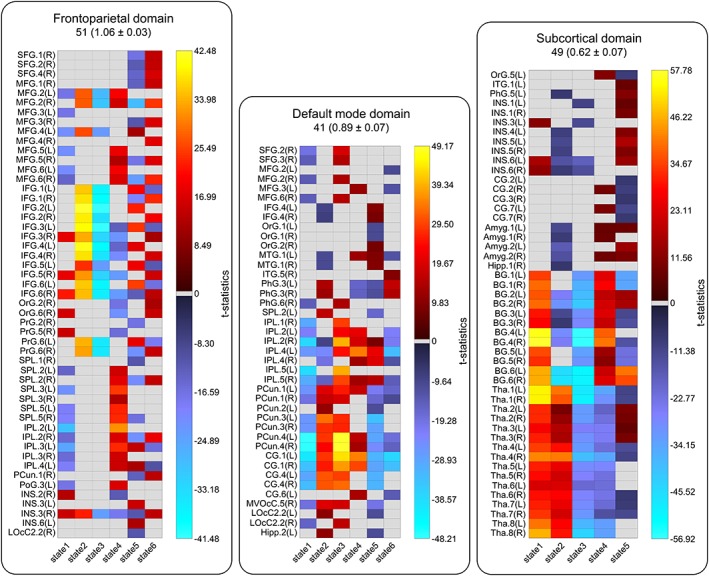
Spatiotemporal variations of functional domains (FDs). The chart represents the regions associated with the frontoparietal, default mode, and subcortical domains. Spatiotemporal variations of all nine FDs can be found at Supporting Information File S6. The brain anatomical parcellation is based on the Brainnetome atlas. The total number associated regions and the mean and standard error of variability index (VI) are listed above each chart. The results show different regions are associated with FDs at different states. Hot and cold colors represent positive and negative associations and gray represents dissociation of the regions at the states. t value indicates the strength of the region's association to FDs. VIs represent the overall variability of each FD where the frontoparietal and subcortical domains show maximum and minimum variations. The abbreviation and regions labels are the same as defined in the Brainnetome atlas. SFG (superior frontal gyrus), MFG (middle frontal gyrus), IFG (inferior frontal gyrus), OrG (orbital gyrus), PrG (precentral gyrus), MTG (middle temporal gyrus), ITG (inferior temporal gyrus), PhG (parahippocampal gyrus), SPL (superior parietal lobule), IPL (inferior parietal lobule), PCun (precuneus), PoG (postcentral gyrus), INS (insular gyrus), CG (cingulate gyrus), MVOcC (medioventral occipital cortex), LOcC (lateral occipital cortex), Amyg (amygdala), Hipp (hippocampus), BG (basal ganglia), and Tha (thalamus) [Color figure can be viewed at https://wileyonlinelibrary.com]
3.5. Group differences in spatial domain states
The spatial domain states of FDs were compared between patients with SZ and healthy controls using a regression model including age, size, gender, and mean framewise displacement as covariates. Several FDs reveal significantly weaker activity across different states in patients with SZ compared to healthy controls. In general, patients with SZ showed reductions in the regions' dynamic associations with FDs, except the dorsolateral region of Brodmann area (BA) 37 in State 5 of the language domain. Among all FDs, the visual, subcortical and attention domains are most affected. For the visual domains, all states except State 5 show significant differences between two groups. The most affected regions in the visual domain include the ventromedial occipital cortex, the lateral occipital cortex, and the ventromedial fusiform gyrus. In the subcortical domain, the thalamus showed significant differences in States 1, 2, and 3. For the attention domain, the left insula and the opercular area of left BA 44 in States 1 and 2, and the lateral area of BA 38 in State 4 show the highest differences. The other regions with significant differences in the language domain including right BAs 41/42 and the rostral area of left BA 22 demonstrated decreased associations in patients with SZ similar to the general pattern. Exploratory analyses on a subsample of the data with little head motion and no significant difference in mean framewise displacement between two groups (p = 0.5) displayed a similar pattern in group differences as using the full dataset. The full details of spatial comparison and regions with statistical differences can be found in Supporting Information File S8. Finally, in an exploratory analysis, we calculated the average spatial maps of FDs over time and compared them between two groups, healthy controls, and patients with SZ. No significant difference was observed between the two groups. Furthermore, we have also compared the static spatial independent components obtained from low‐order ICA. Similar to dynamic analysis, differences were observed in independent components associated with the subcortical, language, and attention domains, but the static analysis missed most of the changes identified in this work, such as alterations in the visual domain due to the assumption of spatially static networks. This suggests the static approach gives a good approximation some of the major alterations but is unable to detect nuanced alterations and information, highlighting the added utility of using spatial dynamics to examine the spatial patterns of FDs.
3.6. Functional state connectivity and FMs
The functional state connectivity matrix was estimated by calculating the temporal coupling between the states of FDs using DSC index (Figure 7). Using the Newman modularity detection approach (Newman, 2006), seven FMs were detected (Figure 8). Investigating group differences reveals an overall decrease in functional state connectivity within FMs in patients with SZ (Figure 8, green lines). Differences between patients with SZ and healthy controls are the most pronounced in FM 1, which mainly includes hypoconnectivity between the subcortical and others domains (Figure 8). Hypoconnectivity of the subcortical domain, which is also observed in other FMs, is the largest patient/control differences between groups. Note that the subcortical domain demonstrates alterations in both its activity patterns and its connectivity with other FDs in States 1, 2, and 3, which suggests it was the major source of the observed hypofunction in schizophrenia. Alteration in functional state connectivity of the default mode within FMs is another interesting finding. Although the comparisons of the spatial domain states of the default mode between two groups did not reveal any significant difference (3.5, Group Differences in Spatial Domain States), hypoconnectivity between the default mode and several FDs was observed within FMs. Interestingly, we observed hypoconnectivity between State 2 of the default mode domain and State 5 of the auditory domain, even though neither show significant change in their activity patterns in patients with SZ. This suggests that alterations in functional connectivity can occur in the absence of change in functional activity and vice versa.
Figure 7.
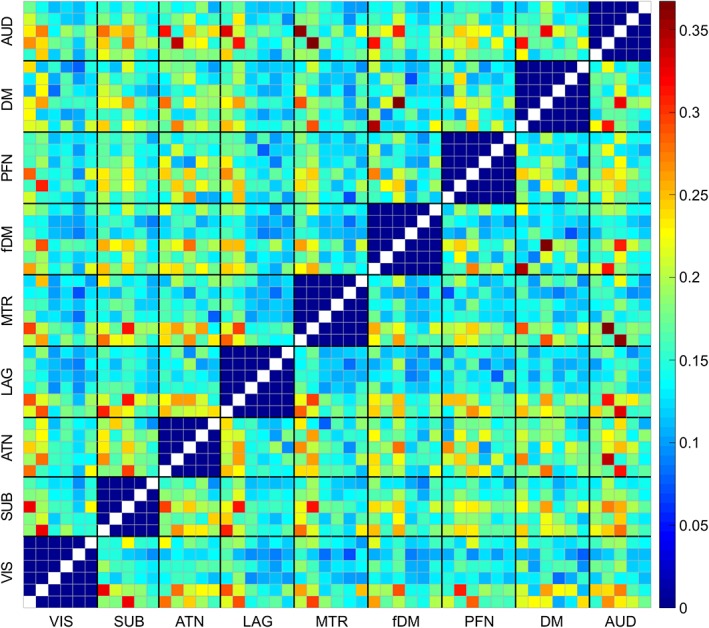
Functional state connectivity was estimated by calculating the level of concurrency between spatial domain states using DSC index. VIS (visual domain), SUB (subcortical domain), ATN (attention domain), LAG (language domain), MTR (somatomotor domain), fMD (frontal default mode domain), PFN (frontoparietal domain), DM (default mode domain), and AUD (auditory domain) [Color figure can be viewed at https://wileyonlinelibrary.com]
Figure 8.
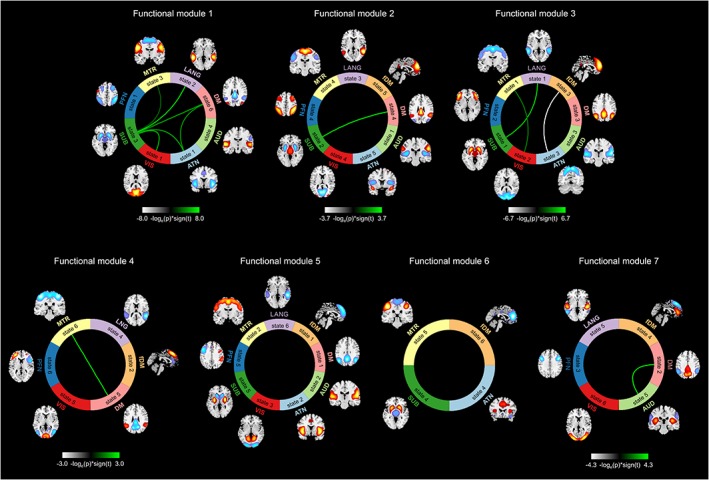
Functional modules (FMs) and functional state connectivity comparisons between healthy controls and patients with schizophrenia (SZ). Seven FMs were detected using Newman modularity detection approach. The green lines represent higher functional state connectivity in healthy controls than patients with SZ, and the silver one shows a higher functional state connectivity in patients with SZ [Color figure can be viewed at https://wileyonlinelibrary.com]
4. DISCUSSION
The brain reorganizes itself at different temporal and spatial scales which manifest at the macroscale variations in both temporal and spatial couplings of brain functional organizations. Recent findings display the ability of fMRI to capture time‐varying information of the brain (Calhoun et al., 2014; Hutchison et al., 2013; Preti et al., 2017). However, the majority of these studies have overlooked the spatial variations of brain functional organizations. In this study, we propose an approach that captures the spatiotemporal variations of FDs, that is, spatial dynamics, using the brain functional hierarchy model at macroscale. In agreement with our hypothesis, we observed that FDs are evolving spatially over time. Evaluating the spatial dynamics of individual FDs revealed a set of distinct, reoccurring spatial patterns (spatial domain states) within each FD. Variations in the spatial patterns of FDs over time were further accentuated by changes in regions' memberships to FDs. For example, brain regions join FDs and dissociate from them over time. In early work, Cole et al. (2013) used multi‐task fMRI data and predefined anatomical regions and showed changes in the spatial patterns of brain networks across various task scenarios. Here, we demonstrate that spatial variations exist even in a resting state of the brain due to the dynamic nature of the brain. Interestingly, we observe similar results to task data in which the frontoparietal, attention and auditory domain, in order, show the highest variation, and the subcortical has the lowest changes in its connectivity pattern. Spatial dynamics may also explain the inconsistencies observed in previous static analyses regarding regions' memberships to FDs (also known as large‐scale brain networks). For example, previous static analyses reported different sets of regions for each brain network, including different sets of regions for the default mode (Andrews‐Hanna, Reidler, Sepulcre, Poulin, & Buckner, 2010; Buckner, Andrews‐Hanna, & Schacter, 2008; Damoiseaux et al., 2006; Fox et al., 2005; Garrity et al., 2007; Greicius, Krasnow, Reiss, & Menon, 2003; Lee & Xue, 2018; Shirer, Ryali, Rykhlevskaia, Menon, & Greicius, 2012; Wang et al., 2014; Zuo et al., 2010). We suggest that different sets of regions are associated with a given FD at different time points, and only an overall dominant pattern is identified in the static analysis. In our opinion, alternative interpretations for the observed inconsistency in the spatial patterns of FDs can be the interdigitated parallel networks observed in a previous single‐subject study (Braga & Buckner, 2017). Their findings suggest that each brain network may consist of parallel networks that work simultaneously, and only one or combination of them is captured in group‐level analysis. The concept of the spatial dynamic is not against the existence of interdigitated networks within each FD, as they can be extracted using the time points during which they contribute the most in the spatial patterns of the given FD. For instance, Braga & Buckner, 2017, observed two district patterns for the default mode. One includes the parahippocampal cortex and posterior inferior parietal lobule, while the other includes anterior inferior parietal lobule regions. We found similar variations in the parahippocampal gyrus and inferior parietal lobule, along with many other regions across default mode states.
In addition to interdigitated parallel networks, there are several fMRI studies demonstrating the distributed, large‐scale networks occur in subportions across mental states and tasks supporting the spatial reconfiguration observed over time in this study's scenarios (Andrews‐Hanna et al., 2010; Cole et al., 2013; Dixon et al., 2018; Leech, Kamourieh, Beckmann, & Sharp, 2011). Furthermore, intracranial electrophysiology studies demonstrate different patterns of activity across multiple regions of the default mode over time [for review please read Fox, Foster, Kucyi, Daitch, and Parvizi (2018)]. The concept of spatial dynamics and variations in regions' associations over time was also confirmed via the amplitude of BOLD signal. We observed a direct relationship between the activities of regions measured by the BOLD signal and their contributions to FDs which supports our proposition that regions have higher/lower activity than their baseline when they have positive/negative association to their corresponding FDs. It should be noted that despite the high agreement between a region's association to FDs and its BOLD signal, the spatial dynamics of FDs cannot be captured by directly applying a clustering approach to the BOLD signal. (High‐order) ICA enables us to parcellate the brain to the functional units from the data itself to assure functional homogeneity, something which is not provided when using predefined regions from atlases (Yu et al., 2017). Moreover, using predefined spatial nodes instead of hICNs ignores simultaneous roles for brain regions. Using predefined atlases instead of hICNs also limits our ability to detect the spatial variations of FDs over time as the variations would become limited to sets of predefined regions. Most importantly, the goal of this study is to capture the spatial dynamics of FDs, which cannot be achieved by directly using the BOLD signal of a set of predefined regions as the unprocessed BOLD signal does not convey information regarding their contributions to a given FD. Therefore, using the BOLD signal directly only measures variations in activity patterns of regions over time rather than spatiotemporal variations of FDs.
It is worth mentioning that the concept of spatial domain states is aligned with that of previous work on EEG microstates. EEG studies have shown that neuronal electric activity can be clustered as a set of distinct states, each remaining stable for 80–120 ms (Khanna et al., 2015; Koenig et al., 2002; Lehmann et al., 1998). While using fMRI, we cannot achieve such high temporal resolutions, but the distinct reoccurrence of spatial patterns are indicative of a similar phenomenon. In contrast to EEG microstate analysis, which identifies the distributed spatial patterns for overall neuronal activity, spatial domain states propose the existence of distinct, distributed spatial patterns within individual brain functional organizations. The presence of distinct spatial distributions within each microstate should also be examined using EEG data. This can potentially improve our understanding of EEG microstates.
4.1. Hierarchical approach: Strengths, limitations, and future directions
Our proposed approach to capture the spatiotemporal variations of FDs is based on the well‐accepted assumption that the brain can be modeled as a hierarchical functional architecture with different levels of granularity. Each level of this architecture includes several elements, where each element is involved in a set of specific functions, and higher level elements have less functional homogeneity and increased dynamic behavior. Constructing functional hierarchy requires identifying functional units, which is quantified as a pattern of regions with the same functional activity over time (high functional homogeneity) and can be extracted from the data. We suggest hICNs are good approximations for functional units. Estimation of functional units and spatially fluid properties are limited by data quality, such as spatial and temporal resolutions, and the properties of the imaging modalities. Although one advantage of the proposed approach is capturing the spatiotemporal variations of FDs up to the maximum temporal and spatial resolutions exist in the data, we can improve the functional granularity and reconstruct the hierarchy from lower levels, such as cortical columns, by adjusting the data acquisition and analytical approaches. We can also use other imaging modalities, such as calcium imaging (Matsui, Murakami, & Ohki, 2018) or photoacoustic tomography (Nasiriavanaki et al., 2014), to estimate functional units and construct functional hierarchy, which can help to improve our understanding of the spatially fluid properties and information processing. Another advantage of the approach is employing both spatial and temporal information of ICNs rather than only using either ICNs' spatial patterns or their time courses as it is the common strategy in previous work.
Moreover, our approach provides information about each FD at every time point. Because at any given time point, FDs are constructed from hICNs' contributions of the same time point in contrast to being influenced by other time points, the approach can capture spatial dynamic information regardless of temporal resolution. In fMRI, this means the approach has the ability to detect dynamic patterns independent of TR. Of course, having data with high temporal resolutions and/or for a longer period of time can potentially provide us more information regarding dynamic behavior of FDs, including the detecting new dynamic patterns. In addition to spatial dynamics of FDs, we also demonstrate the ability of the approach in capturing time‐varying properties at a global scale. For this purpose, we developed an index called functional (inter‐domain) state connectivity to compute temporal coupling between FDs and calculate FMs. Future studies are required to capture spatial and temporal dynamic properties within and between different levels of hierarchy. As the first step, future studies should investigate time‐varying temporal coupling of intrinsic connectivity networks within and between different ICA model‐orders. This can provide new insight both into how the elements of brain functional hierarchy interact with each other, and how changes in the associations between functional units reform brain functional activity at a larger scale. For instance, examining the association between low‐order and high‐order ICA can further our understanding of the reconfiguration of large‐scale brain networks over time. A future study should investigate the temporal properties of spatial domains states and associated dynamic indices such as dwell time, leave time, fraction rate, and transition matrix. It is apropos to mention that, in this study, k‐means clustering was used as a tool to examine variations existing in brain functional domains, but other methods are equally applicable. While k‐means clustering yields valuable results, neither the states identified using k‐means clustering are likely to be the true origins of time‐varying behavior of FDs, nor the assumption that there is only one active state per time point, as activity patterns of a given FD occurs simultaneously. Further studies are therefore needed to find improved representations of the time‐varying behavior of FDs.
The most challenging step of the approach requiring future investigation and further improvement is the estimation of functional units and their FD labeling. Although our approach allows the detection of spatial variations over time regardless of a selected partitioning procedure (i.e., selecting functional units and associated FDs), good partitioning is essential to fully capture the dynamic characteristics of the data. High‐order ICA has several advantages over predefined atlases including (a) high‐order ICA allows the segregation of functional roles of individual regions; (b) each hICN is a pattern of functionally homogeneous regions extracted from data itself, which is closer with the definition of functional units than predefined anatomical regions; and (c) the spatial variations of high‐order ICA are not limited to fixed regions as with predefined atlases and allow for individual variability in the spatial maps (Allen, Erhardt, Wei, Eichele, & Calhoun, 2012; Calhoun & Adali, 2012). However, despite the advantages of hICNs, the level of parcellation (i.e., a number of components) requires further investigation. In addition to the number of hICNs, hICN grouping (i.e., FD labeling) is another key piece of the hierarchical approach. In our current work, hICNs were grouped into nine FDs using a semi‐automatic process approach including (a) our prior knowledge from anatomical and functional properties; (b) the relationship of hICNs with results of low‐order ICA; and (c) similarity between their timecourses of hICNs. While different grouping approaches are acceptable, a robust, data‐driven approach is recommended for FD identification and hICN assignment. Furthermore, changes in hICNs' memberships to FDs over time are another crucial factor that needs to be considered. The present study limits assigning each hICN to one FD; however, hICNs can also change their memberships to different FDs over time. Ongoing work is assigning hICNs to FDs at any given time point using the information of the data at that time point.
4.2. Schizophrenia
Schizophrenia is a heterogeneous disorder characterized by symptoms of impaired reality testing such as hallucinations, delusions, and frequently disorganized speech and behavior, as well as impairments in cognition across a range of domains (American Psychiatric Association, 2013). It has been suggested that schizophrenia is related to the brain's reduced capacity to integrate information across the different regions (Kahn et al., 2015; Stephan et al., 2006). The reduced capacity to integrate information has been associated with several phenomena in schizophrenia, including reductions in functional and structural connectivity, and reductions in gray and white matter volumes. The most reported deficit is lower global functional connectivity between many regions, including subcortical regions; and the frontal, temporal, and occipital cortices. However, a replicated exception to this trend is increased functional connectivity between the thalamus and somatosensory and motor areas (Argyelan et al., 2014; Damaraju et al., 2014; Giraldo‐Chica & Woodward, 2017; Skudlarski et al., 2010; Tu et al., 2015). Reduction in functional connectivity is suggested to be the result of alterations in brain structural connectivity at different levels from impaired synaptic plasticity (Friston, 1998) to reduction in the capacity of the structural connections at macroscale (Kahn et al., 2015; van den Heuvel, Mandl, Stam, Kahn, & Hulshoff Pol, 2010). Reductions in gray and white matter volumes have been also reported across whole brain including thalamus, frontal, temporal, cingulate, and insular cortex in patients with SZ (Ellison‐Wright & Bullmore, 2010; Kahn et al., 2015; Segall et al., 2009; Staal et al., 2001). Our approach adds another piece to this global deficient phenomenon and reveals for the first time that there is also a transient reduction in the activity patterns of FDs. Furthermore, reduced functional state connectivity within FMs is in agreement with the hypoconnectivity observed in previous studies among brain regions. While we did not investigate functional connectivity between brain regions, we observed decreased functional state connectivity between subcortical and somatosensory and somatomotor domains within the FMs, which could be an important window into a link between increased functional connectivity among these regions and decreased functional connectivity with the rest of the brain.
We propose that our approach is well‐suited to examine the alterations in the brain's capacity to integrate information because it models the brain as a hierarchical functional architecture in which elements of each level of the hierarchy constructed from integrating the information of the lower level. This proposition was also supported by our findings. There is substantial evidence that there are distinct patterns for schizophrenia as detected by our analysis. In our analysis, the most affected regions and domains include the thalamus of the subcortical domain; BA 38 of the attention domain; the left insula, left BA 44, right BAs 41/42, and the rostral area of left BA 22 of the language domain; and the fusiform gyrus, medioventral, and lateral occipital cortex of the visual domain. The thalamus is known as a major brain structure affected both structurally and functionally in patients with SZ (Cheng et al., 2015; Damaraju et al., 2014; Giraldo‐Chica & Woodward, 2017). Disruption in attention associated areas is frequently reported in patients with SZ (Bowie & Harvey, 2006). Particularly, temporal pole area (BA38) is a key part of the theory of mind (ToM) network, which is classically impaired in patients with SZ and autism spectrum disorder (Assaf et al., 2010). Furthermore, BAs 41/42 is primary auditory cortex, and together with the BA22 (auditory association cortex/Wernicke's area), has been repeatedly implicated in the pathophysiology of auditory hallucinations in schizophrenia (Barta, Pearlson, Powers, Richards, & Tune, 1990; Gavrilescu et al., 2010; Shinn, Baker, Cohen, & Ongur, 2013; Vercammen, Knegtering, den Boer, Liemburg, & Aleman, 2010). Alterations in the visual domain have been also observed as ocular convergence deficits (Bolding et al., 2012) and reduce amplitude of low‐frequency fluctuations (ALFF) was observed across visual areas including the cuneus and lingual gyrus (Hoptman et al., 2010). Therefore, our findings are further buttressed by previous literature, suggesting spatial dynamics can provide a new dimension/level of schizophrenia‐related alterations in the brain, which can potentially be leveraged to characterize clinical features in other patient groups.
5. CONCLUSION
We proposed a novel framework that, for the first time, exploits the well‐accepted brain functional hierarchical model to capture the spatial dynamics of brain functional organization. The present work reveals strong evidence that FDs evolve spatially over time including a broad spectrum of changes in regional associations from strong coupling to complete decoupling. Additionally, given that the brain reorganizes its activity at different interacting spatial and temporal scales, our hierarchical framework opens a new avenue to evaluate spatiotemporal variations within and between levels of the brain functional hierarchy providing a broader perspective of how the brain naturally functions. Preliminary assessments of the approach using healthy controls and patients with SZ demonstrate the ability of the approach to obtain new information of the brain function and detect alterations among patients with SZ. However, further investigations using different datasets and various cohorts should be performed to evaluate the benefits of studying spatiotemporal variations of brain functional domains for both basic and clinical neuroscience applications.
Supporting information
Supporting Information File S1. Detailed information of the hICNs including spatial maps, coordinates of peak activations, and temporal information.
Supporting Information File S2. The orthogonal view of the spatial domain states associated with nine functional domains thresholded at |Z| > 1.96 (p = 0.05). Each spatial map represents the centroid of a cluster, and sagittal, coronal, and axial slices are shown at the peak activation of the centroids. Hot and cold colors represent positive and negative association of voxels to the functional domains. The total number and percentage of occurrences are listed above each centroid. Voxel‐wise coherent states were marked using green asterisks. In voxel‐wise coherent states, the associated regions show a similar pattern of association, either positive or negative, and voxel‐wise incoherent states contain both regions with positive and negative associations to functional domains. It is worth mentioning that because the orthogonal view represents the peak activations of the centroids, we cannot see both positive and negative contributions for voxel‐wise incoherent states for some cases including the state 5 of the frontal default mode domain and state 3 of the language domain.
Supporting Information File S3. The cluster centroids for k = 3 to 10 for nine functional domain thresholded at |Z| > 1.96 (p = 0.05). For each k, the Kmeans algorithm was repeated 100 times on the exemplars with different initializations using k‐means++ algorithm. Each spatial map represents the centroid of a cluster, and sagittal, coronal, and axial slices are shown at the peak activation of the centroids. Hot and cold colors represent the positive and negative associations of voxels to the functional domains. The total number and percentage of occurrences are listed above each centroid. The dashed rectangle highlights the clustering result presented in the main text which was selected using elbow criterion. The total number and percentage of occurrences are listed above each centroid.
Supporting Information File S4. The relationship between the amplitude of the BOLD signal and regions associations to functional domains (FDs). Examples of average BOLD signal of regions across spatial domain states of FDS. Each violin plot represents the average BOLD signal of a region for different states of a FD. The μ (green dashed line) and σ are the average and standard deviation of BOLD signal for each region across all time points, and the black line represents the average of the BOLD signal of a region across all subjects in the corresponding state. Red and blue colors represent the states with positive and negative associations of regions to FDs, the light gray color indicates no association between corresponding FD and region. The results show that when regions are positively/negatively associated with FDs, their average BOLD signal is above/below its own average across all timepoint. This suggests the variation in a region association to a FD is related to its neural activity observed by the amplitude of BOLD signal. The abbreviation and regions labels listed above each violin plot are based on the Brainnetome atlas. Amyg (Amygdala), BG (Basal Ganglia), CG (Cingulate Gyrus), IFG (Inferior Frontal Gyrus), INS (Insular Gyrus), IPL (Inferior Parietal Lobule), LOcC (lateral Occipital Cortex), MFG (Middle Frontal Gyrus), MTG (Middle Temporal Gyrus), MVOcC (MedioVentral Occipital Cortex), OrG (Orbital Gyrus), PCun (Precuneus), PhG (Parahippocampal Gyrus), PoG (Postcentral Gyrus), PrG (Precentral Gyrus), pSTS (posterior Superior Temporal Sulcus), SFG (Superior Frontal Gyrus), SPL (Superior Parietal Lobule), STG (Superior Temporal Gyrus), and Tha (Thalamus).
Supporting Information File S5
Supporting Information File S6. Spatiotemporal variations of functional domains (FDs). Each chart represents the regions associations to a functional domain. The brain anatomical parcellation is based on the Brainnetome atlas. The total number associated regions and the mean and standard error of variability index (VI) are listed above each chart. The results show different regions are associated to functional domains at different states. Hot and cold colors represent positive and negative associations and gray represents dissociation of the regions at the states. VIs represent the overall variability of each functional domain where frontoparietal and subcortical domains shows maximum and minimum variations as it was previously observed a multi‐task fMRI study (Cole et al., 2013). The abbreviation and regions labels are the same as defined in the Brainnetome atlas. SFG (Superior Frontal Gyrus), MFG (Middle Frontal Gyrus), IFG (Inferior Frontal Gyrus), OrG (Orbital Gyrus), PrG (Precentral Gyrus), PCL(Paracentral Lobule), STG (Superior Temporal Gyrus), MTG (Middle Temporal Gyrus), ITG (Inferior Temporal Gyrus), FuG (Fusiform Gyrus), PhG (Parahippocampal Gyrus), pSTS (posterior Superior Temporal Sulcus), SPL (Superior Parietal Lobule), IPL (Inferior Parietal Lobule), PCun (Precuneus), PoG (Postcentral Gyrus), INS (Insular Gyrus), CG (Cingulate Gyrus), MVOcC (MedioVentral Occipital Cortex), LOcC (lateral Occipital Cortex), Amyg (Amygdala), Hipp (Hippocampus), BG (Basal Ganglia), Tha (Thalamus).
Supporting Information File S7
Supporting Information File S8. Functional domains statistical comparisons between healthy subjects and schizophrenia (SZ) patients. The green bars represent higher associations (positive or negative) of regions to the functional domains in healthy subjects than SZ patients, and the silver bar shows a higher association (or activity) in SZ patients. The significant differences are labels as “State No_regions abbervation (hemisphere size)”. For example “S1_Tha.1(R)” is State 1_thalamus subregion 1(Right hemisphere). Regoins abbreviation is based on the Brainnetome atlas. The results indicate compared to healthy subjects; the SZ patients have significantly weaker activity (all but one) across different functional domains. Group differences were evaluated using a general linear model (GLM) including age, site, gender, and mean framewise displacement (meanFD) as covariates. meanFD was added as a covariate to control for its (motion) potential effect in group difference related to the health conditions. Although this seems enough to control its confounding influence, we performed further exploratory analysis on a subsample of the data with little head motion (meanFD<0.45) and no significant difference in meanFD between two groups (p‐value= 0.5) in order to address current concerns on the importance of head motion in fMRI studies. Our analysis on the subsample of the data demonstrated a similar pattern in group difference as using the full dataset. The bars with red edge (border) are those comparisons that did not show significant differences on subsample data. Interestingly, these comparisons only include those with small statistical significance differences which suggests a larger sample size can possibility to detect the differences as it was shown in the analysis using full dataset. In other words, the reason that they are not significant in subsample could be related to the statistical power rather than motion.
Movie S1 Attention domain_subject 309
Movie S2 Auditory domain_subject 263
Movie S3 Default mode domain_subject 068
Movie S4 Frontal Default mode domain_subject 223
Movie S5 Frontoparietal domain_subject 284
Movie S6 Language domain_subject 023
Movie S7 Somatomotor domain_subject 052
Movie S8 Subcortical domain_subject 181
Movie S9 Visual domain_subject 260
Movie S10 Subcortical domain_subject 250
ACKNOWLEDGMENTS
This work was supported by grants from the National Institutes of Health grant numbers 2R01EB005846, R01REB020407, and P20GM103472; and National Science Foundation (NSF) grant 1539067 to Dr. V.D. C.; and the National Institute of Mental Health grant number R01MH058262 and the Department of Veterans Affairs Senior Research Career Scientist award I01 CX0004971 to Dr. J.M. F.
Iraji A, Fu Z, Damaraju E, et al. Spatial dynamics within and between brain functional domains: A hierarchical approach to study time‐varying brain function. Hum Brain Mapp. 2019;40:1969–1986. 10.1002/hbm.24505
Funding information: U.S. Department of Veterans Affairs, Grant/Award Number: I01 CX0004971; Department of Veterans Affairs, Grant/Award Number: I01 CX0004971; National Institute of Mental Health, Grant/Award Number: R01MH058262; National Science Foundation, Grant/Award Number: 1539067; National Institutes of Health, Grant/Award Numbers: 2R01EB005846, P20GM103472, R01REB020407
Contributor Information
Armin Iraji, Email: armin.iraji@gmail.com.
Vince D. Calhoun, Email: vcalhoun@mrn.org.
REFERENCES
- Allen, E. A. , Damaraju, E. , Plis, S. M. , Erhardt, E. B. , Eichele, T. , & Calhoun, V. D. (2014). Tracking whole‐brain connectivity dynamics in the resting state. Cerebral Cortex, 24, 663–676. [DOI] [PMC free article] [PubMed] [Google Scholar]
- Allen, E. A. , Erhardt, E. B. , Damaraju, E. , Gruner, W. , Segall, J. M. , Silva, R. F. , … Calhoun, V. D. (2011). A baseline for the multivariate comparison of resting‐state networks. Frontiers in Systems Neuroscience, 5, 2. [DOI] [PMC free article] [PubMed] [Google Scholar]
- Allen, E. A. , Erhardt, E. B. , Wei, Y. , Eichele, T. , & Calhoun, V. D. (2012). Capturing inter‐subject variability with group independent component analysis of fMRI data: A simulation study. NeuroImage, 59, 4141–4159. [DOI] [PMC free article] [PubMed] [Google Scholar]
- Andrews‐Hanna, J. R. , Reidler, J. S. , Sepulcre, J. , Poulin, R. , & Buckner, R. L. (2010). Functional‐anatomic fractionation of the brain's default network. Neuron, 65, 550–562. [DOI] [PMC free article] [PubMed] [Google Scholar]
- Arbabshirani, M. R. , Plis, S. , Sui, J. , & Calhoun, V. D. (2017). Single subject prediction of brain disorders in neuroimaging: Promises and pitfalls. NeuroImage, 145, 137–165. [DOI] [PMC free article] [PubMed] [Google Scholar]
- Argyelan, M. , Ikuta, T. , Derosse, P. , Braga, R. J. , Burdick, K. E. , John, M. , … Szeszko, P. R. (2014). Resting‐state fMRI connectivity impairment in schizophrenia and bipolar disorder. Schizophrenia Bulletin, 40, 100–110. [DOI] [PMC free article] [PubMed] [Google Scholar]
- Arthur, D. , Vassilvitskii, S. , 2007. k‐means++: The advantages of careful seeding. In: Proceedings of the Eighteenth Annual ACM‐SIAM Symposium on Discrete Algorithms. Society for Industrial and Applied Mathematics, Philadelphia, PA. pp. 1027–1035.
- Assaf, M. , Jagannathan, K. , Calhoun, V. D. , Miller, L. , Stevens, M. C. , Sahl, R. , … Pearlson, G. D. (2010). Abnormal functional connectivity of default mode sub‐networks in autism spectrum disorder patients. NeuroImage, 53, 247–256. [DOI] [PMC free article] [PubMed] [Google Scholar]
- American Psychiatric Association . (2013). Diagnostic and statistical manual of mental disorders (DSM‐5®). Arlington, VA: American Psychiatric Publishing. [Google Scholar]
- Barta, P. E. , Pearlson, G. D. , Powers, R. E. , Richards, S. S. , & Tune, L. E. (1990). Auditory hallucinations and smaller superior temporal gyral volume in schizophrenia. The American Journal of Psychiatry, 147, 1457–1462. [DOI] [PubMed] [Google Scholar]
- Barttfeld, P. , Uhrig, L. , Sitt, J. D. , Sigman, M. , Jarraya, B. , & Dehaene, S. (2015). Signature of consciousness in the dynamics of resting‐state brain activity. Proceedings of the National Academy of Sciences of the United States of America, 112, 887–892. [DOI] [PMC free article] [PubMed] [Google Scholar]
- Benjamini, Y. , & Hochberg, Y. (1995). Controlling the false discovery rate: A practical and powerful approach to multiple testing. Journal of the Royal Statistical Society: Series B (Methodological), 57, 289–300. [Google Scholar]
- Blumensath, T. , Jbabdi, S. , Glasser, M. F. , Van Essen, D. C. , Ugurbil, K. , Behrens, T. E. , & Smith, S. M. (2013). Spatially constrained hierarchical parcellation of the brain with resting‐state fMRI. NeuroImage, 76, 313–324. [DOI] [PMC free article] [PubMed] [Google Scholar]
- Bolding, M. S. , Lahti, A. C. , Gawne, T. J. , Hopkins, K. B. , Gurler, D. , & Gamlin, P. D. (2012). Ocular convergence deficits in schizophrenia. Frontiers in Psychiatry, 3, 86. [DOI] [PMC free article] [PubMed] [Google Scholar]
- Bowie, C. R. , & Harvey, P. D. (2006). Cognitive deficits and functional outcome in schizophrenia. Neuropsychiatric Disease and Treatment, 2, 531–536. [DOI] [PMC free article] [PubMed] [Google Scholar]
- Braga, R. M. , & Buckner, R. L. (2017). Parallel Interdigitated distributed networks within the individual estimated by intrinsic functional connectivity. Neuron, 95, 457–471. [DOI] [PMC free article] [PubMed] [Google Scholar]
- Buckner, R. L. , Andrews‐Hanna, J. R. , & Schacter, D. L. (2008). The brain's default network: Anatomy, function, and relevance to disease. Annals of the New York Academy of Sciences, 1124, 1–38. [DOI] [PubMed] [Google Scholar]
- Calhoun, V. , Adali, T. , 2002. Complex infomax: Convergence and approximation of infomax with complex nonlinearities. In: Proceedings of the 12th IEEE Workshop on Neural Networks for Signal Processing, 6 September 2002; Martigny, Switzerland. pp. 307–316.
- Calhoun, V. D. , & Adali, T. (2012). Multisubject independent component analysis of fMRI: A decade of intrinsic networks, default mode, and neurodiagnostic discovery. IEEE Reviews in Biomedical Engineering, 5, 60–73. [DOI] [PMC free article] [PubMed] [Google Scholar]
- Calhoun, V. D. , Adali, T. , Pearlson, G. D. , & Pekar, J. J. (2001). A method for making group inferences from functional MRI data using independent component analysis. Human Brain Mapping, 14, 140–151. [DOI] [PMC free article] [PubMed] [Google Scholar]
- Calhoun, V. D. , & de Lacy, N. (2017). Ten key observations on the analysis of resting‐state functional MR imaging data using independent component analysis. Neuroimaging Clinics of North America, 27, 561–579. [DOI] [PMC free article] [PubMed] [Google Scholar]
- Calhoun, V. D. , Liu, J. , & Adali, T. (2009). A review of group ICA for fMRI data and ICA for joint inference of imaging, genetic, and ERP data. NeuroImage, 45, S163–S172. [DOI] [PMC free article] [PubMed] [Google Scholar]
- Calhoun, V. D. , Miller, R. , Pearlson, G. , & Adali, T. (2014). The chronnectome: Time‐varying connectivity networks as the next frontier in fMRI data discovery. Neuron, 84, 262–274. [DOI] [PMC free article] [PubMed] [Google Scholar]
- Chen, T. , Cai, W. , Ryali, S. , Supekar, K. , & Menon, V. (2016). Distinct global brain dynamics and spatiotemporal organization of the salience network. PLoS Biology, 14, e1002469. [DOI] [PMC free article] [PubMed] [Google Scholar]
- Cheng, W. , Palaniyappan, L. , Li, M. , Kendrick, K. M. , Zhang, J. , Luo, Q. , … Feng, J. (2015). Voxel‐based, brain‐wide association study of aberrant functional connectivity in schizophrenia implicates thalamocortical circuitry. NPJ Schizophrenia, 1, 15016. [DOI] [PMC free article] [PubMed] [Google Scholar]
- Cole, M. W. , Reynolds, J. R. , Power, J. D. , Repovs, G. , Anticevic, A. , & Braver, T. S. (2013). Multi‐task connectivity reveals flexible hubs for adaptive task control. Nature Neuroscience, 16, 1348–1355. [DOI] [PMC free article] [PubMed] [Google Scholar]
- Correa, N. , Adali, T. , & Calhoun, V. D. (2007). Performance of blind source separation algorithms for FMRI analysis using a group ICA method. Magnetic Resonance Imaging, 25, 684–694. [DOI] [PMC free article] [PubMed] [Google Scholar]
- Correa, N. , Adali, T. , Li, Y.‐O. , Calhoun, V.D. , 2005. Comparison of blind source separation algorithms for FMRI using a new Matlab toolbox: GIFT. In: Proceedings of the IEEE International Conference on Acoustics, Speech, and Signal Processing (ICASSP'05), Vol. 405. pp. v/401–v/404.
- Damaraju, E. , Allen, E. A. , Belger, A. , Ford, J. M. , McEwen, S. , Mathalon, D. H. , … Calhoun, V. D. (2014). Dynamic functional connectivity analysis reveals transient states of dysconnectivity in schizophrenia. Neuroimage: Clinical, 5, 298–308. [DOI] [PMC free article] [PubMed] [Google Scholar]
- Damoiseaux, J. S. , Rombouts, S. A. R. B. , Barkhof, F. , Scheltens, P. , Stam, C. J. , Smith, S. M. , & Beckmann, C. F. (2006). Consistent resting‐state networks across healthy subjects. Proceedings of the National Academy of Sciences of the United States of America, 103, 13848–13853. [DOI] [PMC free article] [PubMed] [Google Scholar]
- Dice, L. R. (1945). Measures of the amount of ecologic association between species. Ecology, 26, 297–302. [Google Scholar]
- Dixon, M. L. , De La Vega, A. , Mills, C. , Andrews‐Hanna, J. , Spreng, R. N. , Cole, M. W. , & Christoff, K. (2018). Heterogeneity within the frontoparietal control network and its relationship to the default and dorsal attention networks. Proceedings of the National Academy of Sciences of the United States of America, 115, E1598–e1607. [DOI] [PMC free article] [PubMed] [Google Scholar]
- Du, W. , Ma, S. , Fu, G.‐S. , Calhoun, V.D. , Adali, T. , 2014. A novel approach for assessing reliability of ICA for FMRI analysis. In: IEEE International Conference on Acoustics, Speech and Signal Processing (ICASSP). pp. 2084–2088.
- Ellison‐Wright, I. , & Bullmore, E. (2010). Anatomy of bipolar disorder and schizophrenia: A meta‐analysis. Schizophrenia Research, 117, 1–12. [DOI] [PubMed] [Google Scholar]
- Erhardt, E. B. , Allen, E. A. , Damaraju, E. , & Calhoun, V. D. (2011). On network derivation, classification, and visualization: A response to Habeck and Moeller. Brain Connectivity, 1, 105–110. [DOI] [PMC free article] [PubMed] [Google Scholar]
- Erhardt, E. B. , Rachakonda, S. , Bedrick, E. J. , Allen, E. A. , Adali, T. , & Calhoun, V. D. (2011). Comparison of multi‐subject ICA methods for analysis of fMRI data. Human Brain Mapping, 32, 2075–2095. [DOI] [PMC free article] [PubMed] [Google Scholar]
- Fan, L. , Li, H. , Zhuo, J. , Zhang, Y. , Wang, J. , Chen, L. , … Jiang, T. (2016). The human Brainnetome atlas: A new brain atlas based on connectional architecture. Cerebral Cortex, 26, 3508–3526. [DOI] [PMC free article] [PubMed] [Google Scholar]
- Felleman, D. J. , & Van Essen, D. C. (1991). Distributed hierarchical processing in the primate cerebral cortex. Cerebral Cortex, 1, 1–47. [DOI] [PubMed] [Google Scholar]
- Fox, K. C. R. , Foster, B. L. , Kucyi, A. , Daitch, A. L. , & Parvizi, J. (2018). Intracranial electrophysiology of the human default network. Trends in Cognitive Sciences, 22, 307–324. [DOI] [PMC free article] [PubMed] [Google Scholar]
- Fox, M. D. , Snyder, A. Z. , Vincent, J. L. , Corbetta, M. , Van Essen, D. C. , & Raichle, M. E. (2005). The human brain is intrinsically organized into dynamic, anticorrelated functional networks. Proceedings of the National Academy of Sciences of the United States of America, 102, 9673–9678. [DOI] [PMC free article] [PubMed] [Google Scholar]
- Friston, K. J. (1998). The disconnection hypothesis. Schizophrenia Research, 30, 115–125. [DOI] [PubMed] [Google Scholar]
- Friston, K. J. , Frith, C. D. , Liddle, P. F. , & Frackowiak, R. S. (1993). Functional connectivity: The principal‐component analysis of large (PET) data sets. Journal of Cerebral Blood Flow and Metabolism, 13, 5–14. [DOI] [PubMed] [Google Scholar]
- Garrity, A. G. , Pearlson, G. D. , McKiernan, K. , Lloyd, D. , Kiehl, K. A. , & Calhoun, V. D. (2007). Aberrant "default mode" functional connectivity in schizophrenia. The American Journal of Psychiatry, 164, 450–457. [DOI] [PubMed] [Google Scholar]
- Gavrilescu, M. , Rossell, S. , Stuart, G. W. , Shea, T. L. , Innes‐Brown, H. , Henshall, K. , … Egan, G. F. (2010). Reduced connectivity of the auditory cortex in patients with auditory hallucinations: A resting state functional magnetic resonance imaging study. Psychological Medicine, 40, 1149–1158. [DOI] [PubMed] [Google Scholar]
- Giraldo‐Chica, M. , & Woodward, N. D. (2017). Review of thalamocortical resting‐state fMRI studies in schizophrenia. Schizophrenia Research, 180, 58–63. [DOI] [PMC free article] [PubMed] [Google Scholar]
- Greicius, M. (2008). Resting‐state functional connectivity in neuropsychiatric disorders. Current Opinion in Neurology, 21, 424–430. [DOI] [PubMed] [Google Scholar]
- Greicius, M. D. , Krasnow, B. , Reiss, A. L. , & Menon, V. (2003). Functional connectivity in the resting brain: A network analysis of the default mode hypothesis. Proceedings of the National Academy of Sciences of the United States of America, 100, 253–258. [DOI] [PMC free article] [PubMed] [Google Scholar]
- Himberg, J. , Hyvarinen, A. , & Esposito, F. (2004). Validating the independent components of neuroimaging time series via clustering and visualization. NeuroImage, 22, 1214–1222. [DOI] [PubMed] [Google Scholar]
- Hoaglin, D. C. , Iglewicz, B. , & Tukey, J. W. (1986). Performance of some resistant rules for outlier labeling. Journal of the American Statistical Association, 81, 991–999. [Google Scholar]
- Hoptman, M. J. , Zuo, X. N. , Butler, P. D. , Javitt, D. C. , D'Angelo, D. , Mauro, C. J. , & Milham, M. P. (2010). Amplitude of low‐frequency oscillations in schizophrenia: A resting state fMRI study. Schizophrenia Research, 117, 13–20. [DOI] [PMC free article] [PubMed] [Google Scholar]
- Hutchison, R. M. , Womelsdorf, T. , Allen, E. A. , Bandettini, P. A. , Calhoun, V. D. , Corbetta, M. , … Chang, C. (2013). Dynamic functional connectivity: Promise, issues, and interpretations. NeuroImage, 80, 360–378. [DOI] [PMC free article] [PubMed] [Google Scholar]
- Iraji, A. , Benson, R. R. , Welch, R. D. , O'Neil, B. J. , Woodard, J. L. , Ayaz, S. I. , … Kou, Z. (2015). Resting state functional connectivity in mild traumatic brain injury at the acute stage: Independent component and seed‐based analyses. Journal of Neurotrauma, 32, 1031–1045. [DOI] [PMC free article] [PubMed] [Google Scholar]
- Iraji, A. , Calhoun, V. D. , Wiseman, N. M. , Davoodi‐Bojd, E. , Avanaki, M. R. N. , Haacke, E. M. , & Kou, Z. (2016). The connectivity domain: Analyzing resting state fMRI data using feature‐based data‐driven and model‐based methods. NeuroImage, 134, 494–507. [DOI] [PMC free article] [PubMed] [Google Scholar]
- Kahn, R. S. , Sommer, I. E. , Murray, R. M. , Meyer‐Lindenberg, A. , Weinberger, D. R. , Cannon, T. D. , … Insel, T. R. (2015). Schizophrenia. Nature Reviews Disease Primers, 1, 15067. [DOI] [PubMed] [Google Scholar]
- Karahanoglu, F. I. , & Van De Ville, D. (2015). Transient brain activity disentangles fMRI resting‐state dynamics in terms of spatially and temporally overlapping networks. Nature Communications, 6, 7751. [DOI] [PMC free article] [PubMed] [Google Scholar]
- Khanna, A. , Pascual‐Leone, A. , Michel, C. M. , & Farzan, F. (2015). Microstates in resting‐state EEG: Current status and future directions. Neuroscience and Biobehavioral Reviews, 49, 105–113. [DOI] [PMC free article] [PubMed] [Google Scholar]
- Kiviniemi, V. , Starck, T. , Remes, J. , Long, X. , Nikkinen, J. , Haapea, M. , … Tervonen, O. (2009). Functional segmentation of the brain cortex using high model order group PICA. Human Brain Mapping, 30, 3865–3886. [DOI] [PMC free article] [PubMed] [Google Scholar]
- Kiviniemi, V. , Vire, T. , Remes, J. , Elseoud, A. A. , Starck, T. , Tervonen, O. , & Nikkinen, J. (2011). A sliding time‐window ICA reveals spatial variability of the default mode network in time. Brain Connectivity, 1, 339–347. [DOI] [PubMed] [Google Scholar]
- Koenig, T. , Prichep, L. , Lehmann, D. , Sosa, P. V. , Braeker, E. , Kleinlogel, H. , … John, E. R. (2002). Millisecond by millisecond, year by year: Normative EEG microstates and developmental stages. NeuroImage, 16, 41–48. [DOI] [PubMed] [Google Scholar]
- Lee, M. H. , Smyser, C. D. , & Shimony, J. S. (2013). Resting‐state fMRI: A review of methods and clinical applications. AJNR. American Journal of Neuroradiology, 34, 1866–1872. [DOI] [PMC free article] [PubMed] [Google Scholar]
- Lee, T. W. , & Xue, S. W. (2018). Functional connectivity maps based on hippocampal and thalamic dynamics may account for the default‐mode network. The European Journal of Neuroscience, 47, 388–398. [DOI] [PubMed] [Google Scholar]
- Leech, R. , Kamourieh, S. , Beckmann, C. F. , & Sharp, D. J. (2011). Fractionating the default mode network: Distinct contributions of the ventral and dorsal posterior cingulate cortex to cognitive control. The Journal of Neuroscience, 31, 3217–3224. [DOI] [PMC free article] [PubMed] [Google Scholar]
- Lehmann, D. , Strik, W. K. , Henggeler, B. , Koenig, T. , & Koukkou, M. (1998). Brain electric microstates and momentary conscious mind states as building blocks of spontaneous thinking: I. Visual imagery and abstract thoughts. International Journal of Psychophysiology, 29, 1–11. [DOI] [PubMed] [Google Scholar]
- Leonardi, N. , Richiardi, J. , Gschwind, M. , Simioni, S. , Annoni, J. M. , Schluep, M. , … Van De Ville, D. (2013). Principal components of functional connectivity: A new approach to study dynamic brain connectivity during rest. NeuroImage, 83, 937–950. [DOI] [PubMed] [Google Scholar]
- Lin, Q. H. , Liu, J. , Zheng, Y. R. , Liang, H. , & Calhoun, V. D. (2010). Semiblind spatial ICA of fMRI using spatial constraints. Human Brain Mapping, 31, 1076–1088. [DOI] [PMC free article] [PubMed] [Google Scholar]
- Liu, X. , Chang, C. , & Duyn, J. H. (2013). Decomposition of spontaneous brain activity into distinct fMRI co‐activation patterns. Frontiers in Systems Neuroscience, 7, 101. [DOI] [PMC free article] [PubMed] [Google Scholar]
- Liu, X. , & Duyn, J. H. (2013). Time‐varying functional network information extracted from brief instances of spontaneous brain activity. Proceedings of the National Academy of Sciences of the United States of America, 110, 4392–4397. [DOI] [PMC free article] [PubMed] [Google Scholar]
- Ma, S. , Calhoun, V. D. , Phlypo, R. , & Adali, T. (2014). Dynamic changes of spatial functional network connectivity in healthy individuals and schizophrenia patients using independent vector analysis. NeuroImage, 90, 196–206. [DOI] [PMC free article] [PubMed] [Google Scholar]
- Ma, S. , Correa, N. M. , Li, X. L. , Eichele, T. , Calhoun, V. D. , & Adali, T. (2011). Automatic identification of functional clusters in FMRI data using spatial dependence. IEEE Transactions on Biomedical Engineering, 58, 3406–3417. [DOI] [PMC free article] [PubMed] [Google Scholar]
- Matsui, T. , Murakami, T. , & Ohki, K. (2018). Neuronal origin of the temporal dynamics of spontaneous BOLD activity correlation. Cerebral Cortex. 10.1093/cercor/bhy045 (in press). [DOI] [PubMed] [Google Scholar]
- Menon, V. (2011). Large‐scale brain networks and psychopathology: A unifying triple network model. Trends in Cognitive Sciences, 15, 483–506. [DOI] [PubMed] [Google Scholar]
- Meunier, D. , Lambiotte, R. , & Bullmore, E. T. (2010). Modular and hierarchically modular organization of brain networks. Frontiers in Neuroscience, 4, 200. [DOI] [PMC free article] [PubMed] [Google Scholar]
- Nasiriavanaki, M. , Xia, J. , Wan, H. , Bauer, A. Q. , Culver, J. P. , & Wang, L. V. (2014). High‐resolution photoacoustic tomography of resting‐state functional connectivity in the mouse brain. Proceedings of the National Academy of Sciences of the United States of America, 111, 21–26. [DOI] [PMC free article] [PubMed] [Google Scholar]
- Newman, M. E. (2006). Modularity and community structure in networks. Proceedings of the National Academy of Sciences of the United States of America, 103, 8577–8582. [DOI] [PMC free article] [PubMed] [Google Scholar]
- Petersen, S. E. , & Sporns, O. (2015). Brain networks and cognitive architectures. Neuron, 88, 207–219. [DOI] [PMC free article] [PubMed] [Google Scholar]
- Power, J. D. , Barnes, K. A. , Snyder, A. Z. , Schlaggar, B. L. , & Petersen, S. E. (2012). Spurious but systematic correlations in functional connectivity MRI networks arise from subject motion. NeuroImage, 59, 2142–2154. [DOI] [PMC free article] [PubMed] [Google Scholar]
- Preti, M. G. , Bolton, T. A. , & Van De Ville, D. (2017). The dynamic functional connectome: State‐of‐the‐art and perspectives. NeuroImage, 160, 41–54. [DOI] [PubMed] [Google Scholar]
- Preti, M. G. , & Van De Ville, D. (2017). Dynamics of functional connectivity at high spatial resolution reveal long‐range interactions and fine‐scale organization. Scientific Reports, 7, 12773. [DOI] [PMC free article] [PubMed] [Google Scholar]
- Sakoglu, U. , Pearlson, G. D. , Kiehl, K. A. , Wang, Y. M. , Michael, A. M. , & Calhoun, V. D. (2010). A method for evaluating dynamic functional network connectivity and task‐modulation: Application to schizophrenia. Magma, 23, 351–366. [DOI] [PMC free article] [PubMed] [Google Scholar]
- Seeley, W. W. , Crawford, R. K. , Zhou, J. , Miller, B. L. , & Greicius, M. D. (2009). Neurodegenerative diseases target large‐scale human brain networks. Neuron, 62, 42–52. [DOI] [PMC free article] [PubMed] [Google Scholar]
- Segall, J. M. , Turner, J. A. , van Erp, T. G. , White, T. , Bockholt, H. J. , Gollub, R. L. , … Calhoun, V. D. (2009). Voxel‐based morphometric multisite collaborative study on schizophrenia. Schizophrenia Bulletin, 35, 82–95. [DOI] [PMC free article] [PubMed] [Google Scholar]
- Shine, J. M. , Koyejo, O. , & Poldrack, R. A. (2016). Temporal metastates are associated with differential patterns of time‐resolved connectivity, network topology, and attention. Proceedings of the National Academy of Sciences of the United States of America, 113, 9888–9891. [DOI] [PMC free article] [PubMed] [Google Scholar]
- Shinn, A. K. , Baker, J. T. , Cohen, B. M. , & Ongur, D. (2013). Functional connectivity of left Heschl's gyrus in vulnerability to auditory hallucinations in schizophrenia. Schizophrenia Research, 143, 260–268. [DOI] [PMC free article] [PubMed] [Google Scholar]
- Shirer, W. R. , Ryali, S. , Rykhlevskaia, E. , Menon, V. , & Greicius, M. D. (2012). Decoding subject‐driven cognitive states with whole‐brain connectivity patterns. Cerebral Cortex, 22, 158–165. [DOI] [PMC free article] [PubMed] [Google Scholar]
- Skudlarski, P. , Jagannathan, K. , Anderson, K. , Stevens, M. C. , Calhoun, V. D. , Skudlarska, B. A. , & Pearlson, G. (2010). Brain connectivity is not only lower but different in schizophrenia: A combined anatomical and functional approach. Biological Psychiatry, 68, 61–69. [DOI] [PMC free article] [PubMed] [Google Scholar]
- Sorg, C. , Riedl, V. , Muhlau, M. , Calhoun, V. D. , Eichele, T. , Laer, L. , … Wohlschlager, A. M. (2007). Selective changes of resting‐state networks in individuals at risk for Alzheimer's disease. Proceedings of the National Academy of Sciences of the United States of America, 104, 18760–18765. [DOI] [PMC free article] [PubMed] [Google Scholar]
- Staal, W. G. , Hulshoff Pol, H. E. , Schnack, H. G. , van Haren, N. E. , Seifert, N. , & Kahn, R. S. (2001). Structural brain abnormalities in chronic schizophrenia at the extremes of the outcome spectrum. The American Journal of Psychiatry, 158, 1140–1142. [DOI] [PubMed] [Google Scholar]
- Stephan, K. E. , Baldeweg, T. , & Friston, K. J. (2006). Synaptic plasticity and dysconnection in schizophrenia. Biological Psychiatry, 59, 929–939. [DOI] [PubMed] [Google Scholar]
- Tagliazucchi, E. , Balenzuela, P. , Fraiman, D. , & Chialvo, D. R. (2012). Criticality in large‐scale brain FMRI dynamics unveiled by a novel point process analysis. Frontiers in Physiology, 3, 15. [DOI] [PMC free article] [PubMed] [Google Scholar]
- Tie, Y. , Rigolo, L. , Norton, I. H. , Huang, R. Y. , Wu, W. , Orringer, D. , … Golby, A. J. (2014). Defining language networks from resting‐state fMRI for surgical planning—A feasibility study. Human Brain Mapping, 35, 1018–1030. [DOI] [PMC free article] [PubMed] [Google Scholar]
- Trapp, C. , Vakamudi, K. , & Posse, S. (2018). On the detection of high frequency correlations in resting state fMRI. NeuroImage, 164, 202–213. [DOI] [PMC free article] [PubMed] [Google Scholar]
- Tu, P. C. , Lee, Y. C. , Chen, Y. S. , Hsu, J. W. , Li, C. T. , & Su, T. P. (2015). Network‐specific cortico‐thalamic dysconnection in schizophrenia revealed by intrinsic functional connectivity analyses. Schizophrenia Research, 166, 137–143. [DOI] [PubMed] [Google Scholar]
- van den Heuvel, M. P. , & Hulshoff Pol, H. E. (2010). Exploring the brain network: A review on resting‐state fMRI functional connectivity. European Neuropsychopharmacology, 20, 519–534. [DOI] [PubMed] [Google Scholar]
- van den Heuvel, M. P. , Mandl, R. C. , Stam, C. J. , Kahn, R. S. , & Hulshoff Pol, H. E. (2010). Aberrant frontal and temporal complex network structure in schizophrenia: A graph theoretical analysis. The Journal of Neuroscience, 30, 15915–15926. [DOI] [PMC free article] [PubMed] [Google Scholar]
- Vercammen, A. , Knegtering, H. , den Boer, J. A. , Liemburg, E. J. , & Aleman, A. (2010). Auditory hallucinations in schizophrenia are associated with reduced functional connectivity of the temporo‐parietal area. Biological Psychiatry, 67, 912–918. [DOI] [PubMed] [Google Scholar]
- Vidaurre, D. , Smith, S. M. , & Woolrich, M. W. (2017). Brain network dynamics are hierarchically organized in time. Proceedings of the National Academy of Sciences of the United States of America, 114, 12827–12832. [DOI] [PMC free article] [PubMed] [Google Scholar]
- Wang, X. , Xu, M. , Song, Y. , Li, X. , Zhen, Z. , Yang, Z. , & Liu, J. (2014). The network property of the thalamus in the default mode network is correlated with trait mindfulness. Neuroscience, 278, 291–301. [DOI] [PubMed] [Google Scholar]
- Yaesoubi, M. , Adali, T. , & Calhoun, V. D. (2018). A window‐less approach for capturing time‐varying connectivity in fMRI data reveals the presence of states with variable rates of change. Human Brain Mapping, 39, 1626–1636. [DOI] [PMC free article] [PubMed] [Google Scholar]
- Yaesoubi, M. , Miller, R. L. , & Calhoun, V. D. (2017). Time‐varying spectral power of resting‐state fMRI networks reveal cross‐frequency dependence in dynamic connectivity. PLoS One, 12, e0171647. [DOI] [PMC free article] [PubMed] [Google Scholar]
- Yu, Q. , Du, Y. , Chen, J. , He, H. , Sui, J. , Pearlson, G. , & Calhoun, V. D. (2017). Comparing brain graphs in which nodes are regions of interest or independent components: A simulation study. Journal of Neuroscience Methods, 291, 61–68. [DOI] [PMC free article] [PubMed] [Google Scholar]
- Zhou, C. , Zemanova, L. , Zamora, G. , Hilgetag, C. C. , & Kurths, J. (2006). Hierarchical organization unveiled by functional connectivity in complex brain networks. Physical Review Letters, 97, 238103. [DOI] [PubMed] [Google Scholar]
- Zuo, X. N. , Kelly, C. , Adelstein, J. S. , Klein, D. F. , Castellanos, F. X. , & Milham, M. P. (2010). Reliable intrinsic connectivity networks: Test‐retest evaluation using ICA and dual regression approach. NeuroImage, 49, 2163–2177. [DOI] [PMC free article] [PubMed] [Google Scholar]
Associated Data
This section collects any data citations, data availability statements, or supplementary materials included in this article.
Supplementary Materials
Supporting Information File S1. Detailed information of the hICNs including spatial maps, coordinates of peak activations, and temporal information.
Supporting Information File S2. The orthogonal view of the spatial domain states associated with nine functional domains thresholded at |Z| > 1.96 (p = 0.05). Each spatial map represents the centroid of a cluster, and sagittal, coronal, and axial slices are shown at the peak activation of the centroids. Hot and cold colors represent positive and negative association of voxels to the functional domains. The total number and percentage of occurrences are listed above each centroid. Voxel‐wise coherent states were marked using green asterisks. In voxel‐wise coherent states, the associated regions show a similar pattern of association, either positive or negative, and voxel‐wise incoherent states contain both regions with positive and negative associations to functional domains. It is worth mentioning that because the orthogonal view represents the peak activations of the centroids, we cannot see both positive and negative contributions for voxel‐wise incoherent states for some cases including the state 5 of the frontal default mode domain and state 3 of the language domain.
Supporting Information File S3. The cluster centroids for k = 3 to 10 for nine functional domain thresholded at |Z| > 1.96 (p = 0.05). For each k, the Kmeans algorithm was repeated 100 times on the exemplars with different initializations using k‐means++ algorithm. Each spatial map represents the centroid of a cluster, and sagittal, coronal, and axial slices are shown at the peak activation of the centroids. Hot and cold colors represent the positive and negative associations of voxels to the functional domains. The total number and percentage of occurrences are listed above each centroid. The dashed rectangle highlights the clustering result presented in the main text which was selected using elbow criterion. The total number and percentage of occurrences are listed above each centroid.
Supporting Information File S4. The relationship between the amplitude of the BOLD signal and regions associations to functional domains (FDs). Examples of average BOLD signal of regions across spatial domain states of FDS. Each violin plot represents the average BOLD signal of a region for different states of a FD. The μ (green dashed line) and σ are the average and standard deviation of BOLD signal for each region across all time points, and the black line represents the average of the BOLD signal of a region across all subjects in the corresponding state. Red and blue colors represent the states with positive and negative associations of regions to FDs, the light gray color indicates no association between corresponding FD and region. The results show that when regions are positively/negatively associated with FDs, their average BOLD signal is above/below its own average across all timepoint. This suggests the variation in a region association to a FD is related to its neural activity observed by the amplitude of BOLD signal. The abbreviation and regions labels listed above each violin plot are based on the Brainnetome atlas. Amyg (Amygdala), BG (Basal Ganglia), CG (Cingulate Gyrus), IFG (Inferior Frontal Gyrus), INS (Insular Gyrus), IPL (Inferior Parietal Lobule), LOcC (lateral Occipital Cortex), MFG (Middle Frontal Gyrus), MTG (Middle Temporal Gyrus), MVOcC (MedioVentral Occipital Cortex), OrG (Orbital Gyrus), PCun (Precuneus), PhG (Parahippocampal Gyrus), PoG (Postcentral Gyrus), PrG (Precentral Gyrus), pSTS (posterior Superior Temporal Sulcus), SFG (Superior Frontal Gyrus), SPL (Superior Parietal Lobule), STG (Superior Temporal Gyrus), and Tha (Thalamus).
Supporting Information File S5
Supporting Information File S6. Spatiotemporal variations of functional domains (FDs). Each chart represents the regions associations to a functional domain. The brain anatomical parcellation is based on the Brainnetome atlas. The total number associated regions and the mean and standard error of variability index (VI) are listed above each chart. The results show different regions are associated to functional domains at different states. Hot and cold colors represent positive and negative associations and gray represents dissociation of the regions at the states. VIs represent the overall variability of each functional domain where frontoparietal and subcortical domains shows maximum and minimum variations as it was previously observed a multi‐task fMRI study (Cole et al., 2013). The abbreviation and regions labels are the same as defined in the Brainnetome atlas. SFG (Superior Frontal Gyrus), MFG (Middle Frontal Gyrus), IFG (Inferior Frontal Gyrus), OrG (Orbital Gyrus), PrG (Precentral Gyrus), PCL(Paracentral Lobule), STG (Superior Temporal Gyrus), MTG (Middle Temporal Gyrus), ITG (Inferior Temporal Gyrus), FuG (Fusiform Gyrus), PhG (Parahippocampal Gyrus), pSTS (posterior Superior Temporal Sulcus), SPL (Superior Parietal Lobule), IPL (Inferior Parietal Lobule), PCun (Precuneus), PoG (Postcentral Gyrus), INS (Insular Gyrus), CG (Cingulate Gyrus), MVOcC (MedioVentral Occipital Cortex), LOcC (lateral Occipital Cortex), Amyg (Amygdala), Hipp (Hippocampus), BG (Basal Ganglia), Tha (Thalamus).
Supporting Information File S7
Supporting Information File S8. Functional domains statistical comparisons between healthy subjects and schizophrenia (SZ) patients. The green bars represent higher associations (positive or negative) of regions to the functional domains in healthy subjects than SZ patients, and the silver bar shows a higher association (or activity) in SZ patients. The significant differences are labels as “State No_regions abbervation (hemisphere size)”. For example “S1_Tha.1(R)” is State 1_thalamus subregion 1(Right hemisphere). Regoins abbreviation is based on the Brainnetome atlas. The results indicate compared to healthy subjects; the SZ patients have significantly weaker activity (all but one) across different functional domains. Group differences were evaluated using a general linear model (GLM) including age, site, gender, and mean framewise displacement (meanFD) as covariates. meanFD was added as a covariate to control for its (motion) potential effect in group difference related to the health conditions. Although this seems enough to control its confounding influence, we performed further exploratory analysis on a subsample of the data with little head motion (meanFD<0.45) and no significant difference in meanFD between two groups (p‐value= 0.5) in order to address current concerns on the importance of head motion in fMRI studies. Our analysis on the subsample of the data demonstrated a similar pattern in group difference as using the full dataset. The bars with red edge (border) are those comparisons that did not show significant differences on subsample data. Interestingly, these comparisons only include those with small statistical significance differences which suggests a larger sample size can possibility to detect the differences as it was shown in the analysis using full dataset. In other words, the reason that they are not significant in subsample could be related to the statistical power rather than motion.
Movie S1 Attention domain_subject 309
Movie S2 Auditory domain_subject 263
Movie S3 Default mode domain_subject 068
Movie S4 Frontal Default mode domain_subject 223
Movie S5 Frontoparietal domain_subject 284
Movie S6 Language domain_subject 023
Movie S7 Somatomotor domain_subject 052
Movie S8 Subcortical domain_subject 181
Movie S9 Visual domain_subject 260
Movie S10 Subcortical domain_subject 250