Abstract
The oncogenic Ras protein adopts various specific conformational states to execute its function in signal transduction. The large number of Ras structures obtained from X-ray and NMR experiments illustrate the diverse conformations that Ras adopts. It is difficult, however, to connect specific structural features with Ras functions. In this work, we report free energy landscape of Ras∙GTP based on extensive explicit solvent simulations. The free energy map clearly shows that the functional state 2 of Ras∙GTP in fact has two distinct substates, denoted here as “Tyr32in” and “Tyr32out”. Unbiased MD simulations show that the two substrates interconvert on the sub-microsecond scale in solution, pointing to a novel mechanism for Ras∙GTP to selectively interact with GAPs and effectors. This proposal is further supported by time-resolved FTIR experiments, which demonstrate that Tyr32 destabilizes the Ras·GAP complex and facilitates an efficient termination of Ras signaling.
Keywords: Ras protein, functional states, conformational interconversion, molecular dynamics, FTIR spectroscopy
Graphical abstract
Ras adopts Tyr32in and Tyr32out to interact with effector and GAP respectively.
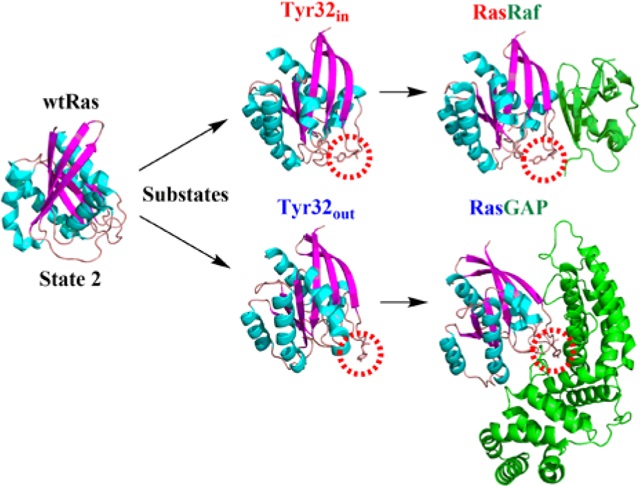
The Ras protein participates in a series of important signal transduction processes in cells and its malfunction often leads to tumors.1–2 It is well known that Ras is a molecular switch that can adopt an “on” or an “off” state to regulate its interaction with upstream or downstream kinases.3 The active Ras can interact with effectors such as Raf to conduct the signal downstream. On the other hand, switching of Ras from the active to inactive state is controlled by the GTP hydrolysis to GDP in Ras; the hydrolysis activity can be accelerated by several orders of magnitude by interacting with GTPase activating proteins(GAPs).4 To understand the functions of Ras and interactions with other kinases, many researchers have put their efforts to obtain the three-dimensional structure of Ras by means of various experimental techniques such as X-ray crystallography and NMR.5–18 Until now, more than one hundred structures of isolated Ras with GTP, GDP and analogues such as GppNHp, as well as its mutants have been obtained and their structures have been deposited in the Protein Data Bank online(Section 1, SI). However, the functional implication of divergent conformations19 of Ras is still not fully understood. In this work, we report a comprehensive simulation study of conformational states adopted by Ras∙GTP in solution. The results lead to the proposal that the “on” state of Ras∙GTP consists of two interconverting substates that preferentially interact with GAPs and effectors, respectively. This dynamic scenario for the regulation of Ras function is further verified by time resolved Fourier-transform infrared spectroscopy (FTIR).20–27
In 1990, Pai et al.5 reported the crystal structure of Ras in complex with the GTP analogue GppNHp, where the hydroxyl oxygen atom of residue Thr35 coordinates to the Mg2+ ion at the active site of Ras and the hydroxyl group of Tyr32 points outward. Later, it was firstly revealed by Geyer et al. using 31P NMR spectroscopy that the complex Ras∙GppNHp exists in two main conformational states, termed state 1 and state 2.10 A series of following NMR studies by Kalbitzer and co-workers11–15 and FTIR studies27 demonstrated that Ras in complex with GTP and its analogues indeed exists in two conformational states in equilibrium; the wildtype Ras∙GTP complex was predominantly in state 2 at the experimental temperature 278K.15 Kalbitzer et al.14 proposed that state 1 of Ras represents the conformation interacting with guanine nucleotide exchange factor(GEF) and that Ras has a minimal number of eight functional states in order to complete the GTP cycle.28 The existence of state 1 of Ras has been supported by the crystal structure (PDB ID: 4EFL) of Muraoka et al.;29 the structure is characterized by the broken hydrogen-bond interactions between Thr35 and Mg2+ ion, as well as between Tyr32 and oxygen atom in the γ-group of triphosphate of GTP. The loop in the switch I region in state 1 also exhibits large thermal fluctuation as indicated by the B-factors. As for state 2, the crystal structures available for wildtype Ras such as 5P21,5 1CTQ,7 1QRA,7 1P2S,16 3RRY,17 4DLR,18 3L8Y30 and 3L8Z30 show the distinct conformational divergence in the switch I region, especially for the orientations of residues Tyr32.
Numerous molecular simulations were carried out to characterize the structural features of conformations31–33 of Ras∙GTP as well as Ras∙GDP, the conformational transition34,35 between Ras∙GTP to Ras∙GDP and dynamic evolution of Ras mutants.36–40 However, it remains unclear which specific conformation Ras∙GTP adopts in solution to preferentially interact with GAP or effectors when it is in state 2.15 To reveal the specific conformational features of Ras∙GTP in state 2, we performed extensive Replica-Exchange molecular dynamics (REMD)41 simulation(Section 2, SI) to explore the conformational distribution of Ras∙GTP in solution, using the simulation package Gromacs 4.5.5.42–43 Distinguished from these previous efforts,31–40 our work aims to establish an explicit connection between specific conformations and functional states of Ras.
We used the crystal structure of Ras in state 2 (PDB ID: 3L8Z) as the initial structure and Amber99sb force field44 as the potential function; the substrate GppNHp was substituted by GTP to construct the Ras∙GTP complex. The whole system was then immersed in a cubic water box with 6902 water molecules and the solution environment was set to be physiological with 0.155 mol/L of NaCl. A total number of 84 replicas were used in the REMD simulation, with the sampling temperatures ranging from 278 K to 430 K. The simulation time for each replica at each temperature is 200 ns and the cumulative trajectory length is 16.8 μs. Based on the trajectories sampled at 278 K, we projected the free energy landscape onto the two-dimensional space (Fig. 1) spanned by root-mean square deviation (RMSD) and the radius of gyration (Rg).
Figure 1.
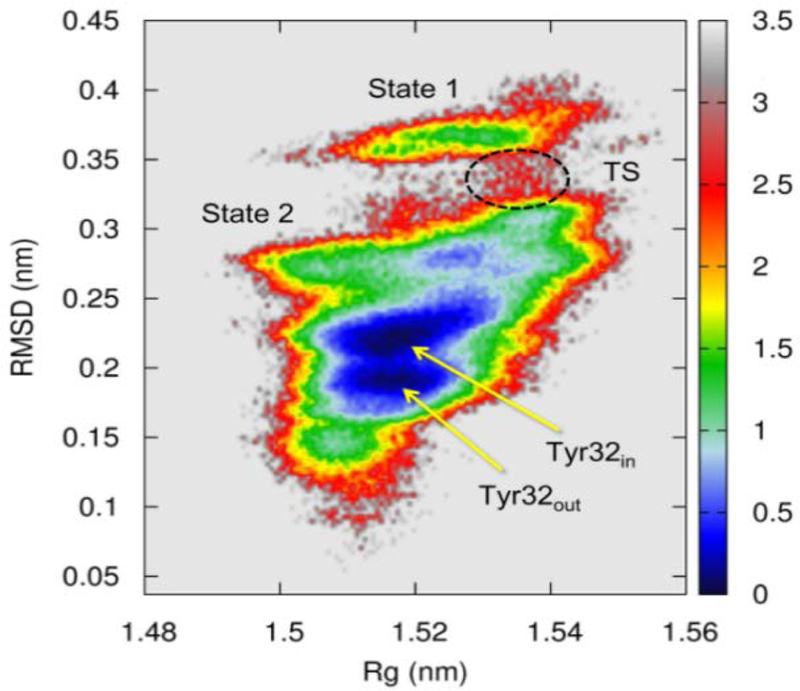
Constructed two-dimensional free energy contour of Ras at 278 K, with respect to RMSD relative to 3L8Z and Rg of all-atoms in Ras. The transition state (TS) region connects state 1 and state 2. State 2 features two substates, denoted by Tyr32in and Tyr32out, respectively. The units of RMSD and Rg are in nm and free energy ΔG is in kcal/mol.
Figure 1 shows that the two free energy basins are well-separated, approximately located in regions with the RMSD values of 0.1–0.33 and 0.33–0.40 nm, respectively. Since the reference structure (3L8Z) is believed to represent state 2, it is sensible to postulate that the basin located at the larger RMSD of 0.33–0.40 nm represents state 1.29 To verify this, we extracted the structures from this basin and conducted clustering analysis on these structures (Section 3, SI). It was found that the major representative structure obtained by clustering analysis is indeed similar to the crystal structure 4EFL, with its loop regions exhibiting large fluctuations. The free energy difference ΔΔG12 between states 2 and 1 from the free energy surface is approximately −1.40 kcal/mol, which is in agreement with the value of −1.33 kcal/mol measured from the NMR experiment.15 The TS connecting the two basins is located at the region with the RMSD of 0.33 nm and Rg of 1.54 nm. Since the free energy barrier is likely notably higher than kBT, sampling of the TS region in the free energy map is not as extensive as for the free energy basins.
A notable feature of the free energy surface in Figure 1 is that state 2 is featured with two adjacent subbasins with similar energetics. To characterize the structures representing the two substates, we performed clustering analysis on the structures extracted from these subbasins and least-square fitting with crystal structures of state 2. The analysis indicates that the major structure to represent the top subbasin is similar to the structure 3L8Z(Section 4, SI), with the hydroxyl group of Tyr32 pointing to GTP; thus the substate is denoted as “Tyr32in”. Meanwhile, the major structure to represent the bottom subbasin resembles the crystal structure 1QRA(Section 5, SI), with Tyr32 pointing into solution; thus the substate is denoted as “Tyr32out”. In other words, we postulate that the structures 3L8Z and 1QRA represent two distinct substates of isolated Ras. Both structures were also found in earlier MD simulations.45 To support the hypothesis further, we collected a set of crystal structures for isolated wildtype Ras and performed least-square fit with each other. The overlapped structures in Figure 2(a) show that the Tyr32 residues in these structures prefer either “in” or “out” orientations, in accord with the observation of two subbasins for state 2 in Figure 1. Notably, all these structures are featured with the stable coordination of Thr35 to Mg2+ ion, no matter whether Tyr32 stays “in” or “out”. Thus, the stable coordination of Thr35 to Mg2+ could be considered as one of the fingerprints for state 2; this is supported by the observation that the mutation T35A led to the shift of equilibrium toward state 1.15
Figure 2.
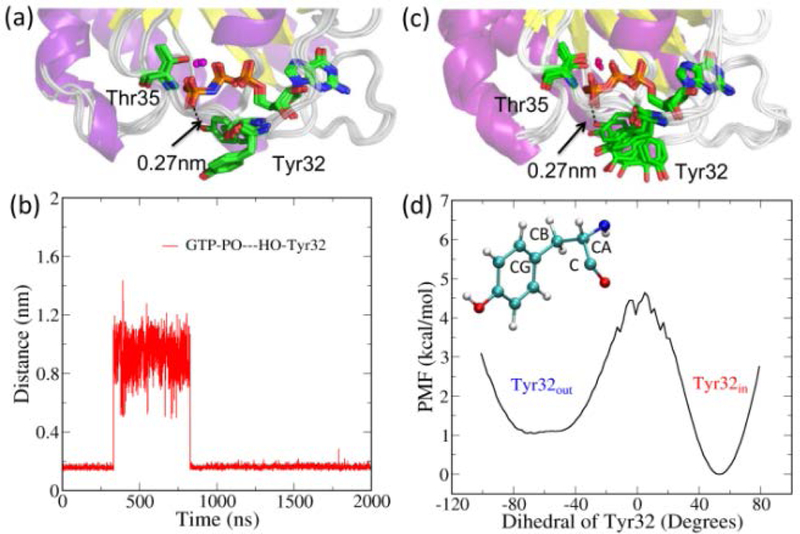
(a) A cartoon representation of overlapped structures of isolated Ras, with the PDB IDs: 5P21, 1CTQ, 1QRA, 1P2S, 3L8Y, 3L8Z, 3RRY and 4DLR. The heavy atoms in 3L8Z were taken as the reference for least-square fitting. (b) The measured distances between the O atom of γ-group in GTP and H atom of the hydroxyl group of Tyr32 during a 2 μs MD trajectory. (c) A schematic representation of switching of Tyr32 between “in” and “out” using the snapshots taken from the MD trajectory. (d) Calculated potential of mean force (PMF) for the interconversion of Tyr32out and Tyr32in substates by projecting the REMD trajectory on the reaction coordinate of the dihedral C-CA-CB-CG of Tyr32 residue.
To explore the time scale associated with the dynamic conversion between Tyr32in and Tyr32out substates, we performed an unbiased 2 μs all-atom MD simulation for isolated Ras in solution at the experimental temperature 278K.15 The crystal structure of 3L8Z30 was chosen as the initial conformation in solution. More details about the MD simulation are provided in the Section 2 of SI. Figure 2(b) shows the measured distance between the oxygen atom of γ-phosphate in GTP and hydrogen atom of hydroxyl of Tyr32 during the simulation. The hydroxyl group of Tyr32 forms stable hydrogen-bonding interaction with one oxygen atom of the γ-phosphate of GTP during the first 320 ns and Ras stays in the Tyr32in substate. After that, the hydrogen bond is broken and Tyr32 moves away from GTP, as indicated by the increased distance between them. Subsequently, Ras stays in the Tyr32out substate for 500 ns and then transforms back to the Tyr32in substate spontaneously at 820 ns. The snapshots extracted from the MD trajectory in Figure 2(c) illustrate the conversion between the two substates. The closest distance between the hydroxyl oxygen of Tyr32 and the GTP γ-oxygen atom from the MD snapshots is 0.27 nm, same as the value of 0.27 nm observed in the crystal structure of 3L8Y.30 Further, the calculated potential mean force with respect to the dihedral of Tyr32 in Figure 2(d) shows that the conversion of Tyr32in to Tyr32out needs to overcome a barrier of 4.5 kcal/mol to break the H-bonding interaction of the P-O group of GTP and H-O group of Tyr32. The substate Tyr32out appears to be less stable than Tyr32in by 1 kcal/mol.
The comparison of extensive MD simulations with Ras crystal structures strongly indicates that the isolated Ras in solution adopts two substates in state 2 with subtle structural differences. What functions are associated with these two substates? In previous NMR studies by Spoerner et al.,15 the state of Ras complexed with effectors has been assigned as state 2, since it exhibit the spectroscopic character similar to the free Ras in solution. Later, the state of Ras complexed with GAP was assigned as state 3 with the high-pressure NMR.28 The Tyr32in and Tyr32out characterized by our analyzed structures from simulation might correspond to the state 2 and state 3 found in the NMR experiments. We hypothesize that Ras adopts the Tyr32in substate to interact with effectors such as Raf for downstream signal transduction, and adopts the Tyr32out substate to interact with GAPs for GTP hydrolysis. This proposal is postulated on the basis of comparison of known crystal structures of isolated Ras with the Ras complexes. It is found that the crystal structure of isolated Ras in 1QRA is similar to that of Ras in the RasGAP complex of 1WQ16 with a RMSD of 0.0505 nm (Section 6, SI); moreover, Tyr32out is considered as the specific substate to interact with GAP, since Tyr32 needs to move out to let the arginine finger of GAP to rotate into the cleft for GTP hydrolysis. On the other hand, the structure of Ras in 3L8Z is similar to that in RasRaf of 4G0N,46 with a RMSD of 0.0531 nm(Section 6, SI), which shows that Tyr32 points inwards as the β2 sheet of Ras interacts with Raf.
To test our hypothesis regarding the role of Tyr32 in determining the functions of the two substates of Ras, we performed FTIR experiments (Section 7, SI) with the Ras Y32A mutant and compared them with Ras wildtype. The time course of the GAP catalyzed hydrolysis reaction is considerably effected by the mutation of Tyr32. For wildtype three rates were observed.26 Instead of these three rates we can resolve only two rates in the GAP catalyzed reaction of Ras Y32A. The comparisons of the amplitude spectra clearly show that the first rate corresponds to the processes observed during the first two rates of wildtype. After these rates in both cases the protein bound Pi is formed.25 This can be seen in Figure 3, where the time course of the marker band for this state at 1186 cm−1 is shown. The slowest rate k3 corresponds to the Pi release, the absorption of the Pi intermediate vanishes.
Figure 3.
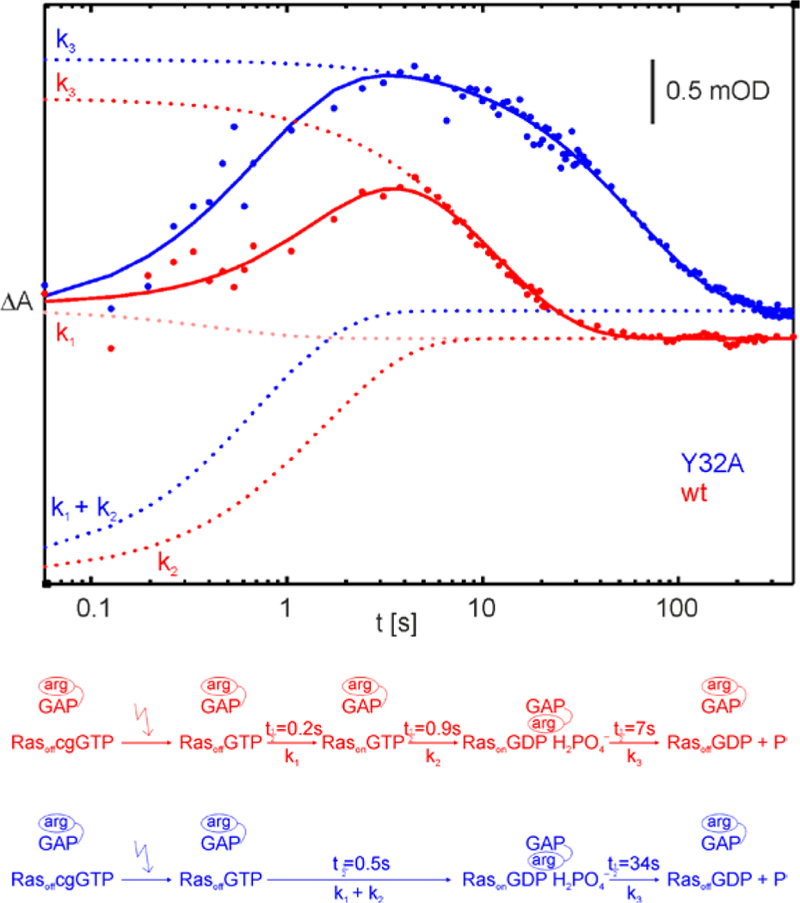
Time-dependent absorbance changes of a marker band for the protein bound intermediate during the GAP catalyzed hydrolysis reaction of Ras wt (red) and Ras Y32A (blue). As indicated in the scheme in the lower part of the Figure this intermediate is much more stable without Tyr32 present, indicating that this residue interferes with Ras GAP binding.
The comparison of the rate constants shows that the protein bound intermediate is formed faster by a factor of 2 when the Tyr32 is absent. This is in agreement with the presence of a Tyr32in population, where the Tyr needs to be pushed out for the GAP interaction. Another explanation would be that Tyr32 is destabilizing the Ras·GAP complex. Interestingly an even stronger kinetic effect is found for the Pi-release. Here the mutant is slower by a factor of 5. Thus Tyr32 induces a faster cleavage of the Ras·GAP complex. In turn the GAP protein is available for switching off another Ras much earlier leading to a more efficient termination of Ras signaling.
The experimental data obtained by FTIR support our hypothesis. In brief, a schematic illustration of how Ras function depends on its conformational features is shown in Figure 4. The cartoon representations of RasGAP, RasRaf and RasGEF complexes are drawn using the crystal structures with the PDB IDs 1WQ1,6 4G0N46 and 1BKD.47 The wildtype Ras possesses two specific Tyr32out and Tyr32in substates in state 2, in which Ras can interact with GAPs for GTP hydrolysis and effectors for signal transduction. The two substates can interconvert to each other at the sub-microsecond time scale by as residue Tyr32 moves into or out of the catalytic cleft of Ras. Meanwhile, Ras also can adopt state 1 to interact with GEF for the exchange of GTP and GDP. The equilibrium between state 2 and state 1 occurs at a timescale of seconds, as observed in NMR experiments.15
Figure 4.
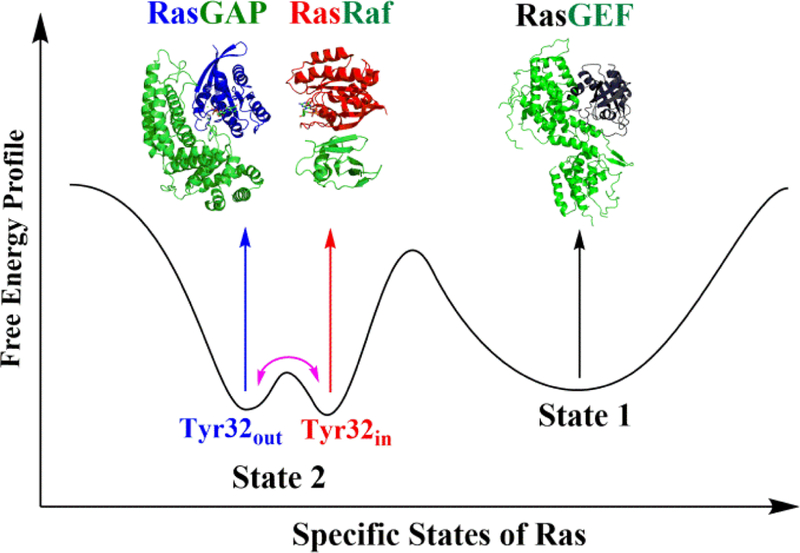
A schematic illustration of specific conformational states of Ras associated with its functions, where the purple double-head arrow indicates the interconversion between the Tyr32out and Tyr32in substates.
Finally, the significant conclusions drawn from this work are summarized below: first, the two-dimensional free energy surface provides detailed energetics associated with the conformational distribution of isolated Ras, as well as a solid basis for understanding the structural divergence of Ras obtained by various experimental techniques so far, especially for differentiating state 1 and state 2. Second, the constructed free energy surface reveals two subbasins for state 2, which correspond to the Tyr32in and Tyr32out substates that are supported by the existing crystal structures. The two substates differ from each other mainly in the orientation of Tyr32 and their interconversion was observed to occur on a sub-microsecond time scale in unbiased MD simulations. Third, analysis of the simulation results in the context of available crystal structures leads to the hypothesis that Ras adopts the Tyr32in substate to interact with effectors and the Tyr32out substate to interact with GAPs. The hypothesis was supported by the results of FTIR spectroscopy. Therefore, the current study reveals a dynamic mechanism through which Ras regulates its interaction with other proteins to fulfill its functions. The results also provide new clues to the design of Ras inhibitors30 and mechanistic study of GTP hydrolysis48–54 in Ras.
Supplementary Material
ACKNOWLEDGMENT
This work was supported by the National Natural Science Foundation of China (Grants No. 21773065 and 21433004), Natural Science Foundation of Shandong (ZR2016BB13) and Deutsche Forschungsgemeinschaft SFB 642 TP A1. QC acknowledges partial support from the National Institutes of Health grant 2R01-GM106443. We acknowledge the support of the NYU-ECNU Center for Computational Chemistry at NYU Shanghai. We also thank the supercomputer center of ECNU for providing computer time.
Footnotes
ASSOCIATED CONTENT
Supporting Information
PDB IDs of isolated Ras and mutants, details of REMD and MD simulations, results of clustering analyses and comparison of crystal structures of Ras and its complexes.
The authors declare no competing financial interests.
REFERENCES
- (1).Cox AD; Der CJ Ras History: the Saga Continues. Small GTPases 2010, 1, 2–27. [DOI] [PMC free article] [PubMed] [Google Scholar]
- (2).Wittinghofer A; Waldmann H Ras – A Molecular Switch Involved in Tumor Formation. Angew. Chem., Int. Ed. 2000, 39, 4192–4214. [DOI] [PubMed] [Google Scholar]
- (3).Vetter IR; Wittinghofer A The Guanine Nucleotide-Binding Switch in Three Dimensions. Science 2001, 294, 1299–1304. [DOI] [PubMed] [Google Scholar]
- (4).Wittinghofer A; Vetter IR Structure-function Relationships of the G domain, a Canonical Switch Motif. Annu. Rev. Biochem. 2011, 80, 943–971. [DOI] [PubMed] [Google Scholar]
- (5).Pai EF; Krengel U; Petsko GA; Goody RS; Kabsch W; Wittinghofer A Refined Crystal Structure of the Triphosphate Conformation of H-Ras p21 at 1.35Å Resolution: Implications for the Mechanism of GTP Hydrolysis. EMBO J. 1990, 9, 2351–2359. [DOI] [PMC free article] [PubMed] [Google Scholar]
- (6).Scheffzek K; Ahmadian MR; Kabsch W; Wiesmuller L; Lautwein A; Schmitz F; Wittinghofer A The Ras-RasGAP Complex: Structural Basis for GTPase Activation and its Loss in Oncogenic Ras Mutants. Science 1997, 277, 333–338. [DOI] [PubMed] [Google Scholar]
- (7).Scheidig AJ; Burmester C; Goody RS The Pre-Hydrolysis State of p21(ras) in Complex with GTP: New Insights into the Role of Water Molecules in the GTP Hydrolysis Reaction of Ras-like Proteins. Struct. Fold. Des. 1999, 7, 1311–1324. [DOI] [PubMed] [Google Scholar]
- (8).Schweins T; Geyer M; Scheffzek K; Warshel A; Kalbitzer HR; Wittinghofer A Substrate-assisted Catalysis as a Mechanism for GTP Hydrolysis of p21ras and Other GTP-binding Proteins. Nat. Struct. Biol. 1995, 2, 36–44. [DOI] [PubMed] [Google Scholar]
- (9).Wang JH; Xiao DG; Deng H; Callender R; Webb MR Vibrational Study of Phosphate Modes in GDP and GTP and their Interaction with Magnesium in Aqueous Solution. Biospectroscopy 1998, 4, 219–227. [DOI] [PubMed] [Google Scholar]
- (10).Geyer M; Schweins T; Herrmann C; Prisner T; Wittinghofer A; Kalbitzer HR Conformational Transitions in p21ras and its Complexes with the Effector Protein rafRBD and the GTPase Activating Protein GAP. Biochemistry 1996, 33, 10308–10320. [DOI] [PubMed] [Google Scholar]
- (11).Spoerner M; Wittinghofer A; Kalbitzer HR Perturbation of the Conformational Equilibria in Ras by Selective Mutations as Studied by 31P NMR Spectroscopy. FEBS Lett. 2004, 578, 305–310. [DOI] [PubMed] [Google Scholar]
- (12).Spoerner M; Nuehs A; Ganser P; Herrmann C; Wittinghofer A; Kalbitzer HR Conformational States of Ras Complexed with the GTP Analogue GppNHp or GppCH2p: Implications for the Interaction with Effector Proteins. Biochemistry 2005, 44, 2225–2236. [DOI] [PubMed] [Google Scholar]
- (13).Spoerner M; Nuehs A; Herrmann C; Steiner G; Kalbitzer HR Slow Conformational Dynamics of the Guanine Nucleotide-Binding Protein Ras Complexed with the GTP Analogue GTPγS. FEBS J. 2007, 274, 1419–1433. [DOI] [PubMed] [Google Scholar]
- (14).Kalbitzer HR; Spoerner M; Ganser P; Hozsa C; Kremer W Fundamental Link between Folding States and Functinal States of Proteins. J. Am. Chem. Soc. 2009, 131, 16714–16719. [DOI] [PubMed] [Google Scholar]
- (15).Spoerner M; Hozsa C; Poetzl J; Reiss K; Ganser P; Geyer M; Kalbitzer HR Conformational States of Human Rat sarcoma (Ras) Protein Complexed with its Natural Ligand GTP and their Role for Effector Interaction and GTP Hydrolysis. J. Biol. Chem. 2010, 285, 39768–39778. [DOI] [PMC free article] [PubMed] [Google Scholar]
- (16).Buhrman G; de Serrano V; Mattos C Organic Solvents Order the Dynamics Switch II in Ras Crystals. Structure 2003, 11, 747–751. [DOI] [PubMed] [Google Scholar]
- (17).Buhrman G; O’Connor C; Zerbe B; Kearney BM; Napoleon R; Kovrigina EA; Vajda S; Kozakov D; Kovrigin EL; Mattos C Analysis of Binding Site Hot Spots on the Surface of Ras GTPase. J. Mol. Biol. 2011, 413, 773–789. [DOI] [PMC free article] [PubMed] [Google Scholar]
- (18).Holzapfel G; Buhrman G; Mattos C Shift in the Equilibrium between On and Off States of the Allosteric Switch in Ras-GppNHp Affected by Small Molecules and Bulk Solvent Composition. Biochemistry 2012, 51, 6114–6126. [DOI] [PubMed] [Google Scholar]
- (19).Lu S; Jang H; Muratcioglu S; Gursoy A; Keskin O; Nussinov R; Zhang J Ras Conformational Ensembles, Allostery, and Signaling. Chem. Rev. 2016, 116, 6607–6665. [DOI] [PubMed] [Google Scholar]
- (20).Cepus V; Scheidig AJ; Goody RS; Gerwert K Time-Resolved FTIR Studies of the GTPase Reaction of H-Ras p21 Reveal a Key Role for the β-phosphate. Biochemistry 1998, 37, 10263–10271. [DOI] [PubMed] [Google Scholar]
- (21).Allin C; Gerwert K Ras Catalyzes GTP Hydrolysis by Shifting Negative Charges from γ-to β-phosphate as Revealed by Time‐Resolved FTIR Difference Spectroscopy. Biochemistry 2001, 40, 3037–3046. [DOI] [PubMed] [Google Scholar]
- (22).Allin C; Ahmadian MR; Kӧtting C; Gerwert K Monitoring the GAP Catalyzed H-Ras GTPase Reaction at Atomic Resolution in Real Time. Proc. Natl. Acad. Sci. U.S.A. 2001, 98, 7754–7759. [DOI] [PMC free article] [PubMed] [Google Scholar]
- (23).Kӧtting C; Gerwert K Time-Resolved FTIR Studies Provide Activation Free Energy, Activation Enthalpy and Activation Entropy for GTPase Reactions. Chem. Phys. 2004, 307, 227–232. [Google Scholar]
- (24).Kӧtting C; Gerwert K Proteins in Action Monitored by Time-Resolved FTIR Spectroscopy. ChemPhysChem 2005, 6, 881–888. [DOI] [PubMed] [Google Scholar]
- (25).Kӧtting C; Blessenohl M; Suveyzdis Y; Goody RS; Wittinghofer A; Gerwert K A Phosphoryl Transfer Intermediate in the GTPase Reaction of Ras in Complex with its GTPase-Activating Protein. Proc. Natl. Acad. Sci. U.S.A. 2006, 103, 1391113916. [DOI] [PMC free article] [PubMed] [Google Scholar]
- (26).Kӧtting C; Kallenbach A; Suveyzdis Y; Wittinghofer A; Gerwert K The GAP Arginine Finger Movement into the Catalytic Site of Ras Increases the Activation Entropy. Proc. Natl. Acad. Sci. U.S.A. 2008, 105, 6260–6265. [DOI] [PMC free article] [PubMed] [Google Scholar]
- (27).Kӧtting C; Kallenbach A; Suveyzdis Y; Eichholz C; Gerwert K Surface Change of Ras Enabling Effector Binding Monitored in Real Time at Atomic Resolution. ChemBioChem 2007, 8, 781–787. [DOI] [PubMed] [Google Scholar]
- (28).Kalbitzer HR; Rosnizeck IC; Munte CE; Narayanan SP; Kropf V; Spoerner M Intrinsic Allosteric Inhibition of Signaling Proteins by Targeting Rare Interaction States Detected by High Pressure NMR Spectroscopy. Angew. Chem., Int. Ed. 2013, 52, 14242–14246. [DOI] [PubMed] [Google Scholar]
- (29).Muraoka S; Shima F; Araki M; Inoue T; Yoshimoto A; Ijiri Y; Seki N; Tamura A; Kumasaka T; Yamamoto M; Kataoka T Crystal Structure of the State 1 Conformations of the GTP-bound H-Ras Protein and its Oncogenic G12V and Q61L Mutants. FEBS Lett. 2012, 586, 1715–1718. [DOI] [PubMed] [Google Scholar]
- (30).Rosnizeck IC; Spoerner M; Harsch T; Kreitner S; Filchtinski D; Herrmann C; Engel D; Kӧnig B; Kalbitzer HR Metal-Bis(2-picolyl)amine Complexes as State 1(T) Inhibitors of Activated Ras Protein. Angew. Chem., Int. Ed. 2012, 51, 10647–10651. [DOI] [PubMed] [Google Scholar]
- (31).Gorfe AA; Grant BJ; McCammon JA Mapping the Nucleotide and Isoform-Dependent Structural and Dynamical Features of Ras Proteins. Structure 2008, 16, 885–896. [DOI] [PMC free article] [PubMed] [Google Scholar]
- (32).Kobayashi C; Saito S Relation between the Conformational Heterogeneity and Reaction Cycle of Ras: Molecular Simulation of Ras. Biophys. J. 2010, 99, 3726–3734. [DOI] [PMC free article] [PubMed] [Google Scholar]
- (33).Kapoor A; Travesset A Differential Dynamics of RAS Isoforms in GDP-and GTP-bound States. Proteins 2015, 83, 1091–1106. [DOI] [PubMed] [Google Scholar]
- (34).Ma J; Karplus M Molecular Switch in Signal Transduction: Reaction Paths of the Conformational Changes in Ras p21. Proc. Natl. Acad. Sci. U.S.A. 1997, 94, 11905–11910. [DOI] [PMC free article] [PubMed] [Google Scholar]
- (35).Grant BJ; Gorfe AA; McCammon JA Ras Conformational Switching: Simulating Nucleotide-Dependent Conformational Transitions with Accelerated Molecular Dynamics. PLoS Comput. Biol. 2009, 5, e1000325. [DOI] [PMC free article] [PubMed] [Google Scholar]
- (36).Lukman S; Grant BJ; Gorfe AA; Grant GH; McCammon JA The Distinct Conformational Dynamics of K-Ras and H-Ras A59G. PLoS Comput. Biol. 2010, 6, e1000922. [DOI] [PMC free article] [PubMed] [Google Scholar]
- (37).Futatsugi N; Tsuda M Molecular Dynamics Simulations of Gly-12→Val Mutant of p21ras: Dynamic Inhibition Mechanism. Biophys. J. 2001, 81, 3483–3488. [DOI] [PMC free article] [PubMed] [Google Scholar]
- (38).Sharma N; Sonavane U; Joshi R Differentiating the Pre-hydrolysis States of Wild-type and A59G Mutant Hras: An Insight through MD Simulations. Comput. Biol. Chem. 2017, 69, 96–109. [DOI] [PubMed] [Google Scholar]
- (39).Lu S; Jang H; Nussinov R; Zhang J The Structural Basis of Oncogenic Mutations G12, G13 and Q61 in Small GTPase K-Ras4B. Sci. Rep. 2016, 6, 21949. [DOI] [PMC free article] [PubMed] [Google Scholar]
- (40).Sayyed-Ahmad A; Prakahs P; Gorfe AA Distinct Dynamics and Interaction Patterns in H-and K-Ras Oncogenic P-loop Mutants. Proteins 2017, 85, 1618–1632. [DOI] [PMC free article] [PubMed] [Google Scholar]
- (41).Sugita Y; Okamoto Y Replica-Exchange Molecular Dynamics Method for Protein Folding. Chem. Phys. Lett. 1999, 314, 141–151. [Google Scholar]
- (42).Van der Spoel D; Lindahl E; Hess B; Groenhof G; Mark AE; Berendsen HJC GROMACS: Fast, Flexible and Free. J. Comput. Chem. 2005, 26, 1701–1718. [DOI] [PubMed] [Google Scholar]
- (43).Hess B; Kutzner C; van der Spoel D; Lindahl E GROMACS 4: Algorithms for Highly Efficient, Load-Balanced, and Scalable Molecular Simulation. J. Chem. Theory Comput. 2008, 4, 435–447. [DOI] [PubMed] [Google Scholar]
- (44).Hornak V; Abel R; Okur A; Strockbine B; Roitberg A; Simmerling C Comparison of Multiple Amber Force Fields and Development of Improved Protein Backbone Parameters. Proteins, 2006, 65, 712–725. [DOI] [PMC free article] [PubMed] [Google Scholar]
- (45).Rudack T; Xia F; Schlitter J; Kӧtting C; Gerwert K The Role of Magnesium for Geometry and Charge in GTP Hydrolysis, Revealed by Quantum Mechanics/Molecular Mechanics Simulations. Biophys. J. 2012, 103, 293–302. [DOI] [PMC free article] [PubMed] [Google Scholar]
- (46).Fetics SK; Guterres H; Kearney BM; Buhrman G; Ma B; Nussinov R; Mattos C Allosteric Modulation of Ras-GTP is Linked to Signal Transduction through RAF Kinase. Structure 2015, 23, 505–516.25684575 [Google Scholar]
- (47).Boriack-Sjodin PA; Margarit SM; Bar-Sagi D; Kuriyan J The Structural Basis of the Activation of Ras by Sos. Nature 1998, 394, 337–343. [DOI] [PubMed] [Google Scholar]
- (48).Schweins T; Geyer M; Kalbitzer HR; Wittinghofer A; Warshel A Linear Free Energy Relationships in the Intrinsic and GTPase Activating Protein-Stimulated Guanosine 5’-Triphosphate Hydrolysis of p21ras. Biochemistry 1996, 35, 14225–14231. [DOI] [PubMed] [Google Scholar]
- (49).Glenno TM; Villà J; Warshel A How Does GAP Catalyze the GTPase Reaction of Ras? A Computer Simulation Study. Biochemistry 2000, 39, 9641–9651. [DOI] [PubMed] [Google Scholar]
- (50).Klähn M; Rosta E; Warshel A On the Mechanism of Hydrolysis of Phosphate Monoesters Dianions in Solutions and Proteins. J. Am. Chem. Soc. 2006, 128, 15310–15323. [DOI] [PubMed] [Google Scholar]
- (51).Xia F; Rudack T; Cui Q; Kӧtting C; Gerwert K Detailed Structure of the H2PO4¯-Guanosine Diphosphate Intermediate in Ras-GAP Decoded from FTIR Experiments by Biomolecular Simulations. J. Am. Chem. Soc. 2012, 134, 20041–20044. [DOI] [PubMed] [Google Scholar]
- (52).Wallin G; Kamerlin SCL; Åqvist J Energetics of Activation of GTP Hydrolysis on the Ribosome. Nat. Commun. 2013, 4, 1733. [DOI] [PubMed] [Google Scholar]
- (53).Prasad B R; Plotnikov NV; Lameira J; Warshel A Quantitative Exploration of the Molecular Origin of the Activation of GTPase. Proc. Natl. Acad. Sci. U.S.A. 2013, 110, 20509–20514. [DOI] [PMC free article] [PubMed] [Google Scholar]
- (54).Åqvist J; Kamerlin SCL Conserved Motifs in Different Classes of GTPases Dictate their Specific Modes of Catalysis. ACS Catal. 2016, 6, 1737–1743. [Google Scholar]
Associated Data
This section collects any data citations, data availability statements, or supplementary materials included in this article.


