Abstract
Airway ciliary beat activity (CBA) plays a pivotal role in protecting the body by removing mucus and pathogens from the respiratory tract. Since CBA is complicated and cannot be characterized by merely frequency, we recorded CBA using laser confocal line scanning and defined six parameters for describing CBA. The values of these parameters were all above 0 when measured in beating ciliated cells from mouse tracheae. We subsequently used 10 μM adenosine-5′-triphosphate (ATP) to stimulate ciliated cells and simultaneously recorded intracellular Ca2+ levels and CBA. We found that intracellular Ca2+ levels first increased, followed by an increase in CBA. Among the six parameters, frequency, amplitude, and integrated area significantly increased, whereas rise time, decay time, and full duration at half maximum markedly decreased. The results suggest that these six parameters are appropriate for assessing CBA and that increased intracellular Ca2+ levels might enhance CBA. We next used our established methods to observe changes in mechanically stimulated cilia tips. We found that mechanical stimulation-induced changes in both intracellular Ca2+ levels and CBA were not only similar to those induced by ATP, but were also blocked by treatment with a Ca2+ chelator, BAPTA-AM, (10 μM) for 10 min. Moreover, while the same blockage was observed under Ca2+-free conditions, addition of 2 mM Ca2+ into the chamber restored increases in both intracellular Ca2+ levels and CBA. Taken together, we have provided a novel method for real-time measurement and complete analysis of CBA as well as demonstrated that mechanical stimulation of cilia tips resulted in Ca2+ influx that led to increased intracellular Ca2+ levels, which in turn triggered CBA enhancement.
Keywords: Ciliated cells, Ciliary beat activity, Intracellular Ca2+, Mechanical stimulation
Introduction
Cilia protruding from the ciliated cells line the inner surface of hollow organs play a vital role in defending the body against infection by assisting the removal of pathogens and mucus from the respiratory tract. This defense function of cilia is dependent on ciliary beat activity (CBA).
CBA was first described in 1869 [12]; approximately 100 years later, a study in 1955 by Dalhamn measured the ciliary beat frequency (CBF) of rat tracheal ciliated cells by using a film camera [1, 2]. Since 1980, researchers have started to investigate the effects of intracellular Ca2+ on CBF and have reported that increases in intracellular Ca2+ levels lead to CBF upregulation [6, 18]. This finding has also been confirmed by many other studies [5, 7, 9, 11, 13, 15–17, 20]; however, some controversial results have been obtained [10], and relatively complicated techniques and methods were previously used to measure CBF [3]. Indeed, CBA motion is very complicated and is therefore very difficult to measure and analyze. The study by Doyle et al. was the first to record CBA by using confocal line scanning [3]; however, neither have new methods been established for analyzing CBA nor have dual recordings of CAB and Ca2+ been obtained using confocal line scanning.
In this study, we recorded CBA using confocal line scanning and developed a novel method to calculate CBF. Five additional parameters (i.e., amplitude, rise time, decay time, duration, and integrated area) were also utilized for complete CBA characterization. We found that the use of these new methods together was appropriate for CBA measurement. Moreover, we applied this technique to investigate mechanical stimulation-induced CBA enhancement and found that such physical stimulation resulted in increases in intracellular Ca2+ levels due to Ca2+ influx, which subsequently induced increases in CBA.
Materials and methods
Isolation of ciliated cells
Adult male Balb/C mice were killed by means of intraperitoneal injections of sodium pentobarbital, and the tracheae were obtained according to the protocol approved by the Institutional Animal Care and Use Committee of the South-Central University for Nationalities. The tracheae were transferred into a dish that contained physiological salt solution (PSS; 135 mM NaCl, 5 mM KCl, 1 mM MgCl2, 2 mM CaCl2, 10 mM glucose, and 10 mM HEPES, with pH 7.4 adjusted using NaOH) and was kept at room temperature. The connective tissues were removed completely, and ten incisions were made on the tracheal wall with scissors. The tracheae were then incubated at 37 °C for 30 min in PSS containing 2 mg/ml papain, 1 mg/ml dithioerythritol, and 1 mg/ml bovine serum albumin (BSA). After three washes with PSS, the epithelial cells (including the ciliated cells) were removed from the digested tracheae using Pasteur pipettes and stored at room temperature in PSS solution containing 1 mg/ml BSA. Experiments were conducted within 2 h of cell collection.
Measurement and analysis of CBA
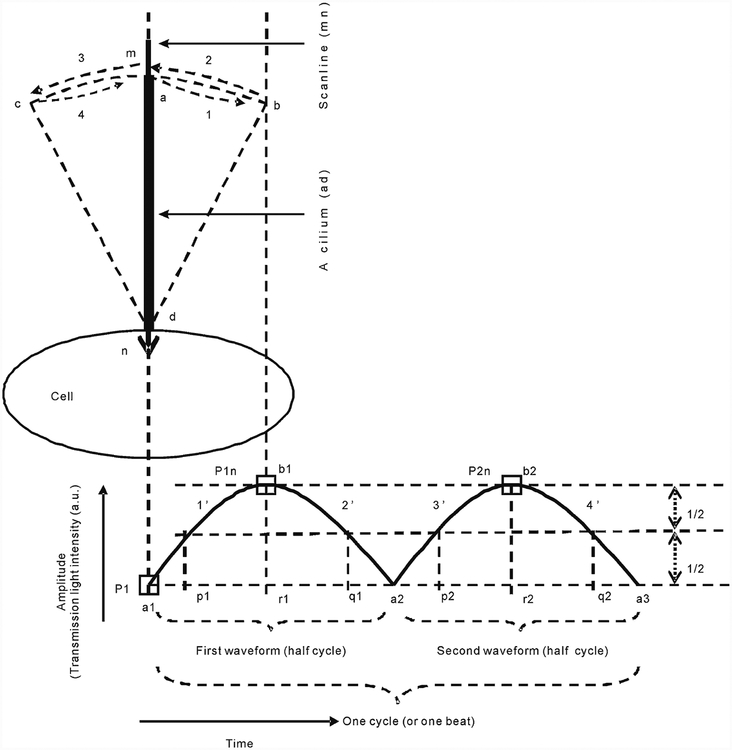
A ciliated cell was selected, and a scan line was drawn parallel to the long axis of the cilia (Fig. 1). Visualization was achieved using 488-nm laser transmission light with a 40×/1.30 oil objective lens. The laser light scanned the line repeatedly at a speed of 1.89 ms/line (equivalent to a sampling rate of 529.1 Hz). Changes in light intensity caused by beating of the cilia within the scan line were sensed, converted into electrical signals by a photomultiplier (PMT), and then recorded using the LSM 700 Laser Confocal Microscopy System (Carl Zeiss, Berlin, Germany). The recorded line scan images were used to measure CBA (Fig. 1), which was subsequently analyzed by the Zen 2010 software (Carl Zeiss, Berlin, Germany) and Interactive Data Language software (Research Systems, USA). The intensity trace was obtained by dividing the intensity value (I) in the cilia area by the rest intensity value (I0) in the area without cilia. The net amplitude for each waveform was calculated by subtracting the onset value from the peak value. All such individual (ΔI/I0) values were then averaged to acquire the mean amplitude. To obtain the integrated area value, all net areas under the intensity trace from a line scan image were automatically integrated using the Origin 8.0 software.
Fig. 1.
Schematic presentation of CBA measurement. The initial position of a cilium (ad) overlaps with the scan line (mn), and the cilium ad starts movement at mn and continues through bd, mn, cd, and finally, mn (i.e., a complete cycle or beat). At the initial mn position, a 488-nm laser transmission light is completely blocked by the cilium ad; therefore, the intensity (i.e., amplitude) of transmission light, which is measured by a PMT, is at its lowest level (P1). After the cilium ad moves away from the scan line mn and reaches the far-right position bd, the intensity is at the maximal value of P1n. In this case, completion of courses 1 and 2 generates the phases 1′ and 2′ of the first waveform, respectively. Similarly, accomplishment of courses 3 and 4 generates the second waveform. Therefore, beat frequency is equal to the number of waveforms÷2÷total scanning time (seconds), which is expressed as beats/second (i.e., hertz). The rise time represents the time required for a cilium to move from the scan line to the farthest positions (from a1 to r1 and from a2 to r2), and decay time represents the time taken by the same cilium to return to the scan line from the farthest positions (from r1 to a2 and from r2 to a3). Thus, decreases in these values indicate that the cilia are beating faster, and vice versa; there-fore, these values reflect CBA. Full duration at half maximum (FDHM) reflects the time required for a cilium to complete half of a cycle (i.e., the beating duration from p1 to q1 and from p2 to q2), and b1r1 and b2r2 represent the amplitude (arbitrary unit, a.u.). The integrated area under the waveforms was also calculated and used to reflect CBA status since the pattern of each waveform is determined by CBA
Reagents
Adenosine-5′-triphosphate (ATP), ionomycin, papain, dithioerythritol, and 1,2-bis(2-amino-5-methylphenoxy)-ethane-N,N,N′,N′-tetraacetic acid tetrakis (acetoxymethyl) ester (BAPTA-AM) were purchased from Sigma (St. Louis, MO, USA). Fluo-4 AM was purchased from Invitrogen (Camarillo, CA, USA). Each of these reagents was dissolved in H2O or DMSO in accordance with the manufacturer’s instructions. ATP and ionomycin were added to the cells with glass micropipettes (tip opening, ~2 μm) under a pressure of ~10 cm H2O.
Simultaneous measurement of CBA and intracellular Ca2+
To simultaneously measure CBA and intracellular Ca2+ levels, the cells were loaded with fluo-4 AM (2 μM) for 15 min at room temperature. The scan line encompassed the cilia and the cell body, thereby enabling two line scan images to be recorded simultaneously: one from the transmission light (for measuring CBA) and the other from fluo-4 AM fluorescence (for intracellular Ca2+ levels). To calculate intracellular Ca2+ levels, fluorescence (F) was divided by the rest fluorescence (F0; the rest level before addition of agonists or stimulation). Similarly, ΔF/F0 values obtained as described above for I/I0 were used to express intracellular Ca2+ levels.
Statistical analysis
The results have been provided as mean±standard error of the mean values. Comparisons between groups were performed using a Student’s t test or one-way ANOVA, and P values of less than 0.05 were considered significant.
Results
Confocal line scan measurement and CBA calculation
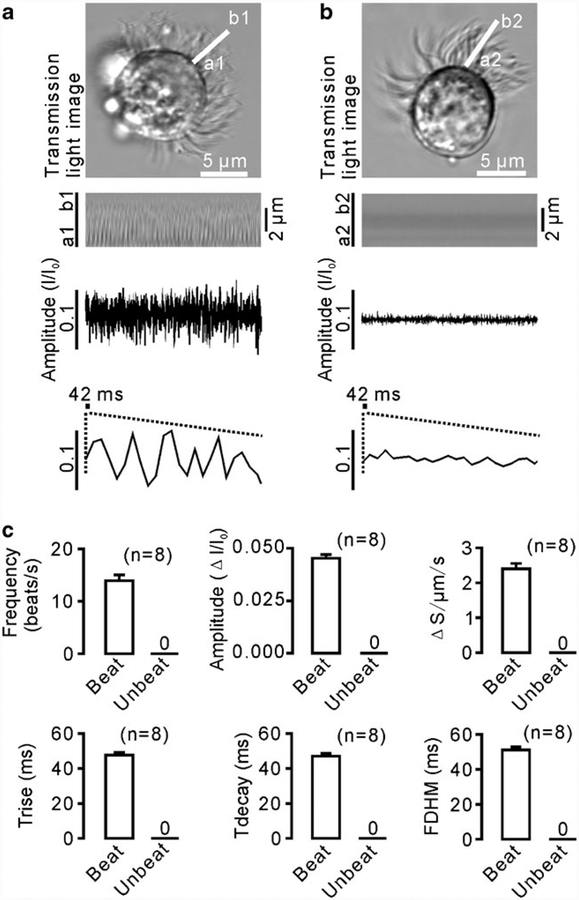
The CBA of the ciliated cells isolated from the mouse tracheae was measured and analyzed as described in “Materials and methods” (Fig. 1). A representative image of the beating cilia and a line scan image are shown in Fig. 2a. Oscillations observed on the time-intensity trace from the line scan images were composed of individual waveforms, as described in Fig. 1. We used these waveforms to calculate the following six parameters: mean frequency, amplitude, rise time (Trise), decay time (Tdecay), full duration at half maximum (FDHM), and integrated area. The values of these parameters were found to be 13.955±1.073 beats/s (or Hz), 0.045±0.002 ΔI/I0, 47.637±1.659 ms, 47.110±1.531 ms, 51.103±1.882 ms, and 2.400±0.158 a.u., respectively (n=8); whereas all these values were 0 for non-beating cilia (n=8) (Fig. 2b, c). These results suggest that the six new parameters are suitable for measuring CBA.
Fig. 2.
CBA recording and analysis. a An xy-image and a line scan image of a beating ciliated cell. The scan line a1b1 was drawn parallel to the long axis of the cilia, and a time-intensity trace was generated from the line scan image. Each individual waveform was clearly visible, and therefore, the waveforms were visually counted to calculate the frequency. Notably, the patterns of individual waveforms were often not identical, indicating that a cilia beat is very complicated. b When the cilia were quiescent, no waveforms were observed. c The values of the six parameters were equal to 0
ATP induced increases in intracellular Ca2+ levels and CBA
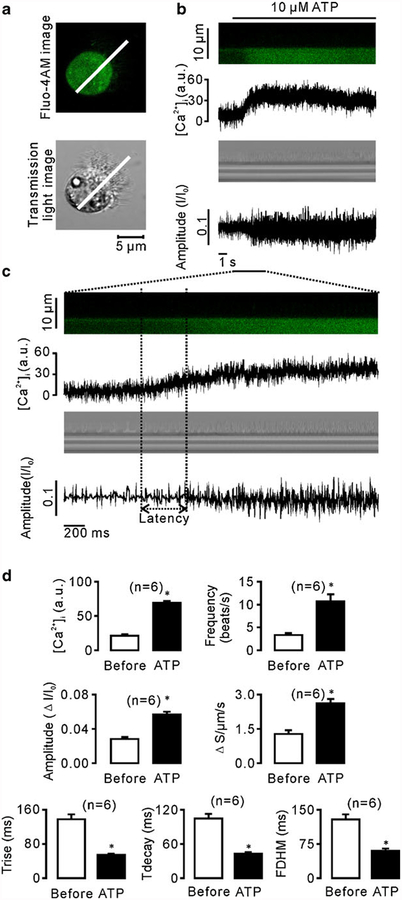
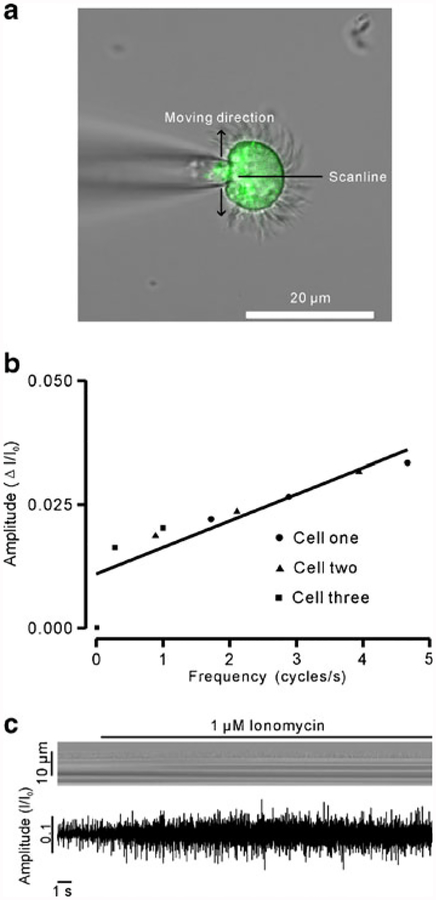
We next tested whether these six parameters reflect CBA changes. Since a previous study has reported that ATP increases CBF [21], we used ATP to induce CBA enhancement and then determined changes in the parameters. The ciliated cells were loaded with 2 μM fluo-4 AM (Fig. 3a), and intracellular Ca2+ levels and CBA were recorded simultaneously. We found that 10 μM ATP induced increases in intracellular Ca2+ levels as well as a delayed the change in CBA (Fig. 3b, c). The mean latency was 400±100 ms (n=6; Fig. 3c). We also analyzed the amplitude of fluo-4 AM (which represents intracellular Ca2+ concentration) and the CBA parameters. As shown in Fig. 3d, both intracellular Ca2+ concentration and CBF increased significantly. Moreover, the frequency increased due to a shorter duration of cycle completion. Rise time, decay time, and FDHM all decreased consistently. In contrast, the integrated area and amplitude increased significantly. While it is easy to explain the increased integrated area, it is difficult to interpret the increase in amplitude. To understand this, we patched the ciliated cells (non-beating cells) using a cell-attached configuration model, and the cilia were then manually moved back and forth across the scan line using a micromanipulator (MP-225; Sutter Instrument, CA, USA) to mimic ciliary beating movements (Fig. 4a). We found a linear relationship between frequency and amplitude (Fig. 4b). To further confirm this relationship between the two, we used the ionophore ionomycin to stimulate cells, and the frequency and amplitude were then measured (n=7). As shown in Fig. 4c, the amplitude increased following increases in frequency. These data indicate that the amplitude is positively correlated with the changes in CBA and is therefore a suitable parameter for CBA measurement. Taken together, we demonstrate for the first time that frequency, amplitude, rise time, decay time, FDHM, and integrated area can be used to assess CBA.
Fig. 3.
ATP induced increases in CBA and intracellular Ca2+. a A fluorescence image (top) and a transmission light image (bottom) of a fluo-4 AM-loaded ciliated cell. As indicated, the scan line covered the cilia and cell body. b Intracellular Ca2+ concentration (top) and CBA (bottom) were recorded simultaneously. c Increases in intracellular Ca2+ levels prior to CBA changes, as indicated by latency. d Summary of intracellular Ca2+ levels and six parameter values of CBA before and 9 s after ATP application. All the parameters changed significantly (n=6; asterisks indicate P<0.05)
Fig. 4.
An increase in CBF resulted in an increase in amplitude. a The patched ciliated cells were manually moved back and forth through the scan line to mimic beating. As the frequency increased from low to high, the corresponding amplitudes were measured. b A plot constructed with frequencies and amplitudes indicates a linear relationship between the two. c Ionomycin (1 μm) caused faster beating and increased amplitude. The data are representative of six independent recordings
Mechanical stimulation increased intracellular Ca2+ levels and CBA
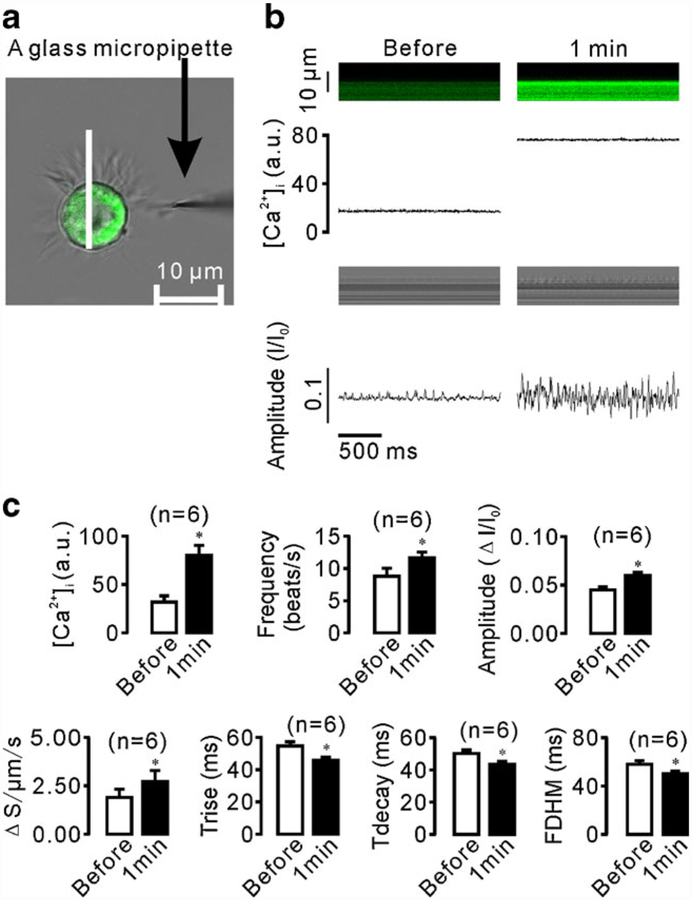
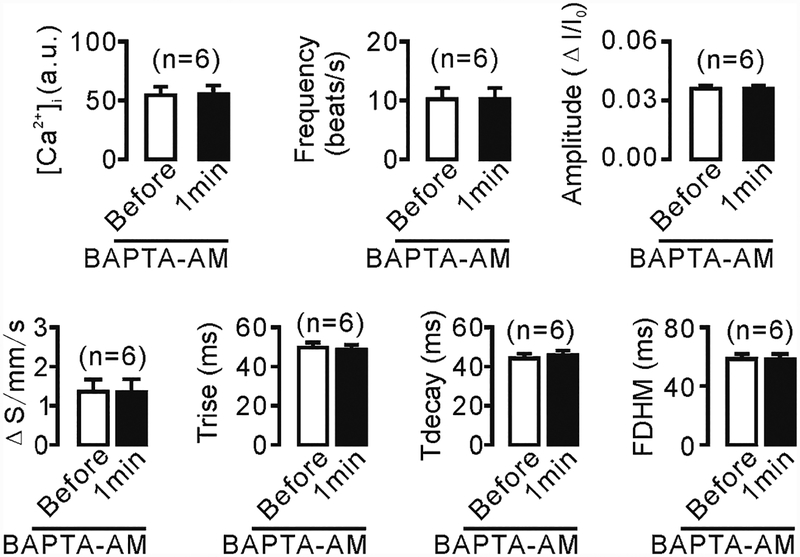
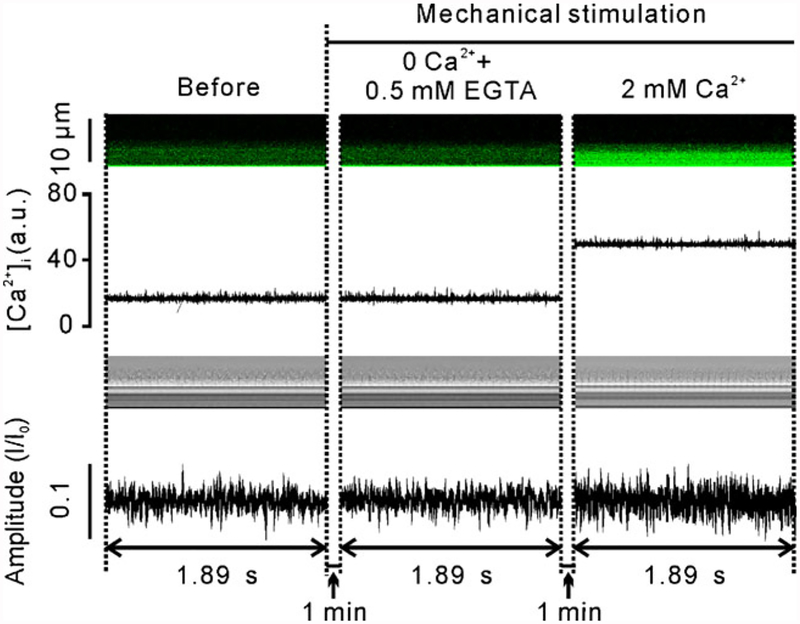
We next used the established methods to investigate mechanical stimulation-induced CBA changes and the underlying mechanisms. As shown in Fig. 5, a glass micropipette tip was used to stimulate a small group of ciliary apexes, and intracellular Ca2+ levels and CBA were again measured simultaneously using confocal line scanning. We found that mechanical stimulation for 1 min not only increased the intracellular Ca2+ concentration, but also enhanced CBA (Fig. 5b, c), both of which, however, were inhibited by treatment with either 10 μM BAPTA-AM for 10 min (Fig. 6) or Ca2+-free solution (0 Ca2++0.5 mM EGTA; Fig. 7). Interestingly, addition of 2 mM Ca2+ into the chamber restored both increases (Fig. 7). These results suggest that mechanical stimulation causes Ca2+ influx, which in turn enhances CBA.
Fig. 5.
Mechanical stimulation-induced increases in intracellular Ca2+ levels and CBA. a A glass micropipette tip was used to stimulate a small group of cilia tips. The stimulation site was located away from the scan line. b Dual line scans were recorded before and 1 min after stimulation. c Statistical analysis of the results from six independent experiments
Fig. 6.
Increases in intracellular Ca2+ levels mediate mechanical stimulation-induced CBA enhancement. The ciliated cells were treated with 10 μm BAPTA-AM for 10 min to block increases in intracellular Ca2+ levels before the cilia were mechanically stimulated. After 1 min, line scanning was performed, and both CBA and intracellular Ca2+ levels were measured
Fig. 7.
CBA enhancement induced by mechanical stimulation via Ca2+ influx. Under Ca2+-free conditions (0 Ca2++0.5 EGTA), neither intracellular Ca2+ levels nor CBA increased upon same mechanical stimulation for 1 min, which, however, was restored by addition of Ca2+ (2 mM) into the chamber. These recordings are representative of seven independent experiments
In this study, we found that if laser line scanning was carried out for more than 30 consecutive seconds, fluo-4 AM fluorescence started quenching quickly and CBA decreased rapidly. This phenomenon cannot be prevented by minimizing the laser intensity. In contrast, if we performed line scan for 1.89 ms every 1 min, not only was this phenomenon avoided, but we could also record CBA and Ca2+ for as long as possible to finish the experiments.
Discussion
In this study, we recorded CBA using confocal line scanning and established six parameters to analyze line scan images as well as characterize and quantify CBA. These six parameters, including frequency (the one established previously), allowed us to analyze CBA and could therefore be useful for future studies on the generation, regulation, and physiological and pathological functions of CBA. We also found that these methods were suitable and accurate approaches for investigating the effect of intracellular Ca2+ levels on CBA by using dual recordings. Moreover, we demonstrated that mechanical stimulation of the cilia tips induced increases in intracellular Ca2+ levels via Ca2+ influx through the plasma membrane, which then resulted in CBA enhancement.
Our data show that following the significant increases in frequency, amplitude, and integrated area, the rise time, decay time, and FDHM markedly decreased. Therefore, all six parameters together or each alone can be used as an index(es) to measure CBA. Rise time and decay time represent the time required for a cilium to move from the scan line to the farthest positions and the time for the same cilium to return to the scan line from the farthest positions, respectively. Therefore, the values of these two parameters can allow us to determine whether the back and forth courses that a cilium moves through are symmetrical. In this study, the rise time and decay time were identical (47.637±1.659 and 47.110±1.531 ms, respectively; P>0.05; Fig. 2). Moreover, FDHM, the duration required by a beating cilium to finish one half cycle (or one waveform), allows us to investigate whether the duration has changed or does not follow stimuli. It might be possible that the FDHM values are not affected when rise time and decay time change in the opposite manner, for example, when one value increases and the other decreases. In fact, the back and forth courses of beating might not be identical in vivo when the cilia receive stimuli. Furthermore, the integrated area was obviously determined by frequency, amplitude, rise time, and decay time, therefore, which is a good composite indicator that reflects the CBA.
The mean CBF in this study was found to be 14 Hz, which is higher than the 10.7±0.4 Hz measured in the mouse tracheal ciliated cells by using high-speed digital video microscopy [9]. This might be due to, first, our high sampling rate (529.1 Hz) which prevented any cilia beat movement from being missed. Second, the visual counting method also enabled us to count all the waveforms that were caused by the beating cilia. Based on our own experience, we propose that this visual counting method is simple and reliable for confocal line scan recording, compared to the fast Fourier transform method [3]. Third, freshly isolated cells were used in our experiments. During the culturing period, changes may occur in the ciliated cells, subsequently affecting the CBF. Indeed, Sanderson and Dirksen found that cultured mammalian ciliated cells have no mechanosensitivity during the first 5 d of culture [16]. Fourth, it is also likely that CBA, recorded using confocal line scanning, probably included more than one cilium beat. Based on our settings described in Fig. 1, a scan line was actually a 3-D rectangular-shaped space, determined by length (= length of scan lines drawn on individual cells), width (=1 pixel; 20–30 nm based on all experiments in this study), and thickness (=900 nm; i.e., height). The mean diameter of cilia in the mouse tracheal ciliated cells used in this study was approximately 360 nm. Considering the values of these parameters, there might be more than one cilium across a scan line. If this is the case, we cannot define the relationship between the waveforms and the beating of their corresponding cilia. This will also result in high values of frequency and in turn lead to a highly integrated area. However, this would not affect the comparisons of frequency before and after some treatments because the same number of cilia was measured in each experiment. In contrast to these two parameters, the others will not be altered because their values are derived from more similar waveforms. Nevertheless, when we use these methods to compare frequencies and integrated areas between different cell types (especially if they are from different species), we should be careful to obtain measurements with a sufficiently large sample size.
During the beating of the cilia, the values of the six parameters were not 0 (Fig. 2), indicating that they reflect CBA. Our ATP-based experiments (Fig. 3) further demonstrate that these parameters can be reliably used to characterize CBA. Because ATP has been known to increase CBF, we used ATP to enhance beating activity and then observed the changes in parameters. Our results show that ATP increased frequency, amplitude, and integrated area but significantly decreased rise time, decay time, and FDHM. Moreover, the experiments described in Fig. 4 further show that amplitude is increased when the cilia were beating faster. These data indicate that the changes in parameters are strongly associated with CBA alteration, and therefore, these six parameters can be used either together or alone to measure CBA.
Consistent with a previous study [4], we found that increases in intracellular Ca2+ levels enhanced CBA. However, the mechanism underlying Ca2+-triggered CBA increase is still unclear, although this process is known to require approximately 400 ms (Fig. 3c). Interestingly, axoneme, which is composed of a specific “9+2” arrangement of microtubules, has been shown to be important for ciliary beating [14, 19]. Therefore, future studies should focus on whether and how Ca2+ directly or indirectly acts on the axoneme to enhance CBA.
We next studied the alteration in and the dynamics of mechanical stimulation-induced CBA. The main function of the cilia is to remove mucus and pathogens from the respiratory tract, which is a very important defense mechanism of the body. Here, we used glass micropipettes to mimic stimulation by mucus and pathogens on a small group of cilia tips, and CBA and intracellular Ca2+ changes were subsequently examined. We noted that a small group of cilia can transmit mechanical stimulation signals to the cells and cause increases in intracellular Ca2+ levels, which in turn leads to CBA enhancement (Fig. 5). In addition, BAPTA-AM, which forms a chelate complex with Ca2+ ions, was found to prevent increases in intracellular Ca2+ levels, thereby inhibiting mechanical stimulation-induced CBA enhancement (Fig. 6). These observations suggest that increases in intracellular Ca2+ levels induce CBA enhancement. We further demonstrate that the mechanical stimulation-induced Ca2+ increases were due to Ca2+ influx through the plasma membrane (Fig. 7).
The mechanical stimulation of the ciliated cell membrane is reported to induced increase in intracellular Ca2+ levels and CBF [8]. Here, we showed that such physical stimulation of a small group of cilia tips also induced these increases. This finding suggests that a small group of cilia are sufficient to sense physical and mechanical stimulations on their tips and subsequently result in Ca2+ influx leading to global Ca2+ increases and then CBA enhancement. This mechanism might be utilized by cilia in vivo to expel mucus, dust, and microorganisms from the respiratory tract.
In conclusion, we recorded CBA either alone or simultaneously with intracellular Ca2+ levels by using a confocal line scanning method. Waveforms were then used to measure the frequency, amplitude, rise time, decay time, FDHM, and integrated area. Our experiments suggest that these parameters can be used for measuring CBA (besides using CBF). By using this method, we studied the effect of mechanical stimulation on CBA and found that mechanical stimulation-induced CBA enhancement was mediated by increases in intracellular Ca2+ levels via Ca2+ influx. Overall, our results might be useful for investigators who intend to develop new drugs that rapidly remove excessive mucus and particles from the respiratory tract by enhancing CBA.
Acknowledgments
This work was supported by the 973 Research Program (2011CB809100) and the National Natural Science Foundation of China (31140087 and 30971514 to Q-HL).
Footnotes
Conflict of interest The authors declare no conflicts of interest.
Contributor Information
Wen-Er Li, Institute for Medical Biology, College of Life Sciences, South-Central University for Nationalities, 708 Min Zu Da Dao, Wuhan 430074, Hubei, China.
Weiwei Chen, Institute for Medical Biology, College of Life Sciences, South-Central University for Nationalities, 708 Min Zu Da Dao, Wuhan 430074, Hubei, China.
Yun-Fei Ma, Institute for Medical Biology, College of Life Sciences, South-Central University for Nationalities, 708 Min Zu Da Dao, Wuhan 430074, Hubei, China.
Qing-Rong Tuo, Institute for Medical Biology, College of Life Sciences, South-Central University for Nationalities, 708 Min Zu Da Dao, Wuhan 430074, Hubei, China.
Xiao-Jing Luo, Institute for Medical Biology, College of Life Sciences, South-Central University for Nationalities, 708 Min Zu Da Dao, Wuhan 430074, Hubei, China.
Ting Zhang, Institute for Medical Biology, College of Life Sciences, South-Central University for Nationalities, 708 Min Zu Da Dao, Wuhan 430074, Hubei, China.
Wen-Bo Sai, Institute for Medical Biology, College of Life Sciences, South-Central University for Nationalities, 708 Min Zu Da Dao, Wuhan 430074, Hubei, China.
Jing Liu, Institute for Medical Biology, College of Life Sciences, South-Central University for Nationalities, 708 Min Zu Da Dao, Wuhan 430074, Hubei, China.
Jinhua Shen, Institute for Medical Biology, College of Life Sciences, South-Central University for Nationalities, 708 Min Zu Da Dao, Wuhan 430074, Hubei, China.
Zhi-Gang Liu, School of Medicine, Shenzhen University, Shenzhen 518060, China.
Yun-Min Zheng, Center for Cardiovascular Sciences, Albany Medical College, Albany, NY 12208, USA.
Yong-Xiao Wang, Center for Cardiovascular Sciences, Albany Medical College, Albany, NY 12208, USA.
Guangju Ji, National Laboratory of Biomacromolecules, Institute of Biophysics, Chinese Academy of Sciences, Beijing 100101, China.
Qing-Hua Liu, Institute for Medical Biology, College of Life Sciences, South-Central University for Nationalities, 708 Min Zu Da Dao, Wuhan 430074, Hubei, China.
References
- 1.Dalhamn T (1955) A method for determination in vivo of the rate of ciliary beat and mucous flow in the trachea. Acta Physiol Scand 33:1–5 [DOI] [PubMed] [Google Scholar]
- 2.Dalhamn T (1960) The determination in vivo of the rate of ciliary beat in the trachea. Acta Physiol Scand 49:242–250 [DOI] [PubMed] [Google Scholar]
- 3.Doyle RT, Moninger T, Debavalya N, Hsu WH (2006) Use of confocal linescan to document ciliary beat frequency. J Microsc 223:159–164 [DOI] [PubMed] [Google Scholar]
- 4.Evans JH, Sanderson MJ (1999) Intracellular calcium oscillations regulate ciliary beat frequency of airway epithelial cells. Cell Calcium 26:103–110 [DOI] [PubMed] [Google Scholar]
- 5.Geary CA, Davis CW, Paradiso AM, Boucher RC (1995) Role of CNP in human airways: cGMP-mediated stimulation of ciliary beat frequency. Am J Physiol 268:L1021–L1028 [DOI] [PubMed] [Google Scholar]
- 6.Kakuta Y, Kanno T, Sasaki H, Takishima T (1985) Effect of Ca2+ on the ciliary beat frequency of skinned dog tracheal epithelium. Respir Physiol 60:9–19 [DOI] [PubMed] [Google Scholar]
- 7.Korngreen A, Priel Z (1996) Purinergic stimulation of rabbit ciliated airway epithelia: control by multiple calcium sources. J Physiol 497(Pt 1):53–66 [DOI] [PMC free article] [PubMed] [Google Scholar]
- 8.Lansley AB, Sanderson MJ (1999) Regulation of airway ciliary activity by Ca2+: simultaneous measurement of beat frequency and intracellular Ca2+. Biophys J 77:629–638 [DOI] [PMC free article] [PubMed] [Google Scholar]
- 9.Lorenzo IM, Liedtke W, Sanderson MJ, Valverde MA (2008) TRPV4 channel participates in receptor-operated calcium entry and ciliary beat frequency regulation in mouse airway epithelial cells. Proc Natl Acad Sci USA 105:12611–12616 [DOI] [PMC free article] [PubMed] [Google Scholar]
- 10.Ma W, Silberberg SD, Priel Z (2002) Distinct axonemal processes underlie spontaneous and stimulated airway ciliary activity. J Gen Physiol 120:875–885 [DOI] [PMC free article] [PubMed] [Google Scholar]
- 11.Ma W, Korngreen A, Uzlaner N, Priel Z, Silberberg SD (1999) Extracellular sodium regulates airway ciliary motility by inhibiting a P2X receptor. Nature 400:894–897 [DOI] [PubMed] [Google Scholar]
- 12.Moore WD, Engelmann TW (1869) On ciliary motion. J Anat Physiol 3:420–435 [PMC free article] [PubMed] [Google Scholar]
- 13.Nlend MC, Bookman RJ, Conner GE, Salathe M (2002) Regulator of G-protein signaling protein 2 modulates purinergic calcium and ciliary beat frequency responses in airway epithelia. Am J Respir Cell Mol Biol 27:436–445 [DOI] [PubMed] [Google Scholar]
- 14.Porter ME, Sale WS (2000) The 9 + 2 axoneme anchors multiple inner arm dyneins and a network of kinases and phosphatases that control motility. J Cell Biol 151:F37–F42 [DOI] [PMC free article] [PubMed] [Google Scholar]
- 15.Salathe M, Bookman RJ (1999) Mode of Ca2+ action on ciliary beat frequency in single ovine airway epithelial cells. J Physiol 520 (Pt 3):851–865 [DOI] [PMC free article] [PubMed] [Google Scholar]
- 16.Sanderson MJ, Dirksen ER (1986) Mechanosensitivity of cultured ciliated cells from the mammalian respiratory tract: implications for the regulation of mucociliary transport. Proc Natl Acad Sci USA 83:7302–7306 [DOI] [PMC free article] [PubMed] [Google Scholar]
- 17.Sanderson MJ, Lansley AB, Dirksen ER (1992) Regulation of ciliary beat frequency in respiratory tract cells. Chest 101:69S–71S [DOI] [PubMed] [Google Scholar]
- 18.Verdugo P (1980) Ca2+-dependent hormonal stimulation of ciliary activity. Nature 283:764–765 [DOI] [PubMed] [Google Scholar]
- 19.Wirschell M, Yamamoto R, Alford L, Gokhale A, Gaillard A et al. (2011) Regulation of ciliary motility: conserved protein kinases and phosphatases are targeted and anchored in the ciliary axoneme. Arch Biochem Biophys 510:93–100 [DOI] [PMC free article] [PubMed] [Google Scholar]
- 20.Zhang L, Sanderson MJ (2003) Oscillations in ciliary beat fre-quency and intracellular calcium concentration in rabbit tracheal epithelial cells induced by ATP. J Physiol 546:733–749 [DOI] [PMC free article] [PubMed] [Google Scholar]
- 21.Zhang L, Sanderson MJ (2003) The role of cGMP in the regulation of rabbit airway ciliary beat frequency. J Physiol 551:765–776 [DOI] [PMC free article] [PubMed] [Google Scholar]


