

Abstract
Purpose
The use of radiomic features as biomarkers of treatment response and outcome or as correlates to genomic variations requires that the computed features are robust and reproducible. Segmentation, a crucial step in radiomic analysis, is a major source of variability in the computed radiomic features. Therefore, we studied the impact of tumor segmentation variability on the robustness of MRI radiomic features.
Method
Fluid‐attenuated inversion recovery (FLAIR) and contrast‐enhanced T1‐weighted (T1WICE) MRI of 90 patients diagnosed with glioblastoma were segmented using a semiautomatic algorithm and an interactive segmentation with two different raters. We analyzed the robustness of 108 radiomic features from five categories (intensity histogram, gray‐level co‐occurrence matrix, gray‐level size‐zone matrix (GLSZM), edge maps, and shape) using intra‐class correlation coefficient (ICC) and Bland and Altman analysis.
Results
Our results show that both segmentation methods are reliable with ICC ≥ 0.96 and standard deviation (SD) of mean differences between the two raters (SDdiffs) ≤ 30%. Features computed from the histogram and co‐occurrence matrices were found to be the most robust (ICC ≥ 0.8 and SDdiffs ≤ 30% for most features in these groups). Features from GLSZM were shown to have mixed robustness. Edge, shape, and GLSZM features were the most impacted by the choice of segmentation method with the interactive method resulting in more robust features than the semiautomatic method. Finally, features computed from T1WICE and FLAIR images were found to have similar robustness when computed with the interactive segmentation method.
Conclusion
Semiautomatic and interactive segmentation methods using two raters are both reliable. The interactive method produced more robust features than the semiautomatic method. We also found that the robustness of radiomic features varied by categories. Therefore, this study could help motivate segmentation methods and feature selection in MRI radiomic studies.
Keywords: glioblastoma, MRI, radiomics, robustness, segmentation
1. Introduction
Radiomic analysis consists of the high‐throughput mining of quantitative features from standard‐of‐care medical imaging1 and is becoming a powerful tool for treatment planning, outcome prediction, and personalized therapy.2, 3, 4 Radiomic models are often built using features obtained from baseline or follow‐up computed tomography (CT) or positron emission tomography (PET) images.1, 4, 5, 6 Recently, there has been an increased interest in performing radiomic studies using MR images.7, 8, 9, 10, 11, 12, 13 Using radiomics with MRI is favorable for some tumor types, such as brain tumors, for which MRI is the standard‐of‐care imaging modality. Also, MRI provides unique characteristics that differ from PET or CT features, providing additional information for prognostication and outcome prediction. In brain, MR images such as contrast‐enhanced T1‐weighted images (T1WICE) and fluid‐attenuated inversion recovery (FLAIR) images can be used to identify different structures such as edema, tumor infiltration, and necrosis. Radiomic models constructed from these images have been shown to predict overall survival,11, 14 identify distinct molecular subtypes of glioblastoma (GBM),15 and identify patients likely to most benefit from antiangiogenic therapy,16 or used as a guide for intensification of postoperative radiation therapy.17 MRI diffusion tensor imaging (DTI) provides noninvasive and reproducible biomarkers that can help with the classification of low‐ and high‐grade glioma, metastasis, and meningioma, and consequently assist with decision‐making for the choice of treatment.18, 19, 20 Multiparametric MRI has also shown an ability to determine the grade, spatial extent, and heterogeneity of brain tumors and consequently help to improve the management of patients with GBM.21
Radiomic analyses that involve the extraction of features may be impacted by variability from two main categories: (a) controllable variability that stems directly from the computational methods used, such as histogram normalization, the quantization level, and three‐dimensional (3D) versus two‐dimensional (2D) analysis; and (b) uncontrollable (or less controllable) variability that originates from image acquisition, reconstruction, and tumor segmentation processes. The responsible use of any radiomic model should: (a) describe how the radiomic features were extracted, including all the preprocessing steps performed and (b) acknowledge the variability of the selected features due to uncontrollable sources.
Although the robustness of radiomic features with respect to acquisition, reconstruction, or segmentation methods and test–retest reproducibility have been well described in PET and CT, these results cannot be directly extrapolated or transferred to MR images.22 To the best of our knowledge, there is only one study that has investigated the interobserver agreement of one radiomic feature (entropy from the co‐occurrence matrix) in diffusion weighted MRI.23
In this study, we investigated the reliability of the segmentation of glioblastoma tumors using two segmentation methods (semiautomatic and interactive with manual corrections) obtained with two raters (medical physicists with knowledge in radiology) and analyzed the robustness of classically used MRI radiomic features based on segmentation reliability. Consequently, this study should help to identify the set of radiomic features that are generally robust and guide the selection of appropriate segmentation techniques for radiomic analyses.
2. Materials and methods
2.A. Patients
From the 262 patients of The Cancer Genome Atlas Glioblastoma Multiforme (TCGA‐GBM) collection (n = 262) of The Cancer Imaging Archive (TCIA),24 136 were excluded due to motion artifacts, huge surgical cavities, or absence of FLAIR/T1WICE images. Ninety patients were randomly selected prior to analysis from the remaining 126 patients. Inclusion criteria consisted of patients with both T1WICE and FLAIR images, and without motion artifacts, or surgical cavities. We analyzed both T1WICE and FLAIR images as the former is commonly used to describe enhancing tumor extent, while the latter has been shown to describe nonenhancing tumor extent despite confounding brain edema.25, 26, 27 Image characteristics, including image resolution, are summarized in Table 1.
Table 1.
Image characteristics.
| Image characteristics | n = 90 (%) |
|---|---|
| Resolution (x,y) mm | |
| [0.4–0.7] | 29 (32%) |
| [0.7–1] | 61 (68%) |
| Slice thickness | |
| 3 mm | 18 (20%) |
| 5 mm | 64 (71%) |
| other | 8 (9%) |
2.B. Image segmentation
The first method implemented a semiautomatic segmentation on the FLAIR images based on the work of Veeraraghavan and Miller 2011.28 Starting from user‐drawn brush strokes on 2–3 slices to identify the tumor and background regions, the algorithm learns a model using a support vector machine (SVM) classifier. This method adds to the competitive region‐growing technique known as the “GrowCut” method that is popular in 3D Slicer29—the main difference being that this method uses a SVM classifier trained on the user’s brush stroke inputs to further refine the GrowCut segmentations.
The second method implemented an interactive segmentation with manual corrections (IMC). This method adds to the competitive region‐growing GrowCut with SVM refinement. To further improve the segmentation, this method incorporates an interactive mode where regions that are difficult to segment are automatically identified by the algorithm and presented as queries to the user to indicate whether those regions correspond to tumor or background. Following user inputs, the SVM is retrained until there are no more regions for querying or the user terminates the algorithm. Postprocessing using standard morphological open–close (by 3 pixels to capture the center and the immediately adjacent pixels) and hole filling are performed to derive smooth segmentation contours in 3D. This method includes algorithm prompting and subsequent user corrections that are lacking in the first method. After the algorithm terminates, the user checks and manually edits the segmentation. Examples of results given by these two segmentation methods are presented in Fig. 1.
Figure 1.
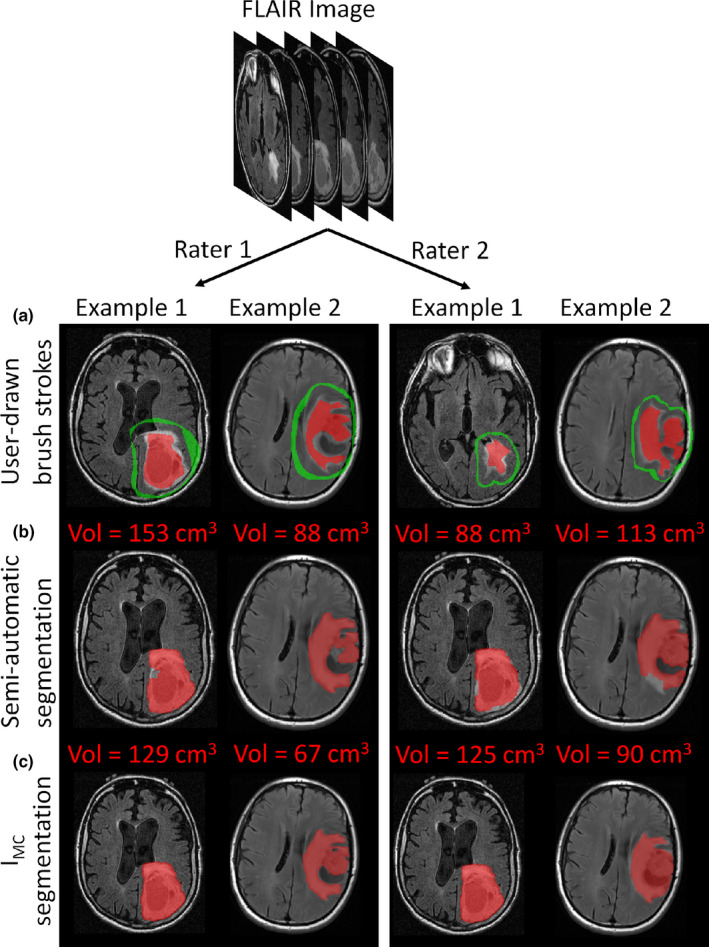
Tumor segmentation for two different patients. (a) User‐drawn brush strokes used to initiate the two segmentation methods; (b) Semi‐automatic segmentation; (c) Interactive segmentation with manual corrections (IMC). The two left columns and two right columns are the results obtained with rater 1 and rater 2, respectively. [Color figure can be viewed at wileyonlinelibrary.com]
2.C. Radiomic feature extraction
The images analyzed in this study presented large in‐plane (0.4–1 mm) and between‐plane (3–5 mm) differences in resolution. For this reason, following the segmentation and prior to radiomic feature extraction, images were resampled with linear interpolation to obtain isotropic voxels of 1 mm3 allowing for the extraction of radiomic features in 3D. In addition, the MR intensities in all images were binned to Q = 128 values using:
| (1) |
with Vmin and Vmax as the minimum and maximum intensity values in the segmented tumor volumes. These binned images were used to compute texture features [Grey Level Co‐occurrence Matrix (GLCM) and Grey Level Size Zone Matrix (GLSZM)], while histogram and shape features were computed from the original images. No additional image preprocessing was performed.
Additionally, Gabor (with four orientations: θ = 0°, 30°, 45°, 90°, and two frequencies: f = 2, 2√2),30 Sobel31 and Laplacian of Gaussian (LoG)32 filtering were applied to extract edge maps from the images.
A total of 108 features were extracted from the FLAIR and T1WICE images: (a) 20 features from the intensity histogram; (b) 26 from the GLCM using 13 directional offsets (3D) and a distance of 1 between the voxels. One co‐occurrence matrix was produced by combining the contributions from all offsets into one and used to calculate the aforementioned features; (c) 15 from the GLSZM using one matrix describing zones in the 3D tumor volume; (d) seven shape features; and (e) four intensity histogram features (mean, standard deviation, skewness, and kurtosis) from ten different edge maps obtained with the filtered FLAIR and T1WICE images.
All investigated features were obtained using the CERR software,33 which is compliant with the Image Biomarkers Standardization Initiative (IBSI).34 The choice of the investigated features was made using the most common radiomic feature categories and based on features that we used in a previous GBM study.11
2.D. Statistical analysis
The interobserver reliability of the two segmentation methods (semiautomatic and IMC) was measured using Bland and Altman analysis35 and the interobserver agreement was quantified by calculating the intraclass correlation coefficient (ICC) using a two‐way random effects model and the mean differences of the two raters.36 The reliability limits were defined as the mean differences ± 1.96 standard deviation (SD) of the differences. The 95% confidence intervals (CIs) were reported for these limits, the mean differences, and the ICCs. The Shapiro–Wilk test37 was used to evaluate the normality of the distribution of differences for the two raters. The effect of voxel size on reliability measurements was investigated using a Mann–Whitney U test.38 For this test, the patient cohort was split into two groups based on low or high resolution [x,y voxel resolution (0.4–0.7) or (0.7–1) mm2, respectively—see Table 1].
The same statistical tests were used to analyze the robustness of the MRI radiomic features due to the reliability of the segmentation method used. All these tests were performed with the Rstudio software (v1.1.453) and P‐values < 0.05 were considered statistically significant. Bland and Altman results were reported with the absolute difference value and with the mean percentage difference according to the following formula:
| (2) |
where ϕ r1 and ϕ r2 are the values of a feature obtained with the segmentation from raters 1 and 2, respectively. The robustness of the MRI radiomic features was evaluated using a six‐level scale (going from 0 to 5) and based on a combination of ICCs and SD of the mean percentage differences between the two raters, named SDdiffs in the manuscript. On this scale, we set level 0 to correspond to features with the highest (or very high) robustness with an SDdiffs ≤ 10% and an ICC ≥ 90% and level 5 to correspond to features with the lowest (or very low) robustness with an SDdiffs > 100% and an ICC < 70%. This scale is described in the legend of Fig. 2. Our six‐level scale consists of very low (level 5), low (4), limited (3), medium (2), high (1), and very high (0) robustness.
Figure 2.
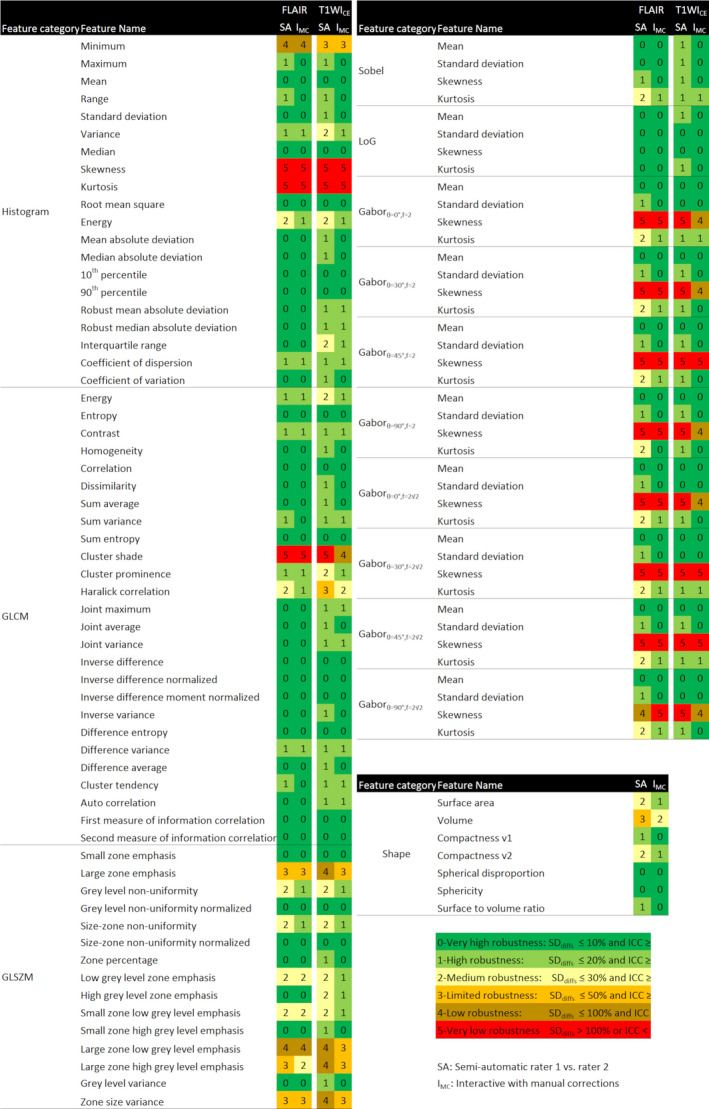
Robustness of the radiomic features obtained on FLAIR and T1WICE images using semiautomatic segmentation with raters 1 and 2 (columns ‘SA’) and using interactive segmentation with manual corrections with raters 1 and 2 (columns ‘IMC’). FLAIR, Fluid‐attenuated inversion recovery [Color figure can be viewed at wileyonlinelibrary.com]
From this scale, we computed a category robustness ϒΩ to summarize the robustness by feature category across the segmentation methods and the image sequences (FLAIR, TIWICE):
| (3) |
where is the level value on the scale described above for the robustness of feature i and Ω is the feature category (or all the features together). This formula gives values between 0 and 1, with a higher value corresponding to a higher robustness.
3. Results
3.A. Segmentation reliability
Table 2 contains a summary of the reliability results for the tumor volume obtained by the two raters for the two segmentation methods. The highest differences were found for the semiautomatic method with a mean difference of 8.2 ± 30.4% and an ICC of 0.96. The IMC method gave the best reliability with a mean difference of 1.5 ± 21.5% and an ICC of 0.99.
Table 2.
Reliability results of volume segmentation using the semiautomatic and interactive with manual corrections (IMC) methods between the two raters.
| Method | Differencesa | LRL [95% CI] | Mean ± SD [95% CI] | URL [95% CI] | ICC [95% CI] |
|---|---|---|---|---|---|
| Semiautomatic | cm3 | −40.4 [−48.7 to −32.1] | 4.5 ± 22.9 [−0.3 to 9.3] | 49.4 [41.1 to 57.7] | 0.96 [0.94, 0.98] |
| percentage | −51.5 [−62.5 to −40.4] | 8.2 ± 30.4 [1.8 to 14.6] | 67.8 [56.8 to 78.9] | ||
| IMC | cm3 | −27.0 [−32.1 to −22.0] | 0.3 ± 14.0 [−2.6 to 3.3] | 27.7 [22.6 to 32.8] | 0.99 [0.98, 0.99] |
| percentage | −40.6 [−48.4 to −32.8] | 1.5 ± 21.5 [−3.0 to 6.0] | 43.7 [35.9 to 51.5] |
ICC, intraclass correlation coefficient; IMC, interactive with manual corrections; LRL, lower reliability limit; URL, upper reliability limit.
Differences have a non‐normal distribution according to the Shapiro–Wilk test.
The tumor volumes generated by both semiautomatic and IMC methods using the two rater inputs were highly similar for patients with voxel resolutions (x,y) < or ≥ 0.7 mm2 the Mann–Whitney U test gave P‐values 0.28 and 0.24 for the semiautomatic and IMC methods, respectively (see Fig. 3).
Figure 3.
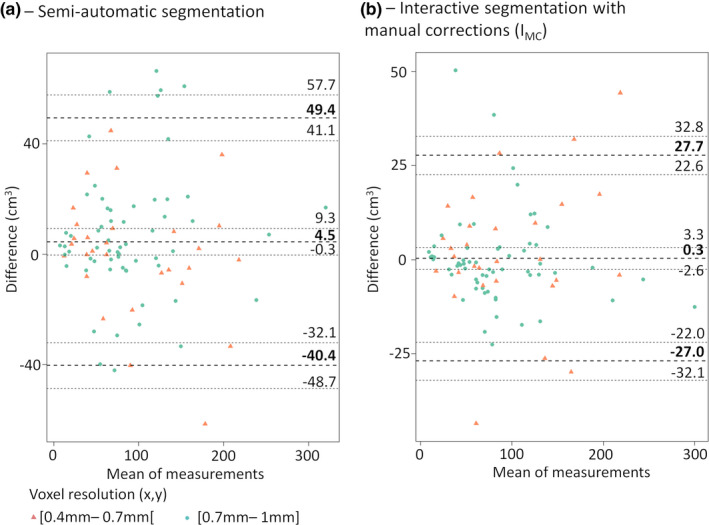
Bland and Altman plots for (a)—semiautomatic, (b)—interactive with manual corrections segmentation (IMC). Results report the mean difference between the two raters in cm3 with 95% CI and the lower and upper reliability limits with 95% CI. CI, confidence interval. [Color figure can be viewed at wileyonlinelibrary.com]
3.B. Robustness of the MRI radiomic features against the segmentation method
Table 3 summarizes the results of the robustness of MRI radiomic feature categories for both segmentation methods. Figure 2 shows the results of the robustness of individual MRI radiomic features for both segmentation methods.
Table 3.
Robustness of each feature category across segmentation techniques (SA = semiautomatic; IMC = interactive with manual corrections) and image sequences (FLAIR and T1WICE) according to Eq. (3).
| FLAIR | T1WICE | |||
|---|---|---|---|---|
| Feature category | SA | IMC | SA | IMC |
| Histogram | 0.80 | 0.83 | 0.72 | 0.81 |
| Shape | 0.74 | 0.89 | 0.74 | 0.89 |
| GLCM | 0.90 | 0.92 | 0.81 | 0.88 |
| GLSZM | 0.72 | 0.76 | 0.61 | 0.77 |
| Edge features | 0.67 | 0.76 | 0.71 | 0.81 |
| All | 0.76 | 0.82 | 0.72 | 0.83 |
FLAIR, Fluid‐attenuated inversion recovery; GLCM, Grey level co‐occurrence matrix; GLSZM, Grey level size zone matrix.
3.B.1. FLAIR images
The histogram feature category extracted from the volume of interest (VOI) had a robustness of ϒ histogram = 0.80 and ϒ histogram = 0.83 for the semiautomatic and IMC methods, respectively. Individual histogram features had high to very high robustness except for skewness and kurtosis (very low robustness for both methods), minimum (low robustness for both methods), and energy (medium robustness for the semiautomatic method and high robustness for the IMC method).
The GLCM feature category had a robustness of ϒGLCM = 0.90 and ϒGLCM = 0.92 for the semiautomatic and IMC methods, respectively. Individual GLCM features had high to very high robustness for both methods with the exception of cluster shade (very low robustness for both methods) and Haralick correlation (medium robustness for the semiautomatic method and high robustness for the IMC method).For most of the individual GLCM features, robustness was higher for the IMC method compared with the semiautomatic method.
The edge feature category had a robustness of ϒedge = 0.67 and ϒedge = 0.76 for the semiautomatic and IMC segmentation methods, respectively. Mean and standard deviation features from the edge maps showed high to very high robustness irrespective of the segmentation method. Skewness computed from the edge maps showed very low to low robustness except for those computed from Sobel and Laplacian of Gaussian (LoG) edge maps. Kurtosis showed medium robustness for the semiautomatic method and high robustness for IMC method.
The GLSZM feature category had a robustness of and ϒGLSZM = 0.72 and ϒGLSZM = 0.76 for the semiautomatic and IMC segmentation methods, respectively. Individual GLSZM features exhibited mixed robustness ranging from low to very high robustness. The most robust features for this category were: small zone emphasis, gray‐level nonuniformity normalized, size zone nonuniformity normalized, zone percentage, small zone high gray‐level emphasis and gray‐level variance. These features were generally less robust than features of a different feature category regardless of the segmentation method.
In addition to the summarized results from Table 3 and Fig. 2, the full results including the lower and upper reliability limits together with the 95% CI of these limits, mean differences and ICCs, and absolute value of the differences are reported in Tables S1 and S2.
3.B.2. T1WICEimages
The histogram feature category had a robustness of ϒ histogram = 0.72 and ϒ histogram = 0.81 for the semiautomatic and IMC methods, respectively. Irrespective to the segmentation method, skewness and kurtosis histogram features showed very low robustness while minimum showed limited robustness. All the other features showed medium to very high robustness and for many of these features, robustness increased by one level between the semiautomatic and IMC segmentation methods.
The GLCM feature category for T1WICE images had a robustness of ϒGLSZM = 0.81 and ϒGLSZM = 0.88 for the semiautomatic and IMC methods, respectively. Individual GLCM features also showed similar robustness to that of GLCM features computed from FLAIR images, where all features except cluster shade, cluster prominence, Haralick correlation, and energy showed high to very high robustness.
The edge feature category had a robustness of ϒedge = 0.71 and ϒedge = 0.81 for the semiautomatic and IMC methods, respectively. All individual edge features had high to very high robustness with the exception of skewness computed from the Gabor edge maps (very low to low robustness).
The GLSZM feature category had a robustness of ϒGLSZM = 0.61 and ϒGLSZM = 0.77 for the semiautomatic and IMC methods, respectively. Grey Level Size Zone Matrix features exhibited mixed robustness ranging from low to very high robustness. The most robust features for this category were small zone emphasis, gray‐level nonuniformity normalized, and size‐zone nonuniformity normalized.
In addition to the summarized results from Table 3 and Fig. 2, the full results including the lower and upper reliability limits together with the 95% CI of these limits, mean differences, and ICCs, and absolute value of the differences are reported in Tables S3 and S4.
3.B.3. Shape features
The shape feature category had a robustness of ϒshape = 0.74 and ϒshape = 0.89 for the semiautomatic and IMC methods, respectively. The highest robustness was found for spherical disproportion and sphericity with IMC segmentation (Fig. 2, Table 3). For additional details, the full results are reported in Tables S5 and S6.
3.B.4. Overall results
Overall, features had a category robustness ϒ overall ranging between 0.72 to 0.76 for the semiautomatic method and 0.82 to 0.83 for the IMC method. On FLAIR images, category robustness was ϒ overall = 0.76 and ϒ overall = 0.82 for the semiautomatic and IMC segmentation methods, respectively. When using T1WICE, the category robustness for the features improved from ϒ overall = 0.72 for the semiautomatic to ϒ overall = 0.83 for the IMC segmentation method.
4. Discussion
In this study, we investigated the inter‐rater robustness of MRI‐radiomic features. We also studied the reliability of segmented tumor volumes when using two raters and obtained using semiautomatic and IMC segmentation to achieve a close approximation of the tumor extent. Prior studies have shown that semiautomatic methods lead to more reproducible segmentations and radiomic features than those computed using manual delineations.39, 40, 41 Consequently, we looked at the utility of adding machine learning to a semiautomatic, competitive region‐growing or GrowCut segmentation with SVM learning in two different modes. In one mode, called the semiautomatic method, the algorithm simply uses the user inputs as brush strokes and derives a segmentation. In the second mode, called the interactive mode with manual corrections (IMC), the algorithm queries back the user based on the uncertainty derived from the machine learning method to appropriately adjust its segmentation. In other words, the algorithm queries are directed only toward areas that are hard to segment by the algorithm with the goal of reducing time‐consuming slice‐by‐slice user verification. Recent works on segmentation of brain tumors allow automatic detection of tumors and achieve closer‐to‐expert manual segmentations than those obtained with the semiautomatic method used here.42, 43, 44, 45 Clearly, more advanced and fully automated deep learning methods43, 46, 47 could lead to more accurate tumor segmentations and speed up the workflow for automated radiomic analysis. Results from the BRATS challenge can be used for selecting the best deep learning methods.48 However, one major drawback of these methods is their interpretability. Furthermore, deep learning methods would still require manual correction even if it were so for fewer cases and slices than the interactive method. This is simply because any machine learning method is optimized for its training set that is based on one or utmost a few experts. As a consequence, it is generally impossible to get perfectly accurate segmentations on a completely different testing set. For these two reasons, we used the interactive method with manual corrections to obtain a reasonable representation of radiomic feature robustness across raters.
The semiautomatic algorithm has the advantage that once initiated through user‐drawn brush strokes, no additional inputs are necessary, and it demonstrated a high segmentation reliability between the two raters with an ICC of 0.96. However, this method led to less accurate segmentations in some tumors adjacent to the skull due to segmentation leakage into small portions of the skull. This can adversely impact the reliability of the MRI features obtained from these volumes and result in a misleading interpretation of the utility of these features as biomarkers of treatment response or outcome. On the other hand, IMC segmentation allowed for the correction of these obvious mistakes in the segmentation. This method showed a high reliability with an ICC of up to 0.99.
Although our results showed that the volumes generated between the two raters were not normally distributed given their skewed distributions, the original work by Bland and Altman validates the application of this method to our data.35
The segmentation was generated from FLAIR images and the segmented volumes were then utilized on T1WICE. We chose to segment on FLAIR because we found that the inclusion of the FLAIR hyperintense tumoral and peritumoral lesion (usually larger than the contrast enhanced lesion) helps the radiomic features quantify the strength of tumor edges on T1WICE.11 Moreover, texture matrices used for the extraction of radiomic features were computed using the 3DVOI as is commonly done with PET/CT images.
In our study, we identified that the IMC segmentation method led to more robust features compared with the semiautomatic method. We believe that the increased robustness using the IMC method may result from their reliance on accurate tumor segmentation especially close to the boundaries of the tumor, which are discernable to the human eye and can be corrected.
Similar to the results obtained on the tumor volume, most of the considered features were not normally distributed and the reliability limits and 95% CIs reported should be used with caution. Images were resampled to obtain isotropic voxels of 1 mm3 in order to compute radiomic features in 3D, which reduced the impact of wide differences between in‐plane and between‐plane resolutions. Such resampling techniques have been shown to be useful for outcome studies, especially when using multi‐institutional patient scans that do not share the same resolution.
The 6‐point scale used in this manuscript was made in order to summarize the results on easy‐to‐read table and figures, but thresholds may not be adapted for all situations (annexes contain the full raw results). The feature robustness metrics considered in this study gives an indication of the degree by which features may be impacted by the segmentation method of choice. Nonetheless, the robustness values themselves should not be interpreted as a means for selecting features. Instead, low robustness indicates that the threshold levels used to distinguish outcomes using a particular measure should be stringent on the number of outliers allowed to distinguish classes. For instance, skewness of the Gabor edge maps was found to have a very low robustness in this study. Yet in a previous study, high negative skewness of Gabor edges was identified as a biomarker to differentiate patients with GBM by survival,11 and with a threshold of −0.49 it misclassified only <3% of the patients in this study, using IMC segmentation. Similarly, high robustness should not be used as a criterion to select features. Some of the features included in this study, such as the ones derived from Sobel and LoG edge maps, were found to be robust to inter‐rater segmentation variations but to our knowledge have never been described as useful predictors of outcome or therapy response in GBM patients. In other words, robustness can be a motivation for feature exclusion but not for feature inclusion. Inclusion must be realized using feature selection techniques such as LASSO49 and/or knowledge of the pathology. In GBMs, studies often describe histogram, Gabor edge, GLSZM, and GLCM features from T1WICE and FLAIR images as predictors of patient survival,11, 50, 51 MGMT methylation status52, 53 or chemoradiation response.54
This study suffers from some limitations: First, despite isotropic resampling, the lack of 3D MR acquisitions can limit the relevance of the radiomic features computed in 3D. Secondly, results presented here are valid for GBM and even if the images we analyzed show variabilities in terms of sizes and compactness (volume: median = 76 cm3, interquartile range = 83 cm3; sphericity: median = 0.75, interquartile range = 0.16), other cancer models with smaller tumor volumes or lower compactness may lead to less robust features. As a result, the reported values for radiomic features should be similar to other cancer models with similar tumor volume and compactness since the segmentation methods showed comparable reliability.
5. Conclusion
This study reports applied semiautomatic and interactive segmentation with manual corrections (IMC) methods to compute MRI‐radiomic features. Our results show that both methods produce reliable volumes from inter‐rater inputs and reasonably robust radiomic measures. In particular, the GLCM textures were robust, and a subset of GLSZM features was robust through interactive segmentation.
Conflicts of interest
The authors have no relevant conflicts of interest to disclose.
Supporting information
Table S1: Reliability results of the radiomics features obtained on FLAIR images using semi‐automatic segmentation with raters 1 and 2.
Table S2: Reliability results of the radiomics features obtained on FLAIR images using interactive + manual corrections segmentation (IMC) with raters 1 and 2.
Table S3: Reliability results of the radiomics features obtained on T1WICE images using semi‐automatic segmentation with raters 1 and 2.
Table S4: Reliability results of the radiomics features obtained on T1WICE images using interactive + manual corrections segmentation (IMC) with rater 1 and 2.
Table S5: Reliability results of the shape features obtained using using semi‐automatic segmentation with raters 1 and 2.
Table S6: Reliability results of the shape features obtained using interactive + manual corrections segmentation (IMC) with rater 1 and 2.
Acknowledgments
The authors are grateful for expert editorial advice from Ms. Joanne Chin. This work was supported in part through the NIH/NCI Cancer Center Core Support Grant P30 CA008748, the MSK Brain Tumor Center, and the MSK Neuro‐Oncology Research Translation in Humans Program.
Florent Tixier and Hyemin Um contributed equally to this work
2.E. Data availability
The segmentations generated and analyzed during this study are available from the corresponding author upon reasonable request.
References
- 1. Lambin P, Rios‐Velazquez E, Leijenaar R, et al. Radiomics: extracting more information from medical images using advanced feature analysis. Eur J Cancer. 2012;48:441–446. [DOI] [PMC free article] [PubMed] [Google Scholar]
- 2. Morin O, Vallières M, Jochems A, et al. A deep look into the future of quantitative imaging in oncology: A statement of working principles and proposal for change. Int J Radiat Oncol. 2018;102:1074–1082. [DOI] [PubMed] [Google Scholar]
- 3. Peeken JC, Bernhofer M, Wiestler B, et al. Radiomics in radiooncology – challenging the medical physicist. Phys Med. 2018;48:27–36. [DOI] [PubMed] [Google Scholar]
- 4. El Naqa I, Grigsby PW, Apte A, et al. Exploring feature‐based approaches in PET images for predicting cancer treatment outcomes. Pattern Recognit. 2009;42:1162–1171. [DOI] [PMC free article] [PubMed] [Google Scholar]
- 5. Kumar V, Gu Y, Basu S, et al. Radiomics: the process and the challenges. Magn Reson Imaging. 2012;30:1234–1248. [DOI] [PMC free article] [PubMed] [Google Scholar]
- 6. Tixier F, Rest CCL, Hatt M, et al. Intratumor heterogeneity characterized by textural features on baseline 18F‐FDG PET images predicts response to concomitant radiochemotherapy in esophageal cancer. J Nucl Med. 2011;52:369–378. [DOI] [PMC free article] [PubMed] [Google Scholar]
- 7. Wang J, Kato F, Oyama‐Manabe N, et al. Identifying triple‐negative breast cancer using background parenchymal enhancement heterogeneity on dynamic contrast‐enhanced MRI: a pilot radiomics study. PLoS ONE. 2015;10:e0143308. [DOI] [PMC free article] [PubMed] [Google Scholar]
- 8. Vallières M, Freeman CR, Skamene SR, Naqa IE. A radiomics model from joint FDG‐PET and MRI texture features for the prediction of lung metastases in soft‐tissue sarcomas of the extremities. Phys Med Biol. 2015;60:5471. [DOI] [PubMed] [Google Scholar]
- 9. Nie K, Shi L, Chen Q, et al. Rectal cancer: assessment of neoadjuvant chemo‐radiation outcome based on radiomics of multi‐parametric MRI. Clin Cancer Res. 2016;22:5256–5264. clincanres.2997.2015. [DOI] [PMC free article] [PubMed] [Google Scholar]
- 10. Sutton EJ, Oh JH, Dashevsky BZ, et al. Breast cancer subtype intertumor heterogeneity: MRI‐based features predict results of a genomic assay. J Magn Reson Imaging. 2015;42:1398–1406. [DOI] [PMC free article] [PubMed] [Google Scholar]
- 11. Tixier F, Um H, Bermudez D, et al. Preoperative MRI‐radiomics features improve prediction of survival in glioblastoma patients over MGMT methylation status alone. Oncotarget. 2019;10:660–672. [DOI] [PMC free article] [PubMed] [Google Scholar]
- 12. Li H, Zhu Y, Burnside ES, et al. Quantitative MRI radiomics in the prediction of molecular classifications of breast cancer subtypes in the TCGA/TCIA data set. NPJ Breast Cancer. 2016;2:16012. [DOI] [PMC free article] [PubMed] [Google Scholar]
- 13. Gillies RJ, Kinahan PE, Hricak H. Radiomics: Images Are More than Pictures, They Are Data. Radiology. 2015;278:563–577. [DOI] [PMC free article] [PubMed] [Google Scholar]
- 14. Chaddad A, Desrosiers C, Toews M.Radiomic analysis of multi‐contrast brain MRI for the prediction of survival in patients with glioblastoma multiforme. In: 2016 38th Annual International Conference of the IEEE Engineering in Medicine and Biology Society (EMBC); 2016:4035–4038. [DOI] [PubMed]
- 15. Rathore S, Akbari H, Rozycki M, et al. Radiomic MRI signature reveals three distinct subtypes of glioblastoma with different clinical and molecular characteristics, offering prognostic value beyond IDH1. Sci Rep. 2018;8:5087. [DOI] [PMC free article] [PubMed] [Google Scholar]
- 16. Kickingereder P, Götz M, Muschelli J, et al. Large‐scale radiomic profiling of recurrent glioblastoma identifies an imaging predictor for stratifying anti‐angiogenic treatment response. Clin Cancer Res. 2016;22:5765–5771. [DOI] [PMC free article] [PubMed] [Google Scholar]
- 17. Rathore S, Akbari H, Doshi J, et al. Radiomic signature of infiltration in peritumoral edema predicts subsequent recurrence in glioblastoma: implications for personalized radiotherapy planning. J Med Imaging. 2018;5:021219. [DOI] [PMC free article] [PubMed] [Google Scholar]
- 18. Jones TL, Byrnes TJ, Yang G, Howe FA, Bell BA, Barrick TR. Brain tumor classification using the diffusion tensor image segmentation (D‐SEG) technique. Neuro‐Oncol. 2015;17:466–476. [DOI] [PMC free article] [PubMed] [Google Scholar]
- 19. Yang G, Jones TL, Howe FA, Barrick TR. Morphometric model for discrimination between glioblastoma multiforme and solitary metastasis using three‐dimensional shape analysis. Magn Reson Med. 2016;75:2505–2516. [DOI] [PubMed] [Google Scholar]
- 20. Yang G, Jones TL, Barrick TR, Howe FA. Discrimination between glioblastoma multiforme and solitary metastasis using morphological features derived from the p:q tensor decomposition of diffusion tensor imaging. NMR Biomed. 2014;27:1103–1111. [DOI] [PubMed] [Google Scholar]
- 21. Raschke F, Barrick TR, Jones TL, Yang G, Ye X, Howe FA. Tissue‐type mapping of gliomas. NeuroImage Clin. 2019;21:101648. [DOI] [PMC free article] [PubMed] [Google Scholar]
- 22. Traverso A, Wee L, Dekker A, Gillies R. Repeatability and reproducibility of radiomic features: a systematic review. Int J Radiat Oncol. 2018;102:1143–1158. [DOI] [PMC free article] [PubMed] [Google Scholar]
- 23. Guan Y, Li W, Jiang Z, et al. Whole‐lesion apparent diffusion coefficient‐based entropy‐related parameters for characterizing cervical cancers: initial findings. Acad Radiol. 2016;23:1559–1567. [DOI] [PubMed] [Google Scholar]
- 24. Clark K, Vendt B, Smith K, et al. The Cancer Imaging Archive (TCIA): maintaining and operating a public information repository. J Digit Imaging. 2013;26:1045–1057. [DOI] [PMC free article] [PubMed] [Google Scholar]
- 25. Chang PD, Malone HR, Bowden SG, et al. A Multiparametric model for mapping cellularity in glioblastoma using radiographically localized biopsies. Am J Neuroradiol. 2017;38:890–898. [DOI] [PMC free article] [PubMed] [Google Scholar]
- 26. John F, Bosnyák E, Robinette NL, et al. Multimodal imaging‐defined subregions in newly‐diagnosed glioblastoma: impact on overall survival. Neuro‐Oncol. 2019;21:264–273. [DOI] [PMC free article] [PubMed] [Google Scholar]
- 27. Li YM, Suki D, Hess K, Sawaya R. The influence of maximum safe resection of glioblastoma on survival in 1229 patients: can we do better than gross‐total resection? J Neurosurg. 2016;124:977–988. [DOI] [PubMed] [Google Scholar]
- 28. Veeraraghavan H, Miller JV Active learning guided interactions for consistent image segmentation with reduced user interactions. In: 2011 IEEE International Symposium on Biomedical Imaging: From Nano to Macro.; 2011:1645–1648. [DOI] [PMC free article] [PubMed]
- 29. Egger J, Kapur T, Fedorov A, et al. GBM volumetry using the 3D Slicer medical image computing platform. Sci Rep. 2013;3:1364. [DOI] [PMC free article] [PubMed] [Google Scholar]
- 30. Daugman JG. Uncertainty relation for resolution in space, spatial frequency, and orientation optimized by two‐dimensional visual cortical filters. J Opt Soc Am A. 1985;2:1160–1169. [DOI] [PubMed] [Google Scholar]
- 31. An Sobel I. An isotropic 3x3 image gradient operater. Mach Vis Three‐Dimens Scenes. 1990;376–379. [Google Scholar]
- 32. Huertas A, Medioni G. Detection of Intensity Changes with Subpixel Accuracy Using Laplacian‐Gaussian Masks. IEEE Trans Pattern Anal Mach Intell. 1986;PAMI‐8:651–664. [DOI] [PubMed] [Google Scholar]
- 33. Apte AP, Iyer A, Crispin‐Ortuzar M, et al. Technical Note: extension of CERR for computational radiomics: a comprehensive MATLAB platform for reproducible radiomics research. Med Phys. 2018;45:3713–3720. 10.1002/mp.13046. [DOI] [PMC free article] [PubMed] [Google Scholar]
- 34. Zwanenburg A, Leger S.Vallières M, Löck S, Initiative for the IBS . Image biomarker standardisation initiative. ArXiv161207003 Cs. December 2016. Retrieved from http://arxiv.org/abs/1612.07003. Accessed November 20, 2018.
- 35. Bland JM, Altman DG. Measuring agreement in method comparison studies. Stat Methods Med Res. 1999;8:135–160. [DOI] [PubMed] [Google Scholar]
- 36. Koo TK, Li MY. A Guideline of selecting and reporting intraclass correlation coefficients for reliability research. J Chiropr Med. 2016;15:155–163. [DOI] [PMC free article] [PubMed] [Google Scholar]
- 37. Shapiro SS, Wilk MB. An analysis of variance test for normality (complete samples). Biometrika. 1965;52:591–611. [Google Scholar]
- 38. Mann HB, Whitney DR. On a test of whether one of two random variables is stochastically larger than the other. Ann Math Stat. 1947;18:50–60. [Google Scholar]
- 39. Velazquez ER, Parmar C, Jermoumi M, et al. Volumetric CT‐based segmentation of NSCLC using 3D‐Slicer. Sci Rep. 2013;3:3529. [DOI] [PMC free article] [PubMed] [Google Scholar]
- 40. Parmar C, Rios Velazquez E, Leijenaar R, et al. Radiomics feature quantification using semiautomatic volumetric segmentation. PLoS ONE. 2014;9:e102107. [DOI] [PMC free article] [PubMed] [Google Scholar]
- 41. Veeraraghavan H, Dashevsky BZ, Onishi N, et al. Appearance constrained semi‐automatic segmentation from DCE‐MRI is reproducible and feasible for breast cancer radiomics: a feasibility study. Sci Rep. 2018;8:41598. [DOI] [PMC free article] [PubMed] [Google Scholar]
- 42. Soltaninejad M, Yang G, Lambrou T, et al. Automated brain tumour detection and segmentation using superpixel‐based extremely randomized trees in FLAIR MRI. Int J Comput Assist Radiol Surg. 2017;12:183–203. [DOI] [PMC free article] [PubMed] [Google Scholar]
- 43. Dong H, Yang G, Liu F, Mo Y, Guo Y. Automatic Brain Tumor Detection and Segmentation Using U‐Net Based Fully Convolutional Networks. May 2017. https://arxiv.org/abs/1705.03820v3. Accessed April 18, 2019.
- 44. Menze BH, Jakab A, Bauer S, et al. The multimodal brain tumor image segmentation benchmark (BRATS). IEEE Trans Med Imaging. 2015;34:1993–2024. [DOI] [PMC free article] [PubMed] [Google Scholar]
- 45. Soltaninejad M, Yang G, Lambrou T, et al. Supervised learning based multimodal MRI brain tumour segmentation using texture features from supervoxels. Comput Methods Programs Biomed. 2018;157:69–84. [DOI] [PubMed] [Google Scholar]
- 46. AlBadawy EA, Saha A, Mazurowski MA. Deep learning for segmentation of brain tumors: impact of cross‐institutional training and testing. Med Phys. 2018;45:1150–1158. [DOI] [PubMed] [Google Scholar]
- 47. Yi D, Zhou M, Chen Z, Gevaert O.3‐D Convolutional Neural Networks for Glioblastoma Segmentation. ArXiv161104534 Cs. November 2016. http://arxiv.org/abs/1611.04534. Accessed April 22, 2019.
- 48. Bakas S, Reyes M, Jakab A, et al.Identifying the Best Machine Learning Algorithms for Brain Tumor Segmentation, Progression Assessment, and Overall Survival Prediction in the BRATS Challenge. ArXiv181102629 Cs Stat. November 2018. http://arxiv.org/abs/1811.02629. Accessed May 16, 2019.
- 49. Tibshirani R. Regression shrinkage and selection via the lasso. J R Stat Soc Ser B Methodol. 1996;58:267–288. [Google Scholar]
- 50. Upadhaya T, Morvan Y, Stindel E, Le Reste P‐J, Hatt M. A framework for multimodal imaging‐based prognostic model building: preliminary study on multimodal MRI in glioblastoma multiforme. IRBM. 2015;36:345–350. [Google Scholar]
- 51. Bae S, Choi YS, Ahn SS, et al. Radiomic MRI phenotyping of glioblastoma: improving survival prediction. Radiology. 2018:289:797–806. [DOI] [PubMed] [Google Scholar]
- 52. Panagiotis Korfiatis, Kline Timothy L, Lucie Coufalova, et al. MRI texture features as biomarkers to predict MGMT methylation status in glioblastomas. Med Phys. 2016;43:2835–2844. [DOI] [PMC free article] [PubMed] [Google Scholar]
- 53. Li Z‐C, Bai H, Sun Q, et al. Multiregional radiomics features from multiparametric MRI for prediction of MGMT methylation status in glioblastoma multiforme: a multicentre study. Eur Radiol. 2018;28:3640–3650. [DOI] [PubMed] [Google Scholar]
- 54. Rosen BS, Wahl DR, Cao Y, et al. Radiomic signature to predict response to chemoradiation in postoperative GBM Patients. Int J Radiat Oncol Biol Phys. 2017;99(2):S81. [Google Scholar]
Associated Data
This section collects any data citations, data availability statements, or supplementary materials included in this article.
Supplementary Materials
Table S1: Reliability results of the radiomics features obtained on FLAIR images using semi‐automatic segmentation with raters 1 and 2.
Table S2: Reliability results of the radiomics features obtained on FLAIR images using interactive + manual corrections segmentation (IMC) with raters 1 and 2.
Table S3: Reliability results of the radiomics features obtained on T1WICE images using semi‐automatic segmentation with raters 1 and 2.
Table S4: Reliability results of the radiomics features obtained on T1WICE images using interactive + manual corrections segmentation (IMC) with rater 1 and 2.
Table S5: Reliability results of the shape features obtained using using semi‐automatic segmentation with raters 1 and 2.
Table S6: Reliability results of the shape features obtained using interactive + manual corrections segmentation (IMC) with rater 1 and 2.
Data Availability Statement
The segmentations generated and analyzed during this study are available from the corresponding author upon reasonable request.