Abstract
Purpose
Our goal was to use a generative adversarial network (GAN) with feature matching and task‐specific perceptual loss to synthesize standard‐dose amyloid Positron emission tomography (PET) images of high quality and including accurate pathological features from ultra‐low‐dose PET images only.
Methods
Forty PET datasets from 39 participants were acquired with a simultaneous PET/MRI scanner following injection of 330 ± 30 MBq of the amyloid radiotracer 18F‐florbetaben. The raw list‐mode PET data were reconstructed as the standard‐dose ground truth and were randomly undersampled by a factor of 100 to reconstruct 1% low‐dose PET scans. A 2D encoder‐decoder network was implemented as the generator to synthesize a standard‐dose image and a discriminator was used to evaluate them. The two networks contested with each other to achieve high‐visual quality PET from the ultra‐low‐dose PET. Multi‐slice inputs were used to reduce noise by providing the network with 2.5D information. Feature matching was applied to reduce hallucinated structures. Task‐specific perceptual loss was designed to maintain the correct pathological features. The image quality was evaluated by peak signal‐to‐noise ratio (PSNR), structural similarity (SSIM), and root mean square error (RMSE) metrics with and without each of these modules. Two expert radiologists were asked to score image quality on a 5‐point scale and identified the amyloid status (positive or negative).
Results
With only low‐dose PET as input, the proposed method significantly outperformed Chen et al.'s method (Chen et al. Radiology. 2018;290:649–656) (which shows the best performance in this task) with the same input (PET‐only model) by 1.87 dB in PSNR, 2.04% in SSIM, and 24.75% in RMSE. It also achieved comparable results to Chen et al.'s method which used additional magnetic resonance imaging (MRI) inputs (PET‐MR model). Experts' reading results showed that the proposed method could achieve better overall image quality and maintain better pathological features indicating amyloid status than both PET‐only and PET‐MR models proposed by Chen et al.
Conclusion
Standard‐dose amyloid PET images can be synthesized from ultra‐low‐dose images using GAN. Applying adversarial learning, feature matching, and task‐specific perceptual loss are essential to ensure image quality and the preservation of pathological features.
Keywords: deep learning, GAN, ultra‐low‐dose PET reconstruction
1. Introduction
Positron emission tomography (PET) is a widely used imaging technique in many clinical applications including tumor detection1 and neurological disorder diagnosis.2 In particular, amyloid PET plays a significant role in dementia diagnosis. The amyloid plaque buildup is an important biomarker for Alzheimer's disease (AD) diagnosis, where AD patients usually show tracer retention in the cerebral cortex area (amyloid status positive) with amyloid imaging.3, 4 The interpretability of the amyloid status from the PET scans largely decides the diagnosis accuracy.
To obtain high‐quality images, the amount of injected radiotracer in current protocols leads to the risk of radiation exposure in scanned subjects. As AD trials begin to focus on younger, cognitively intact subjects, reduced dosage is especially desirable.5 Decreasing this injected dose can lower radiation exposure risk6 as well as imaging costs,7, 8 though at the expense of lowering the PET image signal‐to‐noise ratio and structural similarity, further affecting the disease diagnosis. To solve this problem, an algorithm9 was proposed to synthesize high quality and accurate PET images either with only ultra‐low‐dose PET images as input (PET‐only model) or with additional magnetic resonance imaging (MRI) inputs (PET‐MR model). A deep convolutional neural network with loss was used for image reconstruction. To the best of our knowledge, this method holds the best performance on ultra‐low‐dose amyloid PET reconstruction. However, this method could only generate high‐quality images with additional MRI contrast images while generating blurry images when only low‐dose PET inputs were available. This limited the utility of the method to data acquired on PET/MRI machines only; however, most clinical trials still use PET/CT scanners where no simultaneous MRI data are available.
In Chen et al.'s method8, 9 where only an encoder‐decoder structure was used for image synthesis, blurriness and missing details could be noticed in some key structures. It is inevitable as only an "unstructured" loss function is used, which means each output pixel is considered conditionally independent from others given the input image. To address the issues of blurriness and missing details, structured loss,10 which penalizes the joint configuration of the output, and adversarial learning enables the network proposed in this work to synthesize images with more realistic features.
Recently, generative adversarial networks (GANs) have attracted a lot of attention in computer vision applications, yielding superior performance on image translation and generation, and have been gaining more interest from the medical field. Introduced by Ian Goodfellow,11 Generative adversarial networks are generative models with the objective of learning the underlying distribution of training data in order to generate new realistic data samples. Pix2pix conditional GAN10 was proposed to solve supervised image‐to‐image translation problems. Medical image translation tasks have been explored on computed tomography (CT) to PET,12 CT to MRI, MRI to CT,13 and fourfold low‐dose PET to standard‐dose PET.14 Other work14, 15 also incorporated non‐adversarial losses from recent image style transfer techniques16 which transferred the style of an input image onto the output image, matching their textures and details in the process. Most of these applications were based on the pix2pix architecture. The performance on these tasks shows the potential of reconstructing images with detailed structures. In this study, we aimed to train a GAN‐based deep network to synthesize diagnostic‐quality standard‐dose‐like images with ultra‐low‐dose PET (99% dose reduction) as input.
2. Materials and methods
2.A. Data acquisition and preprocessing
Using a simultaneous time‐of‐flight enabled PET/MRI scanner (Signa, GE Healthcare, Waukesha, WI, USA), 40 sets of PET data were acquired from 39 participants at 90–110 min after the injection of 330 ± 30 MBq of the amyloid radiotracer 18F‐florbetaben. The raw list‐mode PET data were reconstructed as the standard‐dose ground truth and were randomly undersampled by a factor of 100 to reconstruct 1% low‐dose PET scans. Positron emission tomography reconstruction was performed using the standard Ordered Subsets Expectation Maximization (OSEM) method with two iterations and 28 subsets, with correction for randoms17, scatter,18 dead time, and attenuation.19 Attenuation correction was performed using the vendor's default algorithm, which uses an atlas created from 2‐point Dixon MR imaging. Each PET volume consists of 89 2.78 mm‐thick slices with 256 mm2 × 256 mm2 1.17 mm2 × 1.17 mm2 pixels. Each volume was normalized by the mean value of the nonzero region. The top and bottom 20 slices, which usually did not cover the brain, were removed. To avoid overfitting, data augmentation of flipping along the X and Y axes was adopted. Fourfold validation was adopted to obtain synthesized results for each dataset. Figure 1 represents the pipeline for data preprocessing from the standard‐dose raw list‐mode PET to the paired standard‐dose and low‐dose images for training and testing. We used the FreeSurfer to obtain the segmentation masks of temporal cortex for the region‐specific evaluation in experiments.
Figure 1.

Pipeline for data preprocessing. [Color figure can be viewed at wileyonlinelibrary.com]
2.B. Network structure and objective function
The architecture of the proposed method is shown in Fig. 2, consisting of the following three blocks: the generator , the discriminator , and a pretrained amyloid status classifier . The input of the network is the stack of nine neighboring slices from the low‐dose PET images, as using only a single low‐dose image as input may not provide enough information to reconstruct some detailed structures and may also cause noise and generate hallucinated structures. As shown in Xu et al,8 using multi‐slice inputs instead of a single‐slice input can help to improve the image quality. The proposed method stacks neighboring slices together as different channels of the input to provide the network with 2.5D structural information between different slices, helping the network distinguish random noise from actual morphology of the subject.
Figure 2.
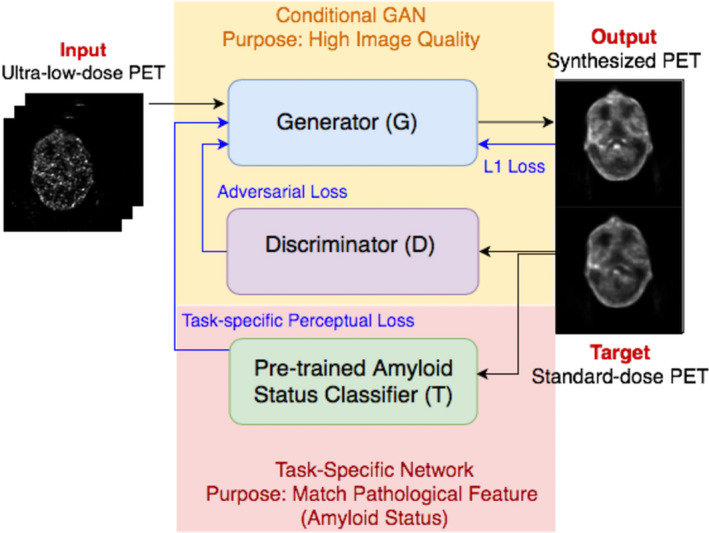
Architecture of the proposed method. [Color figure can be viewed at wileyonlinelibrary.com]
The generator is an encoder‐decoder U‐Net structure, in which each stage consists of either convolution or de‐convolution layers with kernel size of 4 × 4 and stride size of 2 × 2 (Conv), a leaky rectified linear unit with leaky ratio of 0.2 (Leaky ReLU), and batch normalization (BN). Concatenate connections are linked between the corresponding layers of the encoder and decoder. SoftPlus activation function is used for the output layer to match the value range of the target image. The discriminator is a classifier that consists of four stages of Conv‐Leaky ReLU‐BN. The network is trained by the Adam optimizer with a learning rate of 0.0002 and a batch size of 4 over 100 epochs. The generator is trained twice while the discriminator is trained once to keep the balance between the two components. The pretrained network is a classifier with ResNet‐18 structure20 that is trained for the amyloid status regression on the standard‐dose images with an early stop strategy. In training and testing of the GAN, acts merely as a feature extractor without updating the parameters.
The optimization loss consists of three parts, namely: pixel‐wise loss, structured adversarial loss by feature matching, and the task‐specific perceptual loss including content loss and style loss . Thus, the objective function for training the generator can be written as:
| (1) |
The appropriate for each type of loss and each layer needs to be chosen. , and were selected to allow each layer in the discriminator or the task‐specific network to have relatively the same scale of influence on the loss. Here, we chose for i = 1,2,3 and , . The weight of each type of loss was chosen as: , , and .
3. Theory
3.A. Adversarial learning
As proposed in Isola et al,10 adversarial learning can be used for transferring images between two domains with the compensation of structured loss. Here, GAN is introduced to transfer the input low‐dose PET image with a random noise vector to the corresponding target standard‐dose PET . Comparing with Chen et al.'s method, which only used a encoder‐decoder structure as Generator for image synthesis, a discriminator is added to serve as a classifier to judge the output image from the generator of whether it is real or fake. To ensure that also evaluates whether synthesizes images with corresponding features from the input, the input low‐dose images are stacked with the output or target to feed into . To make the generator and the discriminator compete with each other and improve simultaneously, the adversarial loss representing the loss of the discriminator's output can be written as:
| (2) |
Here, represents the synthesized image from , and stand for the digit outputs of for real and fake images, respectively, and indicates the mathematical expectation. The adversarial learning enables the network to synthesize images with more realistic features. However, using only the adversarial loss cannot ensure that the synthesized image shares a similar global structure with the standard‐dose image, thus a pixel‐wise loss is included:
| (3) |
The final objective that the training process optimizes is the combination of the two losses:
| (4) |
One thing of note is that, in image‐to‐image conditional GAN, whether adding the noise vector or not will not explicitly effect the results, because the input image itself already contains enough variance.10 Hence, we did not explicitly add in our implementation.
3.B. Feature‐matching technique
As stated in Salimans et al,21 GANs generally face the problem of instability in training, as simply providing the true or fake label by the discriminator is not enough for the generator to improve. In addition, hallucinated structures are produced during the oscillating training process.
Feature matching was introduced here to address the problems by specifying a new objective for the generator, requiring the generator to synthesize images that match the expected value of the features on the intermediate layers of the discriminator, instead of directly maximizing the output of the discriminator. The new adversarial loss can be written as:
| (5) |
denotes the activation on an intermediate layer of the discriminator and represents the size of the layer. The feature matching adversarial loss is used as the substitute of the original adversarial loss in training the generator. The discriminator is trained in the usual way.
3.C. Task‐specific perceptual loss
With the learning strategies above, the network can synthesize images of high‐visual quality that are consistent with the realistic distribution of the standard‐dose PET, but not necessarily with matched clinical interpretations, which in our case would be either a positive or negative amyloid uptake status.
Combining perceptual loss16 into the GAN architecture was shown to be useful in improving the synthesized image quality.14, 15 However, the widely used pretrained VGG22 on ImageNet will not solve the problem as stated above, as it merely captures the features of natural images. Here, we first trained an extra network for amyloid status regression and then use the pretrained network to extract the task‐specific perceptual loss.
3.C.1. Amyloid status classifier
In this work, we trained a network () to accurately predict the amyloid status as positive (1) or negative (0). For the ground‐truth label, two expert radiologists were asked to read the amyloid status on the standard‐dose PET images for all 40 datasets. For the cases that were ambiguous (disagreement between the two radiologists), an amyloid status value of 0.5 was assigned. Subsequently, the network was trained using a regression strategy, optimizing loss, instead of the simple binary cross entropy, for classification. Data augmentation including flipping along the X and Y axes was implemented. The top and bottom 20 slices were also removed as they did not include the supratentorial brain, and thus contained less information on amyloid status.
For the task‐specific network, we implemented ResNet‐18 and trained it from scratch, as residual learning had been shown to have superior performance on computer vision tasks such as classification and detection.20 Fourfold cross‐validation was also adopted here with the corresponding training and testing splits in GAN.
3.C.2. Extracting task‐specific perceptual loss
Perceptual loss is usually combined with GAN for better image synthesis quality, to ensure that images are generated with the correct features.14, 15
The perceptual loss has the following two parts: content loss and style loss. Similar to feature matching, we encourage the synthesized image to match the target image by forcing them to have similar feature representations. The content loss can be represented by the Euclidean distance between feature representations:
| (6) |
and stand for the feature maps from the layer in the network for the ground‐truth image and the synthesized image, respectively. stands for its size. With the content loss, we encouraged the synthesized image to be perceptually similar on the pathological features to the ground‐truth standard‐dose image , but did not force them to match exactly.
Aside from the content loss, differences in style (image textures and pathological patterns) would still have to be penalized. Here, the style loss is introduced. We first define the Gram matrix for layer in the network ; m and n denote the index for a specific channel in that layer:
| (7) |
According to Johnson et al,16 the Gram matrix for a layer can be computed efficiently by reshaping into a matrix of shape :
| (8) |
Then, the style loss can be represented by the difference between the Gram matrix of the synthesized image and the ground‐truth image:
| (9) |
We can interpret it this way: each layer of the network extracts different levels of features and each channel in a layer extracts different types of features from the same level. The Gram matrix learns the style of the image by projecting the feature maps from the same layer to a higher dimensional space, so that the stylistic features are preserved rather than the spatial structure. Then the style loss is computed by comparing the difference between the synthesized image and the ground‐truth image in this space.
A pretrained VGG16 or VGG19 on ImageNet is usually used as the feature extractor for content loss and style loss. However, the pretrained model on a natural dataset like ImageNet with no prior knowledge on the task does not meet the requirement of extracting the right pathological features. By using the pretrained amyloid status classifier, we get a task‐specific feature extractor that specifically focuses on extracting amyloid status‐related features.
3.D. Evaluation method
The synthesized image quality was assessed by three metrics, namely: peak signal‐to‐noise ratio (PSNR), structural similarity (SSIM), and root mean square error (RMSE). These metrics were also measured in the temporal cortex for region‐specific analysis. Frequency‐based blurring measurement (FBM)23 and edge‐based blurring measurement (EBM)24 were used to measure the sharpness of the image structures. The statistics for each slice (with the top and bottom 20 slices removed) were averaged to obtain the metrics for each dataset.
Readings of image quality and amyloid status diagnosis were included for clinical assessment. The low‐dose PET, standard‐dose PET, and the synthesized PET images of each subject were anonymized and read in random order by two certified clinicians (one radiologist and one nuclear medicine physician), who also performed the same readings on images generated from Chen et al.'s method9 to make the results comparable. The readers gave each volume a score from 1 to 5 for the image quality. We considered 1‐3 as low quality and 4‐5 as high quality. The readers also gave amyloid status diagnoses (positive or negative) for each volume. The consistency between their diagnosis on the standard‐dose ground‐truth and the synthesized images shows how well the method can maintain the pathological features. For both tasks, the readers were asked to read the standard‐dose PET twice to determine intra‐reader reproducibility.
4. Results
In the experiments, we took Chen et al.'s 2D U‐Net PET‐only model9 as the baseline model, gradually adding each module/technique introduced above and comparing the results. Here we also show specifically the contribution of the task‐specific perceptual loss; results for the contribution from other components and the weight selection for loss can be seen in the supplementary file and Figs. [Link], [Link], [Link], [Link], [Link], [Link], [Link], [Link]. Finally, we compared the best version of the proposed method with Chen et al.'s models.
4.A. Contribution of task‐specific perceptual loss
Task‐specific perceptual loss was computed by the feature maps extracted from the task‐specific network to ensure the consistency of the pathological features shown in the synthesized and standard‐dose images. To evaluate the contribution of the task‐specific perceptual loss, on the top of the model with nine‐slice input, loss, and feature matching loss, we compared the results of no perceptual loss, adding perceptual loss computed by the widely used pretrained VGG16 on ImageNet, and adding perceptual loss computed by the pretrained amyloid status classifier. Results are shown in Figs. 3 and 4.
Figure 3.
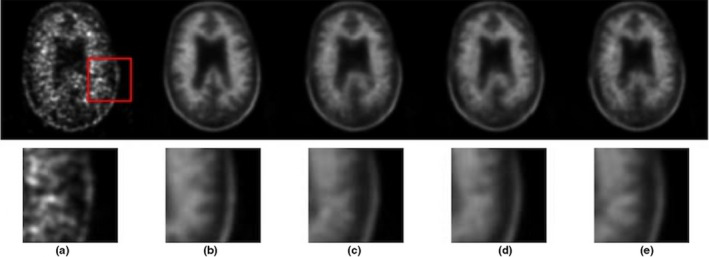
Qualitative results of the model without perceptual loss and with perceptual loss computed from either VGG16 or a task‐specific network. (a) low‐dose PET, (b) standard‐dose PET, (c) no perceptual loss, (d) perceptual loss from VGG16, (e) perceptual loss from pretrained amyloid status classifier (task‐specific). PET, Positron emission tomography. [Color figure can be viewed at wileyonlinelibrary.com]
Figure 4.
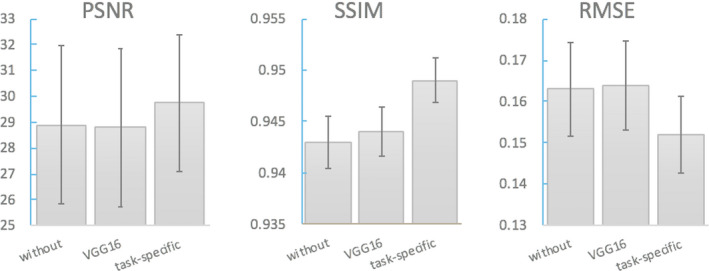
Image quality metrics: PSNR, SSIM, RMSE of models without perceptual loss and with perceptual loss computed from either VGG16 or a task‐specific network. PSNR, peak signal‐to‐noise ratio; RMSE, root mean square error; SSIM, structural similarity. [Color figure can be viewed at wileyonlinelibrary.com]
4.B. Comparing with Chen et al.'s method
We compared our proposed best model (nine‐slices input with loss, feature matching adversarial loss, and perceptual loss extracted by pretrained amyloid status classifier) against Chen et al.'s method9 using single‐slice input and loss. The proposed method and Chen et al.'s PET‐only model used only the ultra‐low‐dose PET as input, while Chen et al.'s PET‐MR model also incorporated MRI inputs (T1‐, T2‐, and T2 FLAIR‐weighted images).
To examine the perceptual image quality, two representative slices were selected from different subjects. As shown in Figs. 5 and 6., comparing to Chen et al.'s PET‐only model, the synthesized images from the proposed method maintained more structural details and were visually more similar to the ground‐truth standard‐dose PET.
Figure 5.
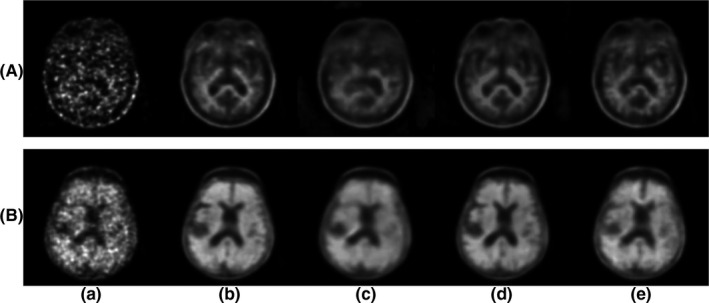
Qualitative results comparing Chen et al.'s and the proposed method. (a) low‐dose PET, (b) standard‐dose PET, (c) Chen et al.'s PET‐only model, (d) Chen et al.'s PET‐MR model, (e) proposed method (PET‐only). PET, Positron emission tomography.
Figure 6.
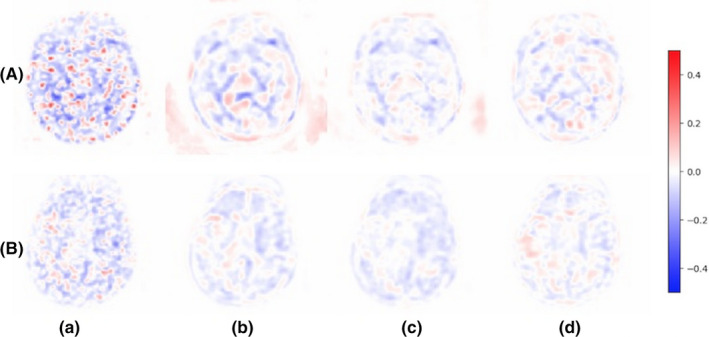
Error maps of figure 5. (a) low‐dose PET, (b) Chen et al.'s PET‐only model, (c) Chen et al.'s PET‐MR model, (d) proposed method (PET‐only). PET, Positron emission tomography. [Color figure can be viewed at wileyonlinelibrary.com]
Quantitatively, Fig. 7 shows the average performance in terms of PSNR, SSIM, and RMSE. The proposed method on average increased 4.14 dB in PSNR, 7.63% in SSIM, and decreased 33.55% in RMSE from low‐dose PET images and outperformed Chen et al.'s PET‐only model by 1.87 dB in PSNR, 2.04% in SSIM, and 24.75% in RMSE. Among all 40 cases, the proposed method achieved better performance than Chen et al.'s PET‐only model in all three metrics. The proposed method also achieved comparable performance with Chen et al.'s PET‐MR model. Region‐specific measurements are shown in Fig. 8.
Figure 7.
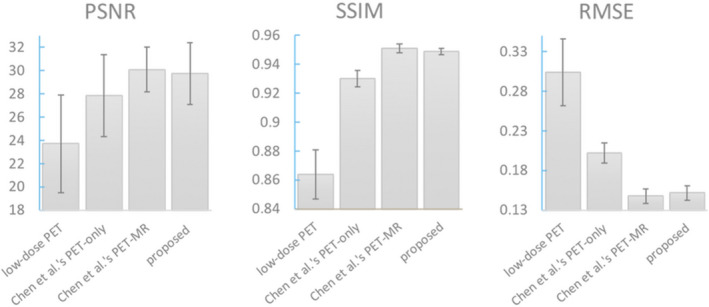
Image metrics comparing Chen et al.'s and the proposed method. [Color figure can be viewed at wileyonlinelibrary.com]
Figure 8.
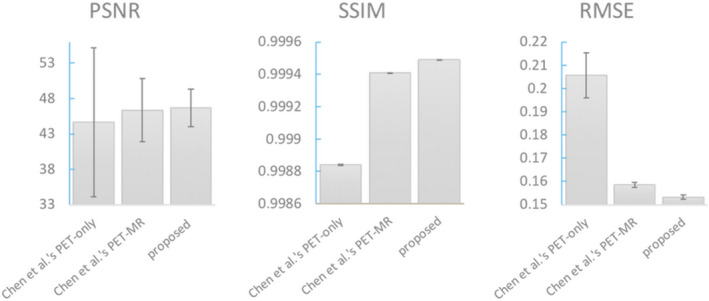
Image metrics comparing Chen et al.'s and the proposed method on temporal cortex area. [Color figure can be viewed at wileyonlinelibrary.com]
For the image quality readings, Fig. 9 shows the distribution of image quality scores for the low‐dose, standard‐dose, and the synthesized images from Chen et al.'s PET‐only model, PET‐MR model, and the proposed method. Scores for all the low‐dose PET images were either 1 or 2 (average score 1.30). The standard‐dose ground‐truth images had an average score of 4.41 with only four cases out of all 80 evaluations (40 cases read independently by two radiologists) considered as low‐image quality. The results from the proposed method had an average of 4.27 with only five low‐quality scores, comparable to the ground‐truth and far outperforming Chen et al.'s method PET‐only model (average score 3.22 with 56 low‐quality scores) and PET‐MR model (average score 4.02 with 12 low‐quality scores). The confusion matrix for inter‐reader agreement of the image quality score is shown in Table S1.
Figure 9.
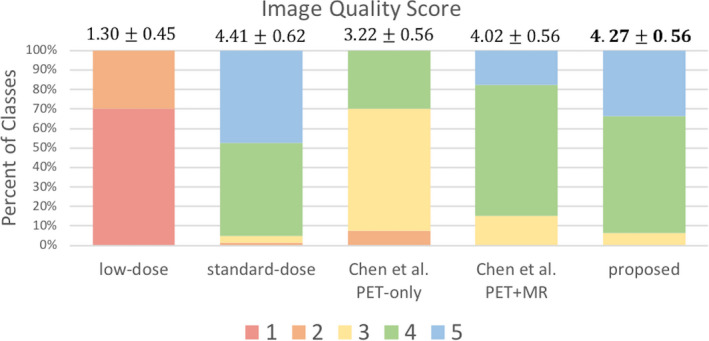
Image quality score given by two physicians comparing Chen et al.'s and the proposed method. 1 = uninterpretable, 5 = excellent. Mean scores and the standard deviations shown at the top of each bar. [Color figure can be viewed at wileyonlinelibrary.com]
For the amyloid status diagnosis, Tables 1, 2, 3 show the confusion matrices for the radiologists' reading results, comparing readings from the synthesized images to the readings from the standard‐dose ground‐truth images. The proposed method achieved an error rate of only 10%, in contrast to Chen et al.'s PET‐only model (20%) and PET‐MR model (11.25%). We can see that with Chen et al.'s PET‐only model, the clinicians tended to classify amyloid negative as positive because in the synthesized images, features were smeared out among the cerebral cortex area, misleading them on whether there is true cortical tracer deposition, while the proposed method significantly increased the diagnosis specificity. An example is shown in Fig. 5, where the upper image is a representative slice from a negative case, which was read as positive based on Chen et al.'s PET‐only model but read correctly based on the proposed method. The confusion matrix for inter‐reader agreement of the amyloid status is shown in Table S2.
Table 1.
Confusion matrix between the standard‐dose and the synthesized images from the proposed method
| Confusion Matrix | Proposed Method | ||
|---|---|---|---|
| N | P | total | |
| Standard‐dose PET | |||
| N | 50 | 7 | 57 |
| P | 1 | 22 | 23 |
| total | 51 | 29 | 80 |
PET, Positron emission tomography.
Table 2.
Confusion matrix between the standard‐dose and the synthesized images from the Chen et al.’s PET‐only model
| Confusion Matrix | Chen et al.’s PET‐only model | ||
|---|---|---|---|
| N | P | total | |
| Standard‐dose PET | |||
| N | 46 | 11 | 57 |
| P | 3 | 20 | 23 |
| total | 49 | 33 | 80 |
PET, Positron emission tomography.
Table 3.
Confusion matrix between the standard‐dose and the synthesized images from the Chen et al.’s PET‐MR model
| Confusion Matrix | Chen et al.’s PET‐MR model | ||
|---|---|---|---|
| N | P | total | |
| Standard‐dose PET | |||
| N | 49 | 8 | 57 |
| P | 1 | 22 | 23 |
| total | 50 | 30 | 80 |
PET, Positron emission tomography.
Here, we also compared the diagnosis accuracy between the clinical readers and the amyloid status classifier (the pretrained task‐specific network ), which is shown in Table 4. The error rate of the clinicians is subject‐wise, as they decided the amyloid status based on the whole 3D volume. The error of the classifier is measured slice‐wise, as it is a 2D network. The classifier will give each slice a score from 0 to 1 as its amyloid status prediction. The error for each slice is the mean absolute error (MAE) between the prediction and the average status label given by the two clinicians. Based on the classification results on the middle 20 slices of the volume, the subject‐wise error rate is computed by voting and following the majority rule. Considering the subject‐wise accuracy, the classifier makes no mistakes on standard‐dose and both sets of results from the proposed and Chen et al.'s methods, largely outperforming the human experts' error rate of 8 and 16 over 80 judgements, respectively.
Table 4.
Comparison of the error rate of clinicians and the amyloid status classifier
| Standard‐dose PET | Chen et al.’s PET‐only | Chen et al.’s PET‐MR | Proposed method | |
|---|---|---|---|---|
|
Clinicians Subject‐wise error/all cases |
Ground‐truth | 16/80 | 9/80 | 8/80 |
| Amyloid status classifier | 0.136 | 0.140 | 0.134 | 0.132 |
| Slice‐wise MAE (subject‐wise error) | (0/40) | (0/40) | (0/40) | (0/40) |
PET, Positron emission tomography.
5. Discussion
We trained a GAN‐based network with feature matching, and a task‐specific network to synthesize the standard‐dose amyloid PET images with only 1% dose images. We obtained results that were superior than Chen et al.'s model both quantitatively and based on clinical interpretation.
5.A. Benefits of each component
The adversarial learning generates less blurry image with more details. Feature matching suppresses the possible hallucinated structures caused by the adversarial learning to ensure the high image quality. Stacking neighboring slices provides the network with 2.5D information to suppress the random noise and artifacts while keeping the detailed structures. The task‐specific network ensured the consistency in pathological features (amyloid status). Specific benefits of this task‐specific network with its perceptual loss are discussed in the following; detailed analyses of other components can be found in the supplementary file.
As indicated on Figs. 3 and 4. adding perceptual loss based on the ImageNet pretrained VGG16 did not have an obvious contribution to the image quality, as the features extracted by the VGG16 are related to natural image properties but with no specific emphasis on the pathological imaging features. On the contrary, the pretrained task‐specific network learned features that were most salient to amyloid status, thus adding the perceptual loss through this network could ensure the consistency of the amyloid status between the standard‐dose ground‐truth and the synthesized images. From visual results shown in Fig. 3, the enhancement of features related to the amyloid status can be noticed in the cerebral cortex area.
5.B. Comparison with Chen et al.'s method
The proposed method shows superior performance on all evaluation methods, including the image metrics and clinical readings on image quality score and amyloid status. Figure 7 indicates that based on the low‐dose input, with its inferior signal‐to‐noise ratio and structural similarity, the proposed method can synthesize images that are most similar to the ground‐truth. Region‐specific measurements illustrate the same results in Fig. 8. As the amyloid retention in cerebral cortex area is a biomarker required for a diagnosis of AD3, 4 and the temporal lobe is most related with memory,25 we conducted the regional experiments in the temporal cortex area. The synthesized images also demonstrated comparable image quality with the standard‐dose PET based on the quality scores. In addition, the diagnostic value shows high accuracy, sensitivity, and specificity for amyloid status compared to Chen et al.'s method. Chen et al.'s results had a significantly higher false positive rate possibly due to the smoothing effect from activity originally in the white matter bleeding into the adjacent cortical regions; this is mitigated by the proposed method with less blurry images and more detailed structures.
5.C. Clinical value
Ultra‐low‐dose PET acquisitions would be advantageous for many reasons. They would allow for more frequent scanning under current radiation safety standards. They would also reduce the cost of radiotracers and extend the geographical range over which radiotracers could be provided. On the other hand, reducing the scan time (also reducing the amount of counts collected in a scan) can allow for increasing the throughput of subjects scanned at an institution, alleviating wait‐times for scans at busy centers. Moreover, certain patient populations who may be more susceptible to radiation risk (e.g., pediatric patients) can also be scanned under a low‐dose PET acquisition protocol, expanding use cases. Finally, PET/CT scanners are much more common than PET/MRI scanners. The proposed method is compatible with these scanners, broadening the potential application of ultra‐low‐dose imaging.
5.D. Limitation and future work
There are several limitations to our study. First, the low‐dose data we used were randomly undersampled from the standard‐dose PET, instead of using data with true injected 1% dose. The method should be further evaluated with the actual ultra‐low‐dose acquisition, and these studies are ongoing. Second, the normalization method we used was dividing the volume with its mean in the nonzero area, which ignored the absolute value of the original PET images. It might be improved by using physiologically relevant values such as the standard uptake value (SUV) for normalization, although clinical interpretation is often based on relative values (such as the SUV ratio compared to a region‐of‐interest in the cerebellum) rather than relying on the absolute quantitative value. Third, the model we implemented is 2.5D due to the limited number of datasets available. The results are likely to be improved by using a 3D CNN model, though this will increase the computational requirements.
For future work, MR contrasts can be added as input to the model to see whether the additional structural information can help further improve the reconstruction.
6. Conclusion
In this paper, we proposed a GAN‐based deep network with task‐specific perceptual loss to synthesize high quality and diagnostic amyloid PET images using only 1% low‐dose PET as input. Based on Chen et al.'s method using U‐Net with loss, adversarial learning is added to mitigate the blurring and maintain more morphological detail. Feature matching is used to suppress the hallucinated structures from the adversarial learning. Task‐specific perceptual loss is computed from the pretrained amyloid status classifier to ensure the consistency of the pathological features between the standard‐dose ground‐truth and the synthesized images. Results showed significant improvement on image quality and diagnosis consistency compared to Chen et al.'s method.
Conflict of interest
The authors declare that there are no conflicts of interest related to this article.
Supporting information
Fig. S1. Qualitative results of the model with adversarial learning. (a) low‐dose PET, (b) standard‐dose PET, (c) single‐slice+L1 model (Chen et al.'s PET‐only model), (d) single‐slice+L1+GAN model.
Fig. S2. Image quality metrics: PSNR, SSIM, RMSE. 2D U‐Net is single‐slice+L1 model. 2D GAN is single‐slice+L1+GAN model.
Fig. S3. Qualitative results of the model with multi‐slice input. (a) low‐dose PET, (b) standard‐dose PET, (c) single‐slice+L1+GAN model, (d) five‐slice+L1+GAN model, (e) nine‐slice+L1+GAN model.
Fig. S4. Image quality metrics: PSNR, SSIM, RMSE of models with different input stack slices.
Fig. S5. Qualitative results of the model with and without feature matching. (a) low‐dose PET, (b) standard‐dose PET, (c) nine‐slice+L1+GAN model, (d) none‐slice+L1+GAN+feat model.
Fig. S6. Image quality metrics: PSNR, SSIM, RMSE of models with and without feature matching.
Fig. S7. Qualitative results of the model with different λ 1. (a) low‐dose PET, (b) standard‐dose PET, (c) λ 1 = 50, (d) λ 1 = 100, (e) λ 1 = 200.
Fig. S8. Image quality metrics: PSNR, SSIM, RMSE of models with different weight for λ 1.
Table S1. Confusion matrix for inter‐reader agreement of the image quality score (5=excellent) for the standard‐dose PET [9]. The tau‐b statistic was 0.798 (p < 0.001), Krippendorff's alpha was 0.867 (95% CI 0.814‐0.904), and the p=0.494 for the symmetry test. This shows that the readers agreed strongly on scoring and did not systemically over‐ or under‐call scores with respect to each other.
Table S2. Confusion matrix for inter‐reader agreement of the diagnosis of amyloid status on standard‐dose images.
Supinfo. Analysis of supplementary figures and tables. Contribution of each component, weight selection for L1 loss, inter‐reader agreement.
Acknowledgments
This project was made possible by the NIH grants P41‐EB015891 and P50‐AG047366, GE Healthcare, the Michael J. Fox Foundation for Parkinson’s Disease Research, the Foundation of the American Society of Neuroradiology, the Stanford Alzheimer's Disease Research Core, the Stanford Human‐Centered Artificial Intelligence Center, and Life Molecular Imaging.
References
- 1. Ono K, Ochiai R, Yoshida T, et al. The detection rates and tumor clinical/pathological stages of whole‐body FDG‐PET cancer screening. Ann Nucl Med. 2007;21:65–72. [DOI] [PubMed] [Google Scholar]
- 2. Herholz K, Salmon E, Perani D, et al. Discrimination between Alzheimer dementia and controls by automated analysis of multicenter FDG PET. NeuroImage. 2002;17:302–316. [DOI] [PubMed] [Google Scholar]
- 3. Berti V, Pupi A, Mosconi L. PET/CT in diagnosis of dementia. Ann N Y Acad Sci. 2011;1228:81–92. [DOI] [PMC free article] [PubMed] [Google Scholar]
- 4. Sevigny J, Chiao P, Bussiere T, et al. The antibody aducanumab reduces Abeta plaques in Alzheimer's disease. Nature. 2016;537:50–6. [DOI] [PubMed] [Google Scholar]
- 5. Directorate‐General, Environment, Nuclear Safety and Civil Protection, European Commission . Safety and Civil Protection, European Commission. Radiation protection 109: guidance on diagnostic reference levels (DRLs) for medical exposures (radiation protection). 1999.
- 6. Gatidis S, Wurslin C, Seith F, et al. Towards tracer dose reduction in PET studies: Simulation of dose reduction by retrospective randomized undersampling of list‐mode data. Hell J Nucl Med. 2016;19:15–8. [DOI] [PubMed] [Google Scholar]
- 7. Kaplan S, Zhu YM. Full‐dose pet image estimation from low‐dose pet image using deep learning: a pilot study. J Digit Imaging. 2018;1–6. 10.1007/s10278-018-0150-3 [DOI] [PMC free article] [PubMed] [Google Scholar]
- 8. Xu J, Gong E, Pauly J, Zaharchuk G.200x Low‐dose PET Reconstruction using Deep Learning. CoRR, arXiv: 1712.04119, 2017. [Online]. Available: https://arxiv.org/abs/1712.04119.
- 9. Chen K, Gong E, Macruz F, et al. Ultra‐low‐dose 18F‐florbetaben amyloid PET imaging using deep learning with multi‐contrast MRI inputs. Radiology. 2018;290, 649–656. [DOI] [PMC free article] [PubMed] [Google Scholar]
- 10. Isola P, Zhu J, Zhou T, Efros A. Image‐ to‐image translation with conditional adversarial networks. CVPR. 2016.
- 11. Goodfellow I, Pouget‐Abadie J, Mirza M, et al. Generative adversarial nets. NIPS. 2014. [Google Scholar]
- 12. Ben‐Cohen A, Klang E, Raskin S, et al.Cross‐modality synthesis from CT to PET using FCN and GAN networks for improved automated lesion detection. CoRR, vol. abs/1802.07846, 2018. [Online]. Available: http://arxiv. org/abs/1802.07846.
- 13. Nie D, Trullo R, Lian J, et al. Medical image synthesis with deep convolutional adversarial networks. IEEE Trans Bio‐Med Eng. 2018;65:2720–2730. [DOI] [PMC free article] [PubMed] [Google Scholar]
- 14. Armanious K, Yang C, Fischer M, et al. Medical Image Translation using GANs. CoRR. CoRR, arXiv:1806.06397, 2018. [Online]. Available: https://arxiv.org/abs/1806.06397
- 15. Yang Q, Yan P, Zhang Y, et al. Low‐dose CT image denoising using a generative adversarial network with wasserstein distance and perceptual loss. IEEE Trans Med Imaging. 2018;37:1348–1357. [DOI] [PMC free article] [PubMed] [Google Scholar]
- 16. Johnson J, Alahi A, Li F. Perceptual losses for real‐time style transfer and super‐resolution. ECCV. 2016. [Google Scholar]
- 17. Stearns C, et al. Random coincidence estimation from single event rates on the Discovery ST PET/CT scanner. IEEE Nuclear Science Symposium Conference Record. 2003;3067–3069. [Google Scholar]
- 18. Latrou M, Manjeshwar RM, Ross SG, Thielemans K, Stearns. 3D implementation of scatter estimation in 3D PET. IEEE Nuclear Science Symposium Conference Record. 2006;4:2142–2145. 10.1109/NSSMIC.2006.354338 [DOI] [Google Scholar]
- 19. Iagaru A, et al. Simultaneous whole‐body time‐of‐flight 18F‐FDG PET/MRI: a pilot study comparing SUVmax with PET/CT and assessment of MR image quality. ClinNucl Med. 2015;40:1–8. [DOI] [PMC free article] [PubMed] [Google Scholar]
- 20. He K, Zhang X, Ren S, Sun J. Deep residual learning for image recognition. CVPR. 2016. [Google Scholar]
- 21. Salimans T, Goodfellow I, Zaremba W, et al. Improved techniques for training GANs. CoRR, arXiv: 1606.03498, 2016. [Online]. Available: https://arxiv.org/abs/1606.03498.
- 22. Simonyan K, Zisserman A. Very deep convolutional networks for large‐scale image recognition. arXiv 1409.1556. 2014.
- 23. De K, Masilamani V. Image sharpness measure for blurred images in frequency domain. IConDM. 2013.
- 24. Wang X, Tian B, Liang C, Shi D. Blind image quality assessment for measuring image blur. Congress on Image and Signal Processing. Sanya, Hainan; 2008. 467–470. 10.1109/CISP.2008.371 [DOI] [Google Scholar]
- 25. Squire LR, Morgan S. The medial temporal lobe memory system. Science. 1991;253:1380–1386. [DOI] [PubMed] [Google Scholar]
Associated Data
This section collects any data citations, data availability statements, or supplementary materials included in this article.
Supplementary Materials
Fig. S1. Qualitative results of the model with adversarial learning. (a) low‐dose PET, (b) standard‐dose PET, (c) single‐slice+L1 model (Chen et al.'s PET‐only model), (d) single‐slice+L1+GAN model.
Fig. S2. Image quality metrics: PSNR, SSIM, RMSE. 2D U‐Net is single‐slice+L1 model. 2D GAN is single‐slice+L1+GAN model.
Fig. S3. Qualitative results of the model with multi‐slice input. (a) low‐dose PET, (b) standard‐dose PET, (c) single‐slice+L1+GAN model, (d) five‐slice+L1+GAN model, (e) nine‐slice+L1+GAN model.
Fig. S4. Image quality metrics: PSNR, SSIM, RMSE of models with different input stack slices.
Fig. S5. Qualitative results of the model with and without feature matching. (a) low‐dose PET, (b) standard‐dose PET, (c) nine‐slice+L1+GAN model, (d) none‐slice+L1+GAN+feat model.
Fig. S6. Image quality metrics: PSNR, SSIM, RMSE of models with and without feature matching.
Fig. S7. Qualitative results of the model with different λ 1. (a) low‐dose PET, (b) standard‐dose PET, (c) λ 1 = 50, (d) λ 1 = 100, (e) λ 1 = 200.
Fig. S8. Image quality metrics: PSNR, SSIM, RMSE of models with different weight for λ 1.
Table S1. Confusion matrix for inter‐reader agreement of the image quality score (5=excellent) for the standard‐dose PET [9]. The tau‐b statistic was 0.798 (p < 0.001), Krippendorff's alpha was 0.867 (95% CI 0.814‐0.904), and the p=0.494 for the symmetry test. This shows that the readers agreed strongly on scoring and did not systemically over‐ or under‐call scores with respect to each other.
Table S2. Confusion matrix for inter‐reader agreement of the diagnosis of amyloid status on standard‐dose images.
Supinfo. Analysis of supplementary figures and tables. Contribution of each component, weight selection for L1 loss, inter‐reader agreement.


