Abstract
Triple-point-of-succinonitrile cells have been tested and established as Standard Reference Material (SRM) 1970. Of the 115 cells tested, 109 were accepted as SRM 1970. Five of the 115 cells had triple-point temperatures lower than 58.0785 °C (the low-temperature limit established for SRM 1970) and, consequently, were rejected. One of the 115 cells broke during tests on it. The mean value of the triple-point temperatures (obtained by freezing) of the 109 cells is 58.0796±0.0015 °C, where the uncertainty is the total estimated uncertainty relative to the International Practical Temperature Scale of 1968, Amended Edition of 1975. The standard deviation of the triple-point temperatures is 0.48 mK. The purity of the succinonitrile of the SRM 1970 cells is estimated to range from 99.999,97% to 99.999,84%. The preparation of the cells, the various tests performed on them, and the procedure recommended for their use are described.
Keywords: SRM 1970, standard reference materials, succinonitrile, thermometry, temperature fixed point
1. Introduction
Accurate temperature measurements and control are necessary for many tests conducted in clinical and biomedical laboratories in order to obtain accurate and meaningful results which form the basis for the diagnosis and treatment of diseases. Temperature fixed points at temperature values near those at which specific tests are conducted can be used as the reference temperatures for those tests. This simplifies temperature measurements and significantly improves the precision and accuracy of clinical measurements and results.
The calibration of thermometers is performed, either directly or indirectly, through the use of temperature fixed points. Because temperature fixed points provide reproducible environments, they have been the basis for practical temperature scales, such as the International Practical Temperature Scale of 1968, Amended Edition of 1975 (IPTS-68(75) [1]1, and they are used in the calibration of thermometers on those scales. In addition to the defining fixed points of the scales, there are other equilibrium states which are internationally recognized as secondary reference points [2], Those points may be used for calibration of thermometers which do not operate over the entire range of the defining fixed points of the IPTS-68(75) and when a comparison calibration against a primary standard is not practicable. The feasibility of the use of the triple-point temperature of succinonitrile (SCN) as a temperature reference point near 58.08 °C has been investigated [3,4,5] and the quality of this fixed point has been found to be very high, the point containing most of the features desired in a fixed point.
Based on the previous work [4,5], we have developed an SCN triple-point Standard Reference Material (SRM). It is designated SRM 1970—the Succinonitrile Triple-Point Standard, and it is available from the Office of Standard Reference Materials (OSRM) of the National Bureau of Standards (NBS). These SRM devices are easy to use and with them one can confidently expect to achieve a calibration point with an uncertainty no greater than ±0.0015 K.
The remainder of this publication describes SRM 1970, the tests performed on the cells of SCN, the conditions under which the cells were tested, the results obtained from testing 109 SRM 1970 cells, and the procedure recommended for using the cells for calibration of thermometers.
2. Experimental Details
2.1. Preparation of SCN Triple-Point Cells
a). Cell Design
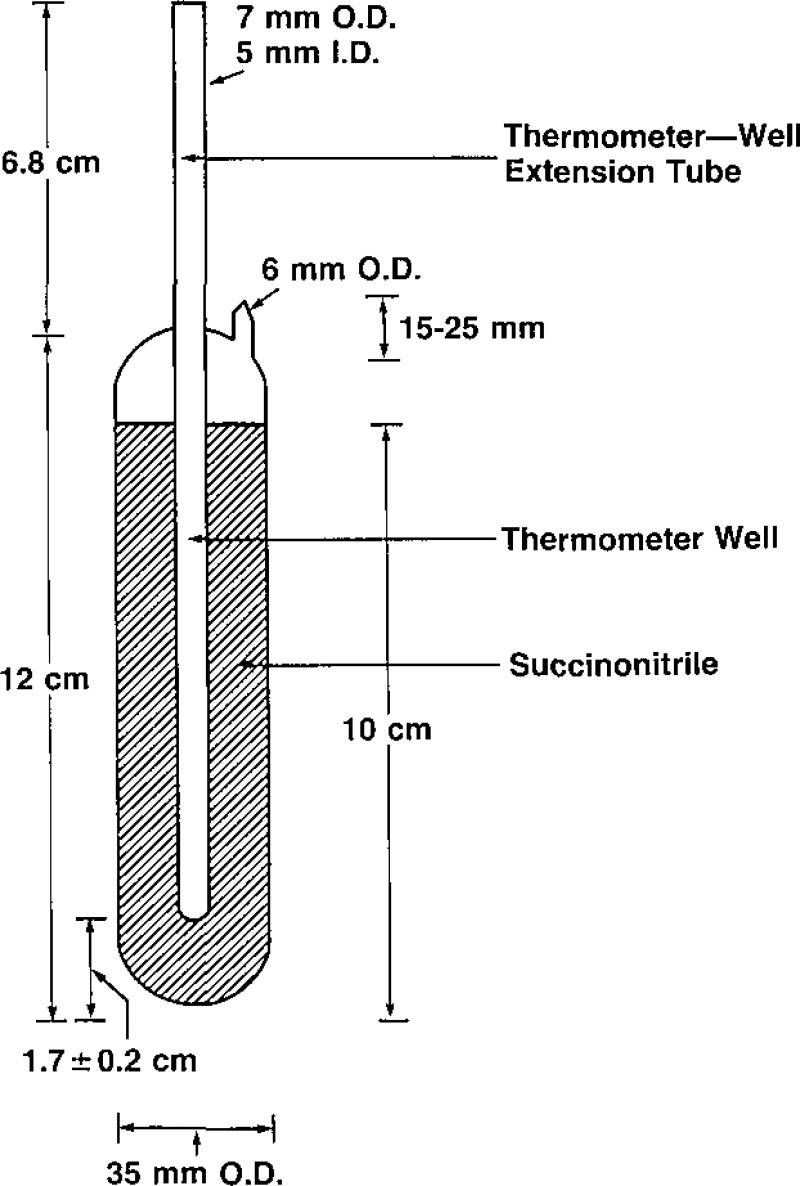
Previous experience [4,5] with SCN led to the design shown in figure 1 for the triple-point cells constituting SRM 1970, These cells, sealed under vacuum, contain approximately 60 grams of high-purity SCN and are designed to be used with small thermometers, those not exceeding 4.5 mm (0.180 inches) in diameter. The thermometer well of a cell will accommodate most precision thermistor thermometers, many platinum resistance thermometers, and most diode thermometers.
Figure 1–
Cross-sectional drawing of the succinonitrile triple-point cell.
b). Purification of SCN and Filling of the Triple-Point Cells
The SCN used for SRM 1970 was purified by the zone-refining technique by Prof. M. E. Glicksman and his students at Rensselaer Polytechnic Institute. The apparatus used for the zone-refining was a modified version of that described previously by M. E. Glicksman et al. [3].
Three pyrex cells were attached to the zone-refining tube of the second stage of refining so that three cells could be prepared from the purest half of the purified material of that second stage. Each of the two stages of purification consisted of at least 20 passes through the 6 zones of the zone-refining furnace. This amount of purification had been determined previously by one of us (BWM) [6] to be the minimum required if three cells were to be routinely obtained from each zone-refined lot. During the early part of the second stage of zone-refining, the three pyrex cells were washed several times with the purified SCN.
2.2. Testing of SCN Triple-Point Cells for SRM 1970
Using the inner-sheath technique, the freezing behaviors of 115 cells were studied in a well-stirred constant- tempeature oil bath maintained at 56.880 °C. Some preliminary tests were made prior to testing the cells to determine the optimum bath temperature to be used for the freezing experiments, consistent with a reasonable time for the freeze. The temperature selected was 56.880 °C.
Prior to a freezing experiment, the SCN was melted by immersing the cell in a water bath at about 80 °C. When the material had completely melted, the cell was removed from the bath and its exterior dried. The cell was inverted several times to obtain a uniform distribution of any impurities present in the sample. Then a cold copper rod was inserted into the thermometer well, which contained a small amount of light mineral oil, to initiate the growth of an SCN sheath around the well. When the sheath appeared to be 2 to 3 mm thick, the rod was removed. This sheath provided an inner liquid-solid interface which the thermometer sensed. Once the sheath had formed, the cell was placed in the constant- temperature oil bath and a thermistor thermometer was inserted into the thermometer well. A second liquid-solid interface then formed along the outer wall of the cell. After the cell was placed in the oil bath, temperature measurements were begun and they were made at regular intervals until complete solidification of the SCN in the cell. These tests were made with groups of three cells at a time.
2.3. Apparatus Used in the Realization of the Triple-Points of the SCN Cells
a). Constant Temperature Bath
A constant temperature bath was used to study the freezing behavior of all cells tested for suitability as SRM 1970. The bath has a 10.6-liter capacity; such baths are commercially available. A light mineral oil (a dimethylpolysiloxane) with a 17-centistokes viscosity at 40 °C was used as a bath medium. The bath has both a cooling and a heating system and its temperature was controlled by their combined effect. The cooling was obtained by passing a stream of pressurized air at room- temperature through the cooling coil. The heater, and consequently the whole bath, was controlled by a commercially-available proportional controller with a thermistor as a sensing element. By this means, it was possible to maintain a uniform bath temperature, constant to ±0.5 mK, for a time much longer than that needed for a freezing or a melting experiment. This high level of temperature control, however, is not necessary in the normal use of SRM 1970.
b). Thermometers
Bead-in-glass probe-type thermistor thermometers were used in this investigation. They were calibrated over the range 0 °C to 70 °C against a standard platinum resistance thermometer (SPRT), all located in a copper block immersed in a constant-temperature oil bath. The copper block, a high-capacity, good thermal conductor, ensured thermal equilibrium among the thermistors and with the SPRT, and damped any sudden temperature fluctuations. The measurements of the SPRT resistances, from which the temperatures of calibration were obtained, were made with a Cutkosky 400-Hz bridge [7] which, with a strip-chart recorder, has an equivalent temperature resolution of about 1.5 μK and an inaccuracy of about 0.01 mK. The SPRT itself had been calibrated previously on the IPTS-68(75) in the NBS Platinum Resistance Thermometer Calibration Laboratory using the same bridge. A constant-current source and high-quality 6½-digit digital voltmeter (DVM) were used for potentiometric measurements of the thermistors. The uncertainty of the resistance measurements of the thermistor thermometers corresponded to about ±0.25 mK. By fitting the equation
| (1) |
to the data, where T is the temperature in kelvins and R is the thermistor resistance in ohms at temperature T, the constants A, B, C and D were determined. The temperature value then derived from eq (1) for a measured thermistor-thermometer resistance agreed with that measured with the SPRT to within ± 1 mK.
c). Temperature Measurement System
The temperature measuring system used in testing the cells for suitability as SRM 1970 was the same automated one used in calibrating the thermistor thermometers and it consisted of a microcomputer, a 6½-digit DVM, a constant-current source, a standard resistor, and the calibrated thermistor thermometers [5].
3. Results and Discussion
3.1. Freezing Experiments
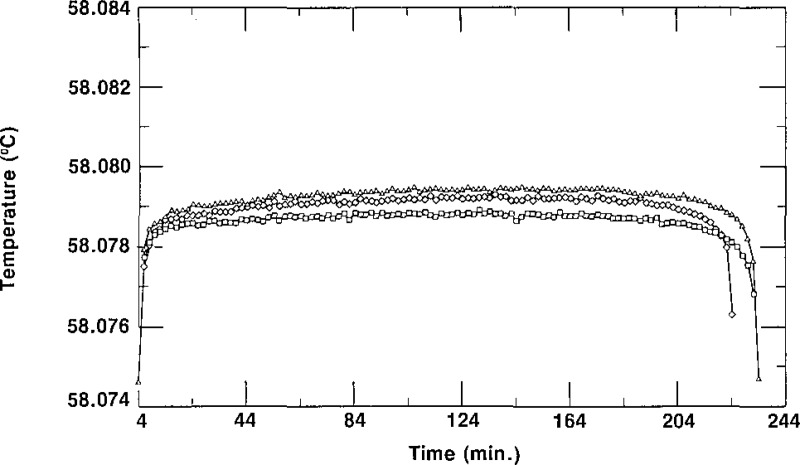
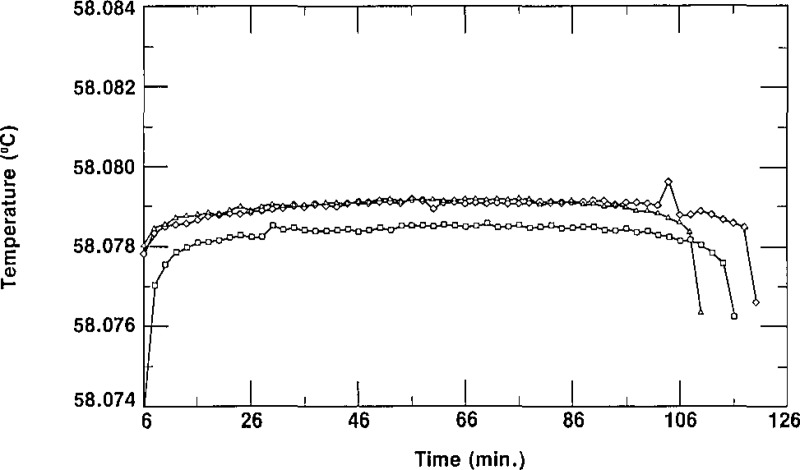
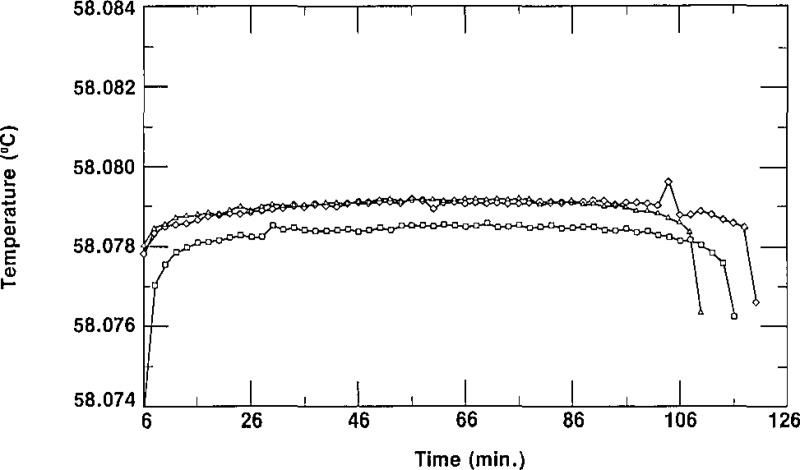
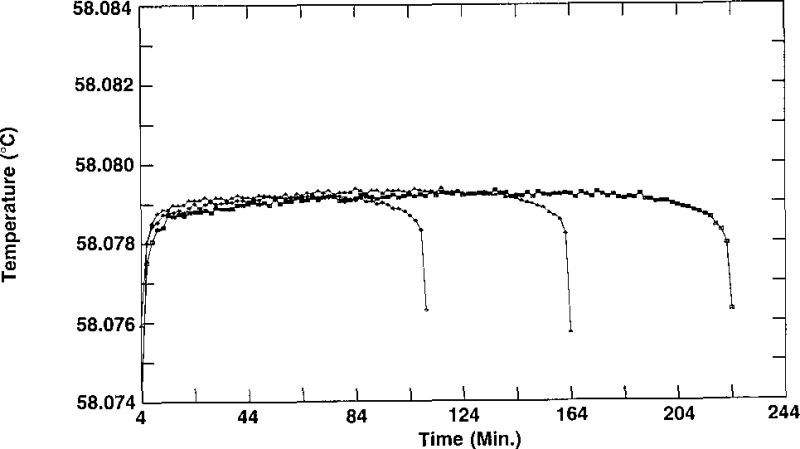
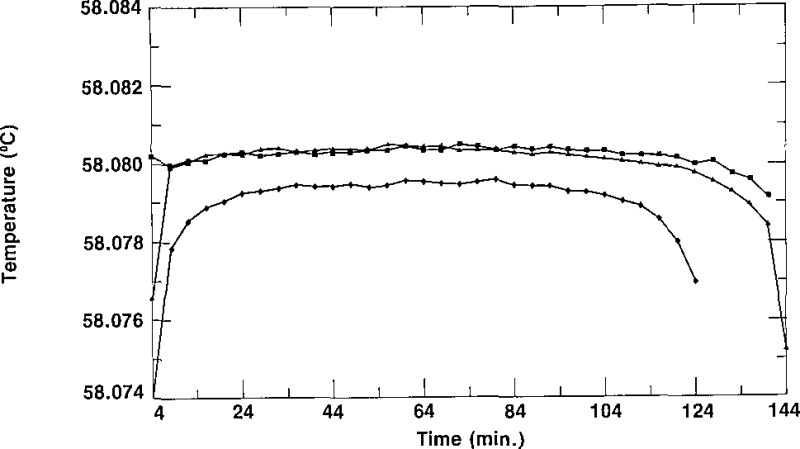
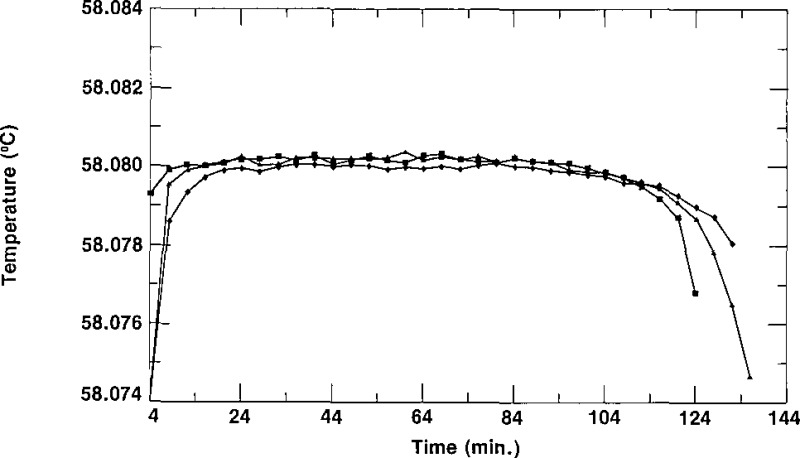
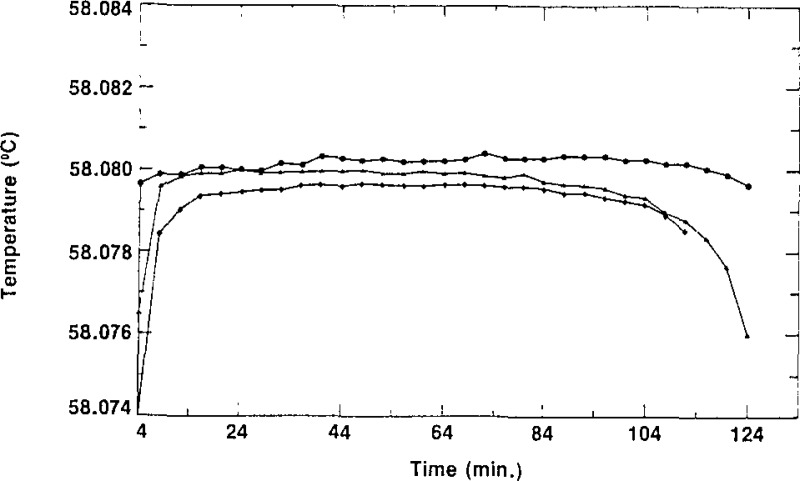
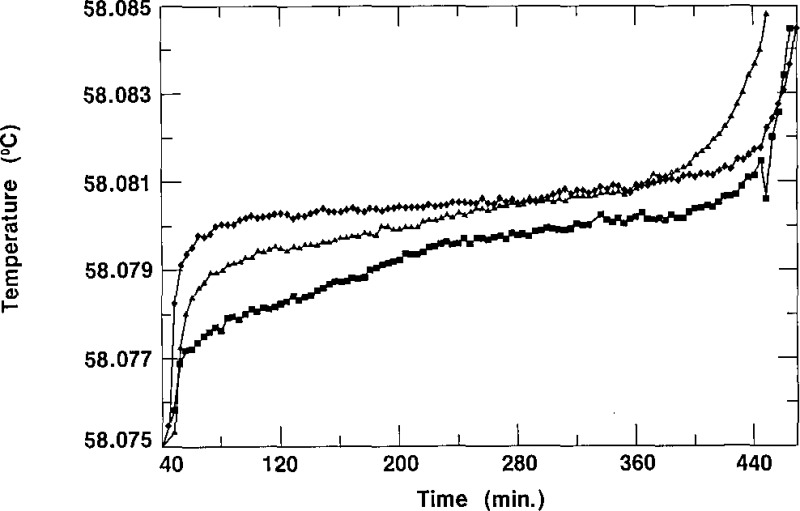
During previous work on SCN [4,5], it was found that the fastest and easiest way of producing a temperature plateau for calibration of thermometers was by the freezing technique, using the inner sheath method, rather than by the melting technique. Adopting this technique for testing the cells for suitability as SRM 1970, we conducted freezing experiments on a cell in the oil bath maintained at 57.480 °C, 57.180 °C and 56.880 °C in order to ascertain a reasonable bath temperature at which to test all of the remaining cells. The results for three freezes of cell A-1/3 in a bath at 57.480 °C are shown in figure 2; those for the cell in a bath at 57.180 °C are shown in figure 3; and those for the cell in a bath at 56.880 °C are shown in figure 4. We depict the combined results of these freezes of A-1/3 in figure 5, which shows that although the times required for the freezes vary with the temperature of the bath, as expected, the temperatures of the plateaus are unaffected by the bath temperature. Based on these results, it was decided to test all cells in a bath maintained at 56.880 °C, a temperature that does not require an unreasonable amount of time for measurements.
Figure 2–
Freezing curves of sample A-1/3 obtained on different days, each time in an oil bath maintained at 57.480 °C.
Figure 3–
Freezing curves of sample A-1/3 obtained on different days, each time in an oil bath maintained at 57.180 °C.
Figure 4–
Freezing curves of sample A-1/3 obtained on different days, each time in an oil bath maintained at 56.880 °C.
Figure 5–
Freezing curves of SRM 1970 cell A-1/3 in constant temperature baths at three different temperatures. The data represented by ∎ were obtained with the cell in a bath at 57.480 °C, those data represented by ▲ were obtained with the cell in a bath at 57.180 °C, and those data represented by ◆ were obtained with the cell in a bath at 56.880 °C.
Figures 2, 3, and 4 also show the irreproducibility of the freezing curves of A-1/3. The spread among the three curves of figure 2 is 0.7 mK, that for the curves of figure 3 is 0.6 mK, and that for the curves of figure 4 is 0.8 mK, We see, however, that the plateaus of the individual curves in figures 2, 3, and 4 are fairly flat and that the freezing range of any given curve is about 0.5 mK. The initial rapid rise in temperature indicated by the thermistor thermometer is due primarily to the temperature of the oil and thermistor in the thermometer well of the cell rising to the temperature of the SCN liquid-solid interface. The curvature at the ends of the freezes is due mainly to the low thermal conductivity of the SCN [8]. Also, the small but gradual increase in temperature during about the first two-thirds of any given freeze is attributed to the low thermal conductivity of SCN. The small but gradual decrease in temperature during the last one-third of a freeze is attributed to the low thermal conductivity of SCN, to increased concentration of impurities in the liquid SCN due to rejection of those impurities at the solid-liquid interface as the SCN solidifies, and to decreased effective immersion of the thermistor thermometer because of the way the outer solid-liquid interface progresses inward.
It can be seen from figure 5 that even with the temperature of the bath set 1.2 °C below the triple-point temperature of SCN, there is still a plateau lasting about 2 hours, a sufficient time for most calibrations. If longer times are required for calibrations, the bath temperature must be set closer to the triple-point value of the SCN.
As indicated in section 2, the column of the second stage of the zone-refining apparatus normally contained enough SCN to fill three cells from the top half (the purest part and that which constituted a “lot”) of the column. The cells were given a designation ending with −1/X, −2/X or −3/3. The letter X represents either the number 2, indicating that only two cells (−1/2 and −2/2) were filled from that lot, or the number 3, indicating that three cells (−1/3, −2/3 and −3/3) are in the lot. The first cell to be filled would normally be considered to be the purest of a lot, the second cell to be filled the next purest, and the third cell to be filled the least pure. In some cases, however, one could envision cells designated −2/X being purer than cells designated −1/X due to the washing of the empty (contaminated?) cells and the impurity not being removed from the first portion of the SCN in the subsequent zone refining. The spread of the triple-point temperatures of the cells of SCN of a given lot is an indication of the relative purity of those cells. Figures 6, 7, and 8 show freezing curves of three groups of cells, each group constituting a lot. All of the freezing curves were obtained at the same bath temperature using the same technique of freezing. The behavior portrayed in these figures is typical of all the lots of SRM 1970. Figure 6 displays freezing curves of cells L28–1/3, L28–2/3, and L28–3/3; these cells belong to lot L28. The temperatures of the plateaus of these cells have a spread of 1.3 mK. Figures 7 and 8 display the curves obtained during freezing of cells L25–1/3, L25–2/3 and L25–3/3, which belong to lot L25, and cells L34–1/3, L34–2/3 and L34–3/3, which belong to lot L34, respectively. The curves obtained during freezing of lot L25 show a spread of about 0.1 mK while those of lot L34 have a spread of about 0.8 mK, We see that all of the curves of figures 6, 7, and 8 are rather flat, with freezing ranges of about 0.5 mK, ranges which are due primarily to curvature near the ends of the freezes. These small freezing ranges indicate high purity.
Figure 6–
Freezing curves of the three cells of lot L28 obtained in a bath at 56.880 °C. ∎ represent data for L28–1/3, ▲ represent data for L28–2/3, and ◆ represent data for L28–3/3.
Figure 7–
Freezing curves of the three cells of lot L25 obtained in a bath at 56.880 °C. ■ represent data for L25-I/3, ▲ represent data for L2 5–2/3, and ◆ represent data for L25–3/3.
Figure 8–
Freezing curves of the three cells of lot L34 obtained in a bath at 56.880 °C. ● represent, data for L34–1/3, ▲ represent data for L34–2/3, and ◆ represent data for L34–3/3.
We see from figures 6, 7, and 8 that the differences in temperature values of the plateaus of the different cells of a given lot are small but the temperatures are, nevertheless, not exactly the same. This is primarily because the cells were filled with SCN from different sections on the same zone-refining column and the purity varies along the column. The results for the cells of lot L34, shown in figure 8, as well as the results for cells of lots L28 and L25, shown in figures 6 and 7, respectively, demonstrate that the purities of the cells belonging to a given lot have different values and that generally they are in the sequence discussed above. The freezing curves of the three samples of lot L34, taken from the same zone-refining tube, clearly demonstrate how impurities affect the triple-point values of the SCN. It is seen in figure 8 that the first sample has a plateau during freezing which has the highest temperature of any sample of that lot. The third cell, L34–3/3, was the last sample in that lot to be extracted from the column and it has a plateau with the lowest temperature, while sample L34–2/3 is purer since it was the second sample to be taken from the column. This distribution of temperatures of the plateaus is as expected from purification of a material by zone refining.
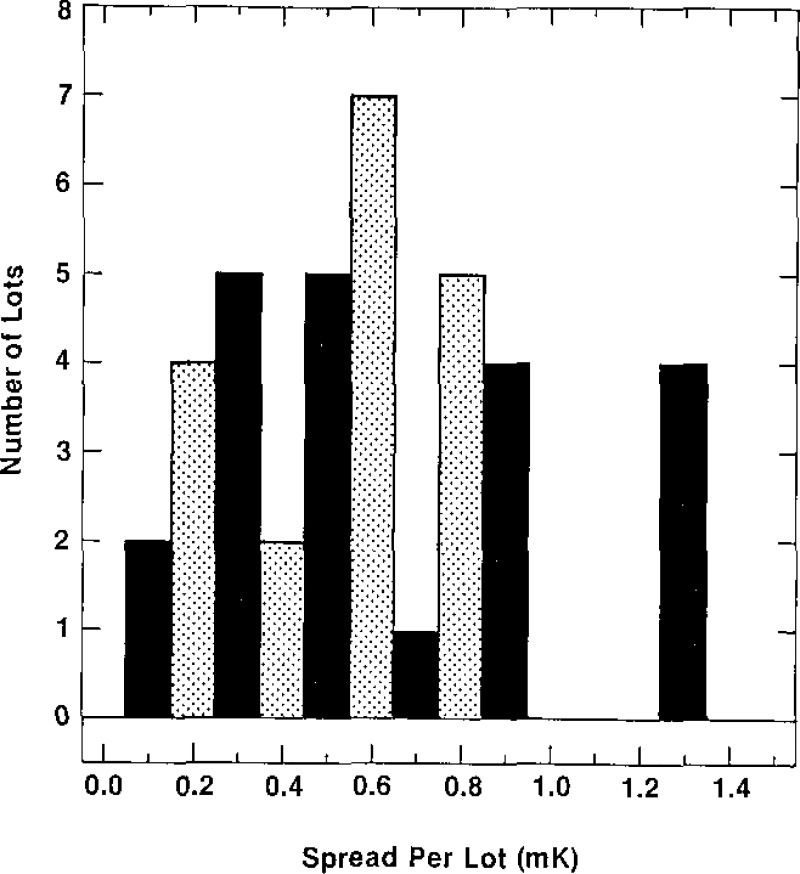
The spread of the temperature values of the plateaus of the curves obtained during freezing of the cells of each of the 39 lots of SRM 1970 cells are shown in figure 9. This shows that the spread ranges from 0.1 mK to 1.3 mK. Only four lots, however, have a spread in temperature exceeding 0.9 mK, and those have a spread of 1.3 mK. These results indicate that the cells of SRM 1970 are of high purity.
Figure 9–
Histogram of the spread of the temperatures of the plateaus of the freezing curves of the cells of a given lot.
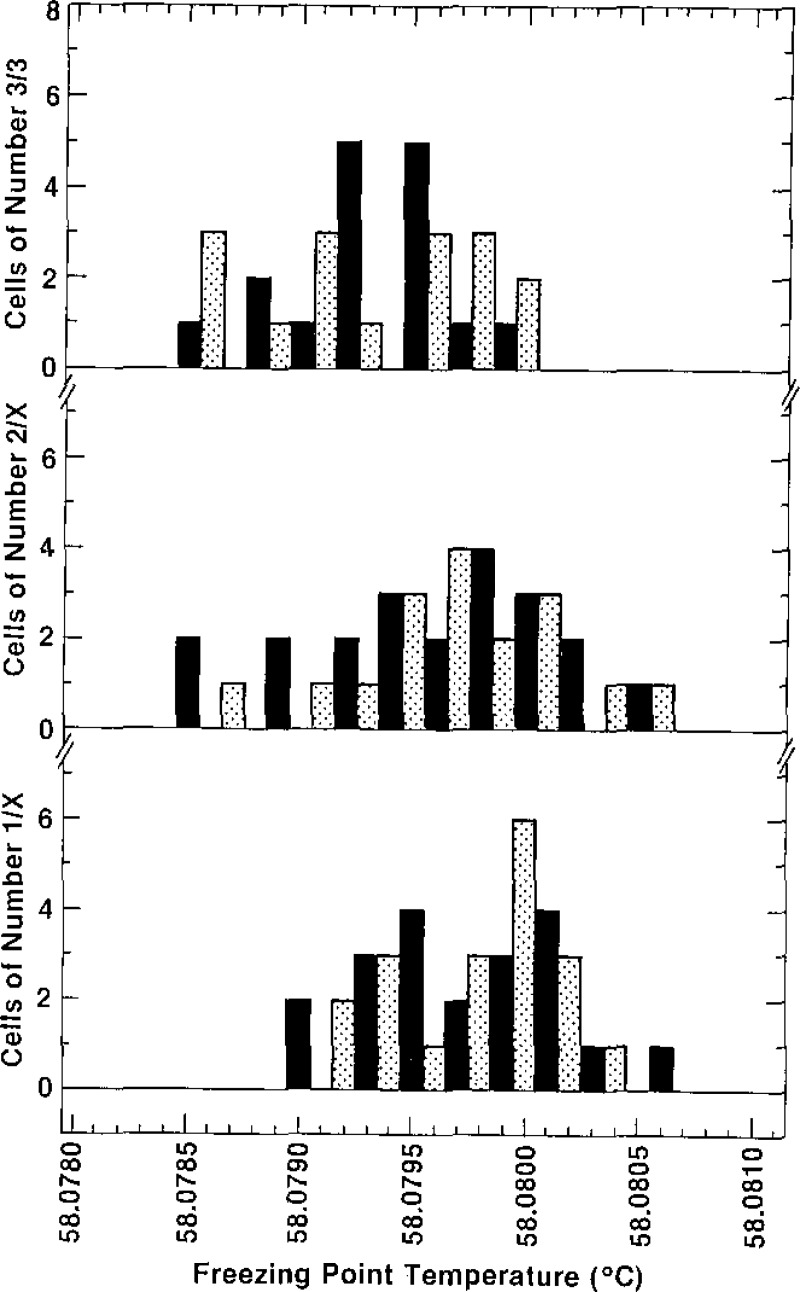
Our results indicate that in general, then, the purity of the cells of a given lot is such that the first extracted sample (comprising the −1/X cell) is the purest, the second cell filled is the next purest, and the last cell (the third cell) will be the most impure. Histograms of the triple-point temperatures for the cells labelled −1/X, −2/X, and −3/3 are presented in figure 10. The highest plateau temperature measured for any cell was 58.0806 °C, as indicated in the histograms for cells labelled −1/X and −2/X. Although the lowest temperature indicated in the histograms is 58.0785 °C, five cells with triple-point temperatures below that value were tested but were rejected as being unsuitable to qualify as SRM 1970. Consequently, they are not included in the histograms. The bottom section of figure 10 shows that the values of the 39 cells with designations −1/X have the smallest spread of triple-point temperatures and a mean value (58.0797 °C) which is slightly higher than that of the other groups of cells (those designated −2/X and −3/3). Also, no cell of the bottom portion of figure 10 has a triple-point temperature below 58.0790 °C. The middle section of figure 10 shows that the 38 cells with designations −2/X are spread over the entire range from 58.0785 °C to 58.0806 °C, with a mean value of 58.0796 °C, a value only slightly less than that for the group of cells designated −1/X. The top section of figure 10 shows the distribution of the 32 cells designated −3/3. These cells have triple-point temperatures ranging from 58.0785 °C to 58.0800 °C, with a mean value of 58.0793 °C.
Figure 10–
Histograms of the triple-point temperatures obtained by freezing of all of the SRM 1970 cells. The histogram at the bottom of the figure is for cells designated –1/X; that in the middle of the figure is for cells designated –2/X; and that at the top of the figure is for cells designated –3/3.
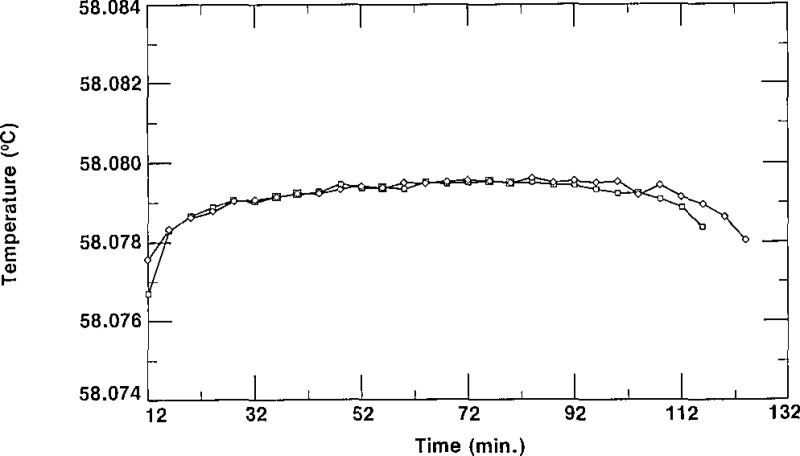
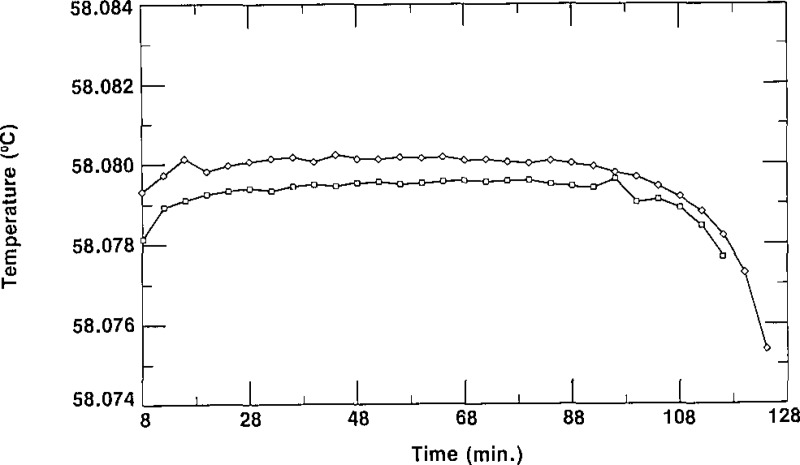
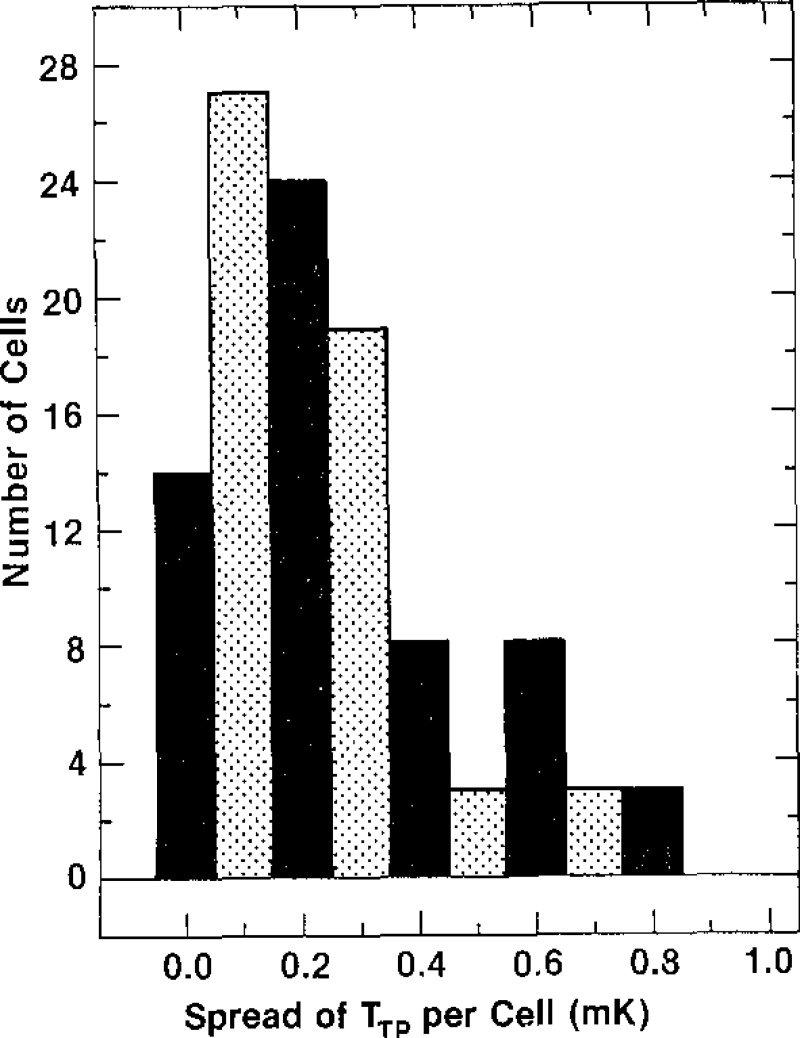
In order to demonstrate the reproducibility of the triple-point temperatures observed for the SRM 1970 cells, we present four typical freezing curves in figures 11 and 12. In figure 11, we display two freezing curves of cell D-3/3, obtained on different days in a bath at the same temperature and using the same thermistor thermometer. This shows the excellent reproducibility that is obtainable with most of the cells comprising SRM 1970. In figure 12, the freezing curves characteristic of cell K-2/3 are presented. As shown there, the curves did not reproduce exactly, but the spread was less than 1 mK. The results in figure 12 are typical of those for cells with the greatest irreproducibility. All 109 SCN cells accepted as SRMs were tested for reproducibility in the manner just described. In figure 13, we present a histogram which indicates that each of the cells had freezing curves which repeated to within a value lying between 0.0 mK and 0.8 mK. Figure 13 shows that 77% of the cells, i.e., 84 cells, have a spread of <0.3 mK and only 25 cells had freezing curves with plateaus that differed by amounts ranging from 0.4 to 0.8 mK.
Figure 11–
Freezing curves of cell D-3/3 obtained on different days in a bath at 56.880 °C, showing reproducibility.
Figure 12–
Freezing curves of ceil K.−2/3 obtained on different days in a bath at 56.880 °C, showing reproducibility.
Figure 13–
Histogram of the spread of the triple-point temperatures of each of the cells of SRM 1970, as determined from freezing curves.
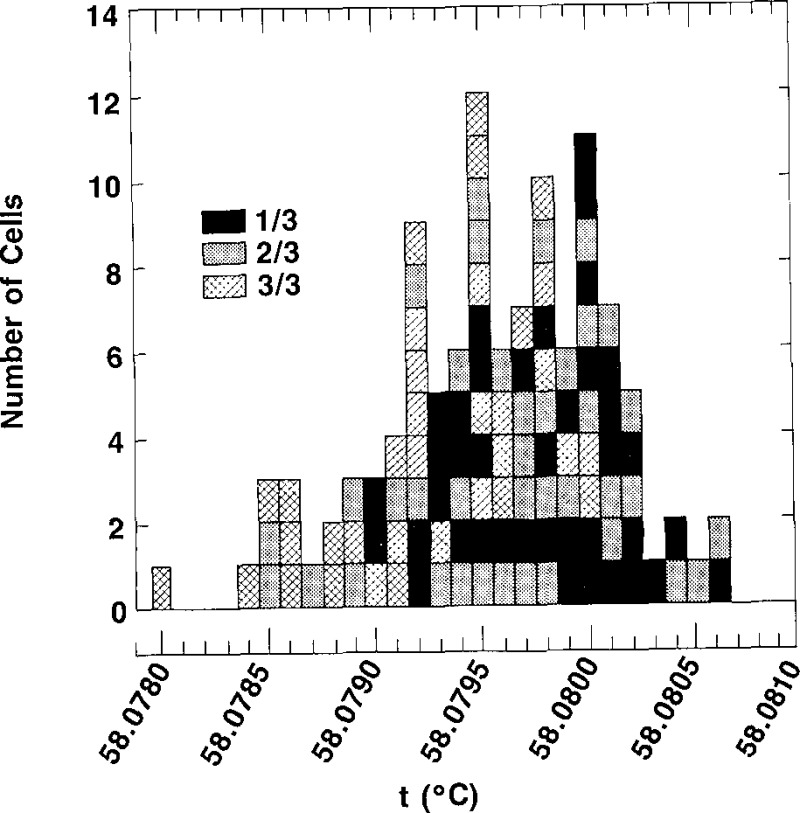
As indicated previously, we obtained 115 cells of SCN to investigate for suitability as SRM 1970. Of these, 109 were accepted as the standard reference material; five were rejected because the temperatures of the plateaus of their freezing curves had values below 58.785 °C, and one cell broke. The histogram shown in figure 14 represents the distribution of the triple-point temperatures of 111 of the 115 cells considered in our study. It is shown that the triple-point values of the 111 cells are distributed over a temperature range of 2.6 mK, i.e., from 58.0780 °C to 58.0806 °C, with the two cells having triple-point temperatures below 58.0785 °C being rejected as unsuitable for SRM 1970. All of the five cells rejected for SRM 1970 belonged to the group designated −3/3. The mean triple-point temperature of the 109 cells accepted as SRM 1970 is 58.0796 °C, with a standard deviation of 0.48 mK and a standard error of 0.04 mK.
Figure 14–
Histogram of the triple-point temperatures of the 109 cells of SCN accepted as SRM 1970, plus those of two cells with temperatures below 58.0785 °C, which, consequently, were rejected as being unsuitable for SRM 1970.
3.2. Determination of Purity
The reproducibility of the plateau of the freezing curve of a sample and the depression of the triple-point/ freezing-point temperature is a function of the purity of that sample [9–11]. Similarly, the purity determines, in a major way, the melting behavior of a sample [9–11]. Both of these methods, of course, are nondestructive and can be used for any SRM 1970 cell. In using melting curves to estimate the purity of the SCN used as SRM 1970, three cells were selected with triple-point temperatures distributed over the range of temperatures observed for the plateaus of all the cells. One sample chosen was L27–2/3, with a triple-point value of 58.0804 °C; another cell chosen was L20–2/3, with a triple-point temperature of 58.0787 °C; the third cell selected was L26–2/3, which has a triple-point temperature of 58.0795 °C. Prior to the melting experiments from which the purities were to be determined, the cells were prepared as follows. The SCN was completely melted by placing the cells in a water bath at about 80 °C, Then the cells were removed, wrapped with paper towels, placed in dewars, and a slow stream of air directed into their thermometer wells to cause the SCN to freeze slowly from inside outwards. This technique of freezing causes the impurities that have distribution coefficients with values less than 1.0 (impurities rejected on freezing) to be more concentrated on the outermost parts of the cells. After the SCN had solidified and cooled to room temperature, the cells were immersed in a constant temperature bath, maintained at a temperature of 58.38 °C, and their temperatures monitored as the SCN melted. Melting curves of the three cells are presented in figure 15.
Figure 15–
Melting curves of cells L20–2/3, L26–2/3 and L27–2/3 obtained in a bath maintained at 58.380 °C. ∎ represent data obtained for cell L20–2/3, ▲ represent data obtained for cell L26–2/3, and ◆ represent data obtained for cell L27–2/3.
Assuming that the law of dilute solutions [12,13] is valid for our samples, the purity can be estimated by using the equation [9]
| (2) |
where X is the total mole fraction of impurities in the sample, Tf1 and Tf2 are the temperatures when the fractions melted are f1 and f2, respectively, and A is the cryoscopic constant (=0.004318 K−1 for SCN). The constant A can be calculated from the equation
| (3) |
where R is the gas constant (8.314 J mol−1 K−1), ΔH is the latent heat of fusion (3703.45 J mol−1 for SCN), and T0 is the melting-point temperature in kelvins. Although the plateaus are not perfectly flat (i.e., there is a finite melting range), the temperature difference between the bath and the SCN is essentially constant, and thus the absorption of heat per unit time by the sample during melting is nearly constant. Consequently, the fraction of SCN melted can be considered to be directly proportional to the time elapsed during the melting and eq (2) can be rewritten as
| (4) |
where f1 and f2 have been replaced by t1 and t2, respectively.
Since the three melting curves shown in figure 15 do not have perfectly flat plateaus and since that for L20–2/3 has an odd shape, we selected various parts of each curve for possible use in estimating the impurity content. The results of the calculations are given in table 1. Values of f2 (or t2) greater than 0.8 were not used because at values greater than that the temperatures of the thermometers were already being influenced by the environment external to the cells. As indicated in table 1, 10 different sections of each curve were used to estimate the amount of impurity. In these determinations of impurities, eq (4) is most sensitive over about the first 50% of the melt. Consequently, we gave that section of the curves the greatest weight in estimating the amount of impurities present. The measurements on the three samples, representative of all the SRM 1970 cells, then, lead to estimates of the purities ranging from 99.999,97% to 99.999,84%, as listed in table 1.
Table 1.
Mole fraction of impurities for three cells (representative of all 109 cells of SRM 1970 certified to date), determined by using different parts of the melting curves.
| (t1, t2) | X | ||
|---|---|---|---|
| L27-2/3 | L26-2/3 | L20-2/3 | |
| (0.1,0.5) | 0.000,000,162 | 0.000,000,593 | 0.000,001,510 |
| (0.1,0.6) | 0.000,000,207 | 0.000,000,725 | 0.000,001,553 |
| (0.1,0.7) | 0.000,000,302 | 0.000,000,755 | 0.000,001,611 |
| (0.1,0.8) | 0.000,000,394 | 0.000,000,888 | 0.000,001,627 |
| (0.2,0.5) | 0.000,000,288 | 0.000,001,15! | 0.000,001,870 |
| (0.2,0.6) | 0.000,000,388 | 0.000,001,424 | 0.000,001,941 |
| (0.2,0.7) | 0.000,000,604 | 0.000,001,450 | 0.000,002.054 |
| (0.2,0.8) | 0.000,000,805 | 0.000,001,726 | 0.000,002,071 |
| (0.3,0.7) | 0.000,000,906 | 0.000,002,491 | 0.000,002,718 |
| (0.3,0.8) | 0.000,001,242 | 0.000,002,900 | 0.000,002,692 |
| Best estimates: | |||
| of X | 0.000,000,3 | 0.000,000,7 | 0.000,001,6 |
| of Purity | 99.999,97% | 99.999,93% | 99.999,84% |
4. Recommended Procedure for Use of SRM 1970 in Calibration of Thermometers
To obtain the best results in calibrating thermometers using SRM 1970, the SCN should be totally melted, a thin sheath of solid SCN prepared around the thermometer well, the cell placed in an appropriate constant- temperature environment, and the SCN slowly frozen while calibrating the thermometers.
The constant-temperature environment should be a well-stirred fluid bath (preferably containing a light purified mineral oil) maintained at a temperature between 56.88±0.05 °C and 58.02±0.05 °C. Since the SRM 1970 cells are approximately 18 cm long, the bath should be at least 20 cm deep from the top level of the oil. The cell or cells should be mounted vertically in a suitable holder in such a way that the cells are completely immersed below the level of the oil.
A temperature controller capable of controlling the bath to ±0.02 °C is preferred, but one could use a bath controlled to only ±0.05 °C, or even ±0.1 °C.
The detailed procedure preferred for calibrating a thermometer through the use of an SRM 1970 SCN triple-point cell is as follows: First, get a well-stirred oil bath to a temperature between 56.88±0.05 °C and 58.02±0.05 °C and maintain it at that point. Melt the sample by immersing the cell in a water bath at about 80 °C. After the SCN has completely melted, remove the cell from the bath and invert it several times to ensure a thorough mixing of the liquid material (SCN and all impurities) inside the cell. Dry the cell, put a small amount of oil in the thermometer well, and insert a cold copper rod into the well. After the formation of what appears to be a 2-to-3 mm sheath of the SCN around the thermometer well, put the cell into the temperature-controlled bath, using a holder to support the cell. Insert the thermometer to be calibrated in the thermometer well of the cell, wait 10 to 15 minutes, then read the indication of the thermometer. The correct temperature of the thermometer at that time is the value indicated on the SRM certificate.
If more than one thermometer is to be calibrated, the second and succeeding thermometers should be allowed 5 to 10 minutes to reach thermal equilibrium with the freezing SCN in the cell before obtaining measurements on them. The smaller the mass of the thermometer and the closer the temperature of the thermometer is to that of the fixed point, the shorter the length of time required for equilibrium.
If the minimum recommended temperature of the environment of the cell (56.88 °C) is used, there should be a minimum time of about 90 minutes available for calibration from the time the SCN sheath is prepared. If more than about 75% of the SCN has solidified and if more calibrations are needed, remove the SCN cell, repeat the previous procedure to prepare a new inner sheath, and put the cell back into the oil bath (or other controlled environment) for further calibration work. These consecutive freezing and melting processes may be repeated as often as required.
5. Summary and Conclusions
In certifying cells of SCN for SRM 1970, 115 cells of purified SCN were tested, 5 of them were rejected because their freezing values were below 58.0785 °C, and one was broken. The remaining 109 samples were accepted as suitable for the temperature standard reference material. The triple-point temperatures of all the cells accepted for SRM 1970 ranged between 58.0806 °C and 58.0785 °C, with a mean value of 58.0796 °C, a standard deviation of 0.48 mK and a standard error of 0.04 mK.
In realizing the fixed points of these cells, the freezing technique was found to be more convenient than that of melting because of the greater flatness of the freezing curves. Each of the cells showed a high degree of reproducibility, with the observed temperature values of the plateaus differing by no more than 0.8 mK. These properties make the cells very attractive as a temperature reference standard for the calibration of thermometers near 58.08 °C.
The SCN used was of high purity; that is clear from the fact that the spread of freezing-point temperatures values per lot did not exceed 1.3 mK. The amount of impurities estimated to be present in the SCN of the 109 cells of SRM 1970 has values ranging from 3 X 10⁻⁷ to 1.6X 10⁻⁶, equivalent to a purity of the SCN ranging from 99.999,97% to 99.999,84%. This is a very high purity for an organic material.
Thermometers with diameters no greater than 4.5 mm may be calibrated in these SRM 1970 cells.
Biography
About the Authors: B. W. Mangum is with the Temperature and Pressure Division in NBS’ Center for Basic Standards where Samir El-Sabban served as a guest scientist.
Footnotes
Numbers in brackets indicate literature references.
Contributor Information
B. W. Mangum, National Bureau of Standards, Gaithersburg, MD 20899
Samir El-Sabban, National Institute of Standards, Cairo, Egypt.
6. References
- [1].The International Practical Temperature Scale of 1968, Amended Edition of 1975, Metrologia 12, 7–17 (1976). [Google Scholar]
- [2].Bureau International des Poids et Mesures, Monograph, Supplementary Information for the IPTS-68 and the EPT-76, Pavilion de Breteuil, F-92310 Sevres (1983).
- [3].Glicksman M. E.; Voorhees P. W. and Setzko R., The triple-point equilibria of succinonitrile—its assessment as a temperature standard, in Temperature: Its Measurement and Control in Science and Industry 5, American Institute of Physics: New York, NY, 321–326 (1982). [Google Scholar]
- [4].Mangum B. W., The succinonitrile triple-point standard: a fixed point to improve the accuracy of temperature measurements in the clinical laboratory, Clin. Chem. 29, 1380–1384 (1983). [PubMed] [Google Scholar]
- [5].Mangum B. W., Triple point of succinonitrile and its use in the calibration of thermistor thermometers, Rev. Sci. rnstrum. 54, 1687–1692 (1983). [Google Scholar]
- [6].Mangum B. W., private communication.
- [7].Cutkosky R. D., An ac resistance thermometer bridge, J. Res. Natl. Bur. Stand. (U.S.) 74C, 15–18 (1970). [Google Scholar]
- [8].Smit W. M., Errors occurring in the determination of temperature-heat content curves, Anal. China. Acta 17, 23–35 (1957). [Google Scholar]
- [9].Smit W. M., Melting curves (temperature-heat content curves) as criteria for purity, Recuil Trav. Chim. des Pays-Bas. 75, 1309–1320 (1956). [Google Scholar]
- [10].Furukawa G. T.; Riddle J. L., Bigge W. R., and Pfeiffer E. R., Application of some metal SRM’s as thermometric fixed points, Natl. Bur. Stand. (U.S.) Spec. Publ. 260–77, Supt. of Documents, U.S. Gov’t. Printing Office: Washington, DC 20402: (1982). [Google Scholar]
- [11].Riddle J. L.; Furukawa G. T. and Plumb H. H., Platinum resistance thermometry, NBS Monograph 126, Supt. of Documents, U.S. Gov’t Printing Office: Washington, DC 20402: (1973). [Google Scholar]
- [12].Lewis G. N., and Randall M., Thermodynamics and Free Energy of Chemical Substances, McGraw-Hill Book Co.: New York, NY, p. 238 (1923). [Google Scholar]
- [13].White W. P., Estimating impurities by means of the melting point curve, J. Phys. Chem, 24, 393–416 (1920). [Google Scholar]


