Abstract
Background
Formulation of neuraminidase (NA) within influenza vaccines is gaining importance in light of recent human studies. The enzyme‐linked lectin assay (ELLA) is considered a reliable assay to evaluate human anti‐NA antibodies.
Objectives
To overcome interference by hemagglutinin (HA)‐specific antibodies and detect neuraminidase inhibitory (NI) antibodies only, two different sources of antigen have been studied in ELLA: reassortant viruses with a mismatched avian origin‐HA or Triton X‐100 (Tx)‐treated wild‐type viruses. Pseudotypes or pseudovirus (PV), characterized by a lentivirus core bearing human influenza NA and avian influenza HA, were investigated as an alternative source of antigen and compared to HA‐mismatched and Tx‐treated viruses, since represent a safer product to be handled.
Methods
Two independent panels of sera were analyzed by ELLA to evaluate the anti‐NA response against N1 (A/California/07/2009 (H1N1pdm)) and N2 (A/Hong Kong/4801/2014 (H3N2)). The NA inhibition (NI) antibody titers measured as either the 50% end point or 50% inhibitory concentration (IC50) were compared for every source of antigen.
Results
The ELLA assay performed well with all three sources of antigen. NI titers measured using each antigen type correlated well when reported either as end point titers or as the IC50.
Conclusions
This study suggests that HA‐mismatched whole virus, Triton‐treated wild‐type virus or PV can be used to measure NI antibody titers of human sera, but further comparability/validation assays should be performed to assess statistical differences. The data support the use of PV as an attractive alternative source of antigen and justify further investigation to improve stability of this antigen source.
Keywords: enzyme‐linked lectin assay, influenza, neuraminidase, pseudovirus
1. INTRODUCTION
Neuraminidase is the second most abundant glycoprotein on the influenza virus surface (17% of the overall surface) after HA and it is usually expressed at a ratio 1:4 (40‐50 NA and 160‐200 HA spikes),1 with exceptions.2, 3, 4 NA has multiple roles: (a) allow the release of newly formed virions from the surface of the infected cell, leading to viral spread, (b) enhance influenza infection by acting on glycoconjugates expressed at the cell surface,5 and (c) form complexes with sialic acids on the host cell surface,6, 7 particularly for H3N2 viruses.8 Several studies have confirmed that both inactivated and live attenuated vaccines have the capacity to induce NA‐specific antibodies.9, 10 NA inhibiting antibodies are associated with resistance against influenza,11, 12 reduced severity and duration of disease.13
Several different assays have been used to evaluate the antibody response to NA. The traditional NA inhibition (NI) assay determines the extent of antibody‐mediated interference with viral enzyme activity based on the measurement of sialic acid that is released from a glycosylated substrate.14 An assay that measures NA activity based on accessibility of galactose, the penultimate sugar of many complex carbohydrates, to peanut agglutinin, offers advantages in that it does not use hazardous chemicals and has higher throughput. This enzyme‐linked lectin assay (ELLA) developed by Lambré et al15 and successively adapted and optimized,10, 16, 17 measures sialidase activity of NA by detecting the terminal galactose that becomes exposed after sialic acid cleavage. A study conducted by Eichelberger et al18 that employed the protocol published by Couzens et al17 showed that the ELLA is robust and sensitive although improvements can be made to further standardization of the method.
Measuring the NI antibody only is possible if HA‐specific antibodies are unable to bind to the virus. This is usually accomplished by using reassortant viruses that have a mismatched avian HA, although it should be kept in mind that antibodies against conserved HA epitopes19 can still occur. The production of reassortant influenza viruses, beyond the intrinsic difficulty of optimizing the process, limits many laboratories from using these as a source of antigen since genetically modified organisms require additional biosafety containment and in some countries a permit from the Department of Agriculture. This is due to the HA gene, that is usually derived from an avian source. The inability of many laboratories to produce such reassortant viruses by reverse genetics have led to the employment of alternative sources of antigen. Jonges et al20 described Triton X‐100 treatment of wild‐type A/California/07/2009 (H1N1) X‐181 virus, which led to the disruption of virus particles while maintaining NA structure and activity. A simple and innovative solution has been investigated by Prevato et al21 and further characterized22; the employment of influenza lentiviral pseudotypes (pseudovirus or PV as will be called from now on) as a surrogate virus that expresses the human influenza NA (with or without an avian influenza HA) of interest. PV is reassortant chimera viruses that are infectious for a single cycle, thus unable to make infectious progeny. These characteristics allow many laboratories to handle them on lower biosafety containment levels. Triton X‐100 and PV as alternative antigens for the ELLA would avoid the need for reassortant viruses, so that ELLAs can be performed faster and safer. The employment of pseudovirus‐based ELLA assay (P‐ELLA) will also eliminate the need of wild‐type virus, meaning that this assay can be performed at biosafety level II (BSL2) even for influenza pandemic strains.
In this study, we compared three different types of antigens in the ELLA assay: reassortant viruses, Triton X‐100‐ inactivated viruses, and pseudoviruses. The comparison was performed by measuring NA inhibition antibody titers against N1 and N2 subtypes. Our results show correlation between titers measured with all the sources of antigens, providing the means to standardize and validate the methodology in laboratories that do not have access to suitable reassortant virus antigens.
2. MATERIALS AND METHODS
2.1. Reassortant viruses
H6N1 and H6N2 reassortant viruses expressing HA from A/turkey/Massachusetts/3740/1965 (H6N2), NA from A/California/07/2009 (H1N1) or A/Hong Kong/4801/2014 (H3N2) and the other genes from A/Puerto Rico/8/1934 (H1N1) were produced by reverse genetics as previously described.17 Reassortant viruses were inactivated by β‐propiolactone treatment.
2.2. Triton X‐100‐treated wild‐type viruses
Wild‐type A/California/07/2009 (H1N1) (code 13/198) and A/Hong Kong/4801/2014 (H3N2) (code 15/192) influenza viruses obtained from NIBSC were treated with different concentrations of Triton X‐100 (ranging from 0.1% to 1%) at 37°C for 1h as previously reported.20
2.3. Pseudoviruses
Production of lentiviral PVs was carried out by co‐transfecting HEK293T/17 (ATCC® CRL‐11268™) cells with phCMV1‐H11 (H11 from A/duck/Memphis/546/1974 (H11N9); kind gift of Davide Corti), pNLLuc4.3 (gag‐pol and luc genes, kind gift of Nathaniel Landau) and pI.18‐N1Cal/09 or pI.18‐N2HK/14 (backbone plasmid pI.18, kind gift of Carolyn Nicolson, NIBSC), as previously described.22, 23, 24, 25 The H11 plasmid was added to improve NA stability and increase the PV release and production as previously described26 and confirmed for this assay.22, 25 Briefly, 1 µg of HA, 1 µg of NA, and 1.5 µg pNLLuc4.3 plasmids were transfected into HEK293T/17 cell lines using Endofectin™ Lenti (3 µL/µg). Medium was replenished 24 hours after transfection. The NA activity of each PV was titrated in ELLA as reported previously.17
2.4. Serum samples
Two different panels of 40 (S1.1‐S1.40) and 34 (S2.1‐S2.34) human sera were tested against N1 and N2 NAs, respectively. Information about gender, age, and vaccination status was not provided.
2.5. HA assay
HA assays were performed to confirm the inability of Triton X‐100 treated virus to agglutinate RBCs. The protocol was described elsewhere (WHO 2011, Manual for the laboratory diagnosis and virological surveillance of influenza).
2.6. ELLA assay
ELLA assays were performed as previously described,17 with minor modifications. The amount of antigen used in the assay corresponded to 90% of the maximum signal. The quantity of horseradish peroxidase conjugated to peanut agglutinin from Arachis hypogea (HRPO‐PNA) corresponded to 1:1000 for all the tests except for the H11N2 PV, where a dilution of 1:500 was used. Titers were assigned as the 50% end point titer, that is, the inverse of the highest dilution that resulted in at least 50% inhibition of the maximum signal represented by the viral control (VC) minus the blank [(VC‐BLANK)/2)]. IC50 values were automatically generated using Graph Pad Prism 5® software.
2.7. Statistical evaluation
Every serum sample was tested in duplicate and evaluated by both 50% end point titer and IC50 outcomes.22 The percent inhibition of enzyme activity is calculated as follows: background optical density (OD) is subtracted from the virus control (maximum NA activity, no serum added) and sample ODs. The 50% end point titer is calculated as the highest serum dilution that resulted in at least 50% inhibition of the maximum NA activity. IC50 values were generated through a non‐linear regression curve fit using GraphPad Prism 5®, as described elsewhere.25
The geometric mean titer (GMT) of end point titers was reported as Log2 and compared by simple non‐linear regression curve fit, and r 2 (coefficient of determination), a measure of strength of the relation between two variables.27 To investigate the relationship between the errors in measurement and the true values, the mean difference (d) and the standard deviations of the differences (s) were calculated.27 The Spearman rank calculation was also used to compare the outputs, as reported elsewhere.28
In addition, Log2 of IC50 titers determined from inhibitory curves were also compared. Coefficient of determination (r2), the mean difference (d), and the standard deviation of the differences (s) were evaluated by Bland and Altman and Spearman rank analyses.
3. RESULTS
3.1. Preparation of Triton X‐100‐treated antigens
Several concentrations of Triton X‐100 (Tx) were tested for their ability to selectively inactivate HA activity. Wild‐type A/California/07/2009 (H1N1) virus was completely inactivated by 0.5% and 1% Triton X‐100 treatment. Haemagglutination activity of wild‐type A/Hong Kong/4801/2014 (H3N2) was completely destroyed even by 0.1% Triton X‐100 concentration, as well as 0.5% and 1%. As in the method of Jonges et al,20 Triton X‐100 was not removed.
The impact of Tx‐treatment on NA activity was tested by titrating each preparation in ELLA. The activity of N1‐Tx preparations was slightly reduced compared to the untreated virus, but it did not impede test performance. To assess specificity of NA inhibition, the N1‐Tx wild‐type virus was pre‐incubated with anti‐A/California/7/2009 (N1) NA serum (NIBSC, code 10/218), anti‐A/California/7/09 HA serum (NIBSC, code 16/114), or human serum minus IgA/IgM/IgG (Sigma Aldrich cat. S5393‐1VL). The homologous antiserum against the HA did not show any inhibition of the NA. The immunoglobulin‐depleted human serum also did not inhibit NA. In contrast, the antiserum against NA inhibited enzyme activity of the N1‐Tx virus. The same titer was also obtained when the antiserum against NA was pre‐incubated with untreated wild‐type virus (results not reported).
Unfortunately, none of the N2‐Tx preparations retained NA activity. Even changing the buffer and the pH, as previously suggested,29 N2‐Tx preparations lost NA activity. Therefore, only N1‐Tx was included in the comparison of antigens to measure NA inhibition antibody titers.
3.2. H6N1, H1N1‐Tx, and H11N1 PV sources of antigen show comparable NI antibody titers
H6N1 reassortant virus, N1‐Tx, and H11N1 PV were titrated in ELLA to determine the appropriate amount of antigen to use in each assay. The amount of antigen added to each assay was 90% of the maximum OD for each source of antigen. ELLA assays were performed to measure NI antibody titers of 40 sera against each N1 antigen, (Figures 1 and 2).
Figure 1.
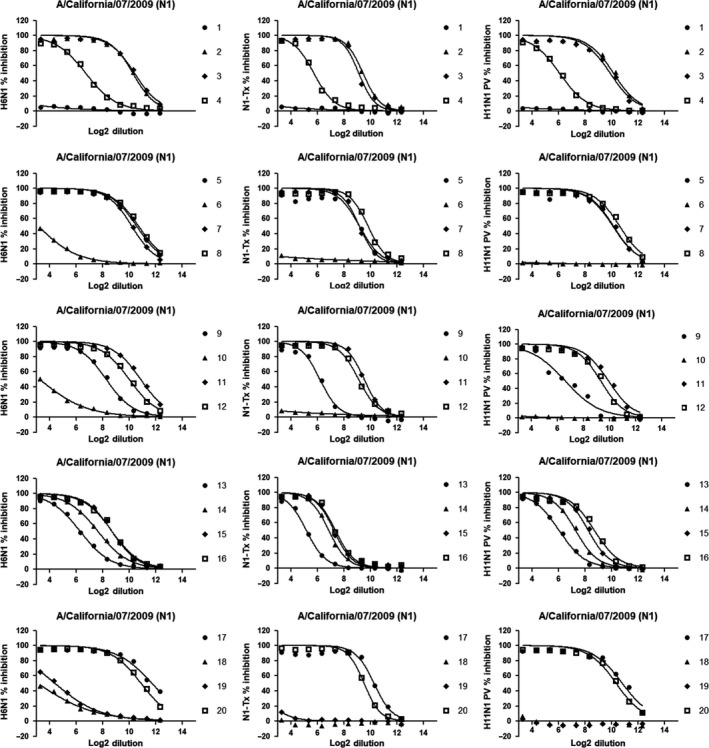
Inhibition curves showing the ability of sera to inhibit sialidase activity across the plate. Sera from 1 to 20 (corresponding to plates 1‐5) were tested in duplicate (GMTs here reported) against H6N1 reassortant virus (left column), N1‐Tx antigen (central column), and H11N1 PV (right column). Y axes represent the percentage of inhibition while X axes report the Log2 of the dilution. The prefix "S1." in front of every serum number is omitted to improve the readability of the legends
Figure 2.
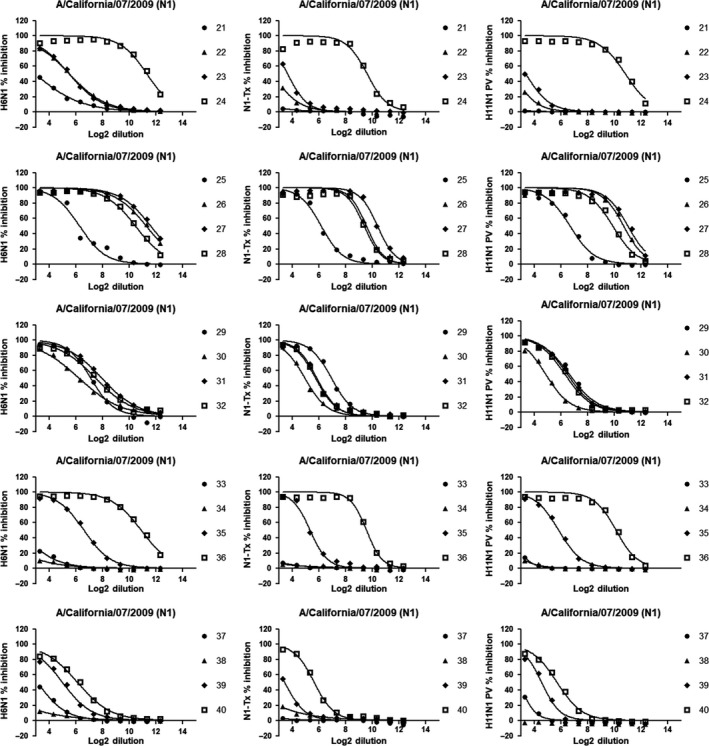
Inhibition curves showing the ability of sera to inhibit the sialidase activity across the plate. Sera from 21 to 40 (corresponding to plates 6‐10) were tested in duplicate (GMTs here reported) against H6N1 reassortant virus (left column), N1‐Tx antigen (central column), and H11N1 PV (right column). Y axes represent the percentage of inhibition while X axes report the Log2 of the dilution. The prefix "S1." in front of every serum number is omitted to improve the readability of the legends
Table 1 shows that results are reproducible, with the NI titer of each replicate being within 2‐fold difference. To allow statistical comparison of results, titers measured as <10 (1:10 was the first dilution of serum) were assigned a titer of 5. In addition, Log2 of IC50 values, obtained using Graph Pad Prism 5®, were collected and analyzed.
Table 1.
ELLA assay outcomes (S1.1‐S1.40) from the 3 different sources of antigen for N1 NA. Individual NI titers and GMTs of the results are shown
| Test 1 | Test 2 | Test 1 | Test 2 | Test 1 | Test 2 | AVG | AVG | AVG | |
|---|---|---|---|---|---|---|---|---|---|
| Serum ID | N1‐TX | N1‐TX | H11N1‐PV | H11N1‐PV | H6N1 | H6N1 | N1‐TX | H11N1‐PV | H6N1 |
| S1.1 | 5 | 5 | 5 | 5 | 5 | 5 | 5 | 5 | 5 |
| S1.2 | 640 | 640 | 1280 | 1280 | 640 | 1280 | 640 | 1280 | 905 |
| S1.3 | 320 | 320 | 640 | 640 | 1280 | 1280 | 320 | 640 | 1280 |
| S1.4 | 40 | 40 | 40 | 40 | 80 | 80 | 40 | 40 | 80 |
| S1.5 | 320 | 640 | 640 | 1280 | 1280 | 1280 | 453 | 905 | 1280 |
| S1.6 | 5 | 5 | 5 | 5 | 5 | 5 | 5 | 5 | 5 |
| S1.7 | 320 | 320 | 1280 | 640 | 640 | 640 | 320 | 905 | 640 |
| S1.8 | 640 | 640 | 1280 | 1280 | 1280 | 1280 | 640 | 1280 | 1280 |
| S1.9 | 40 | 80 | 80 | 80 | 320 | 320 | 57 | 80 | 320 |
| S1.10 | 5 | 5 | 5 | 5 | 5 | 10 | 5 | 5 | 7 |
| S1.11 | 640 | 640 | 640 | 640 | 1280 | 1280 | 640 | 640 | 1280 |
| S1.12 | 320 | 320 | 640 | 640 | 640 | 640 | 320 | 640 | 640 |
| S1.13 | 20 | 20 | 40 | 40 | 40 | 80 | 20 | 40 | 57 |
| S1.14 | 80 | 80 | 160 | 160 | 160 | 160 | 80 | 160 | 160 |
| S1.15 | 80 | 80 | 320 | 320 | 320 | 320 | 80 | 320 | 320 |
| S1.16 | 80 | 80 | 320 | 320 | 320 | 320 | 80 | 320 | 320 |
| S1.17 | 640 | 640 | 1280 | 1280 | 1280 | 2560 | 640 | 1280 | 1810 |
| S1.18 | 5 | 5 | 5 | 5 | 5 | 5 | 5 | 5 | 5 |
| S1.19 | 5 | 5 | 5 | 5 | 20 | 20 | 5 | 5 | 20 |
| S1.20 | 640 | 640 | 1280 | 1280 | 1280 | 1280 | 640 | 1280 | 1280 |
| S1.21 | 5 | 5 | 5 | 5 | 10 | 5 | 5 | 5 | 7 |
| S1.22 | 5 | 5 | 5 | 5 | 40 | 40 | 5 | 5 | 40 |
| S1.23 | 10 | 10 | 10 | 5 | 40 | 40 | 10 | 7 | 40 |
| S1.24 | 640 | 640 | 1280 | 1280 | 2560 | 2560 | 640 | 1280 | 2560 |
| S1.25 | 40 | 40 | 80 | 80 | 40 | 40 | 40 | 80 | 40 |
| S1.26 | 640 | 640 | 1280 | 1280 | 2560 | 2560 | 640 | 1280 | 2560 |
| S1.27 | 1280 | 640 | 1280 | 1280 | 2560 | 2560 | 905 | 1280 | 2560 |
| S1.28 | 320 | 640 | 640 | 640 | 1280 | 1280 | 453 | 640 | 1280 |
| S1.29 | 80 | 80 | 80 | 80 | 80 | 80 | 80 | 80 | 80 |
| S1.30 | 20 | 20 | 20 | 20 | 40 | 40 | 20 | 20 | 40 |
| S1.31 | 40 | 40 | 80 | 80 | 160 | 160 | 40 | 80 | 160 |
| S1.32 | 40 | 40 | 80 | 80 | 160 | 160 | 40 | 80 | 160 |
| S1.33 | 5 | 5 | 5 | 5 | 5 | 5 | 5 | 5 | 5 |
| S1.34 | 5 | 5 | 5 | 5 | 5 | 5 | 5 | 5 | 5 |
| S1.35 | 20 | 20 | 40 | 40 | 80 | 80 | 20 | 40 | 80 |
The inhibition curves were obtained by performing non‐linear regression from every serum run in duplicate (GMT is shown) against each N1 source of antigen (Figures 1 and 2).
N1‐Tx end point titers were similar to titers using H11N1 PV as antigen in 90% of all the cases (36/40) of which 17/36 were identical (42.5%). There was a greater than 2‐fold difference in only 4 cases. NI titers measured in assays using H11N1 PV and H6N1 reassortant viruses were similar in 90% of all the cases (36/40) of which 14 sera had the same titer (35%). There was a greater than 2‐fold and 4‐fold difference in only 2 cases each. Greater differences were found when N1‐Tx and H6N1 values where compared; 23/40 of all cases (57.5%) were well‐aligned and of those, 7/23 (17.5%) had the same titer. There was a greater than 2‐fold and 4‐fold difference in 17 and 1 cases, respectively.
In 7/40 (17.5%) of all the cases, the assays conducted with different antigen sources gave the same results, while 17/40 (42.5%) the results had 2‐fold difference and 14/40 (35%) had 4‐fold difference. Interestingly the titers obtained with N1‐Tx were approximately 2‐fold lower than the PV antigen, while titers obtained with H6N1 reassortant values were often 2‐fold higher than those measured against the PV antigen. Only in 1 case was an 8‐fold difference in titer observed between N1‐Tx or H11N1 PV and H6N1 (serum 22). In summary, titers from ELLA assays conducted with the three different sources of antigen varied not more than 4‐fold, except in one case.
A comparison of ELLA titers using three different sources of antigens was also performed (Figure 3).
Figure 3.
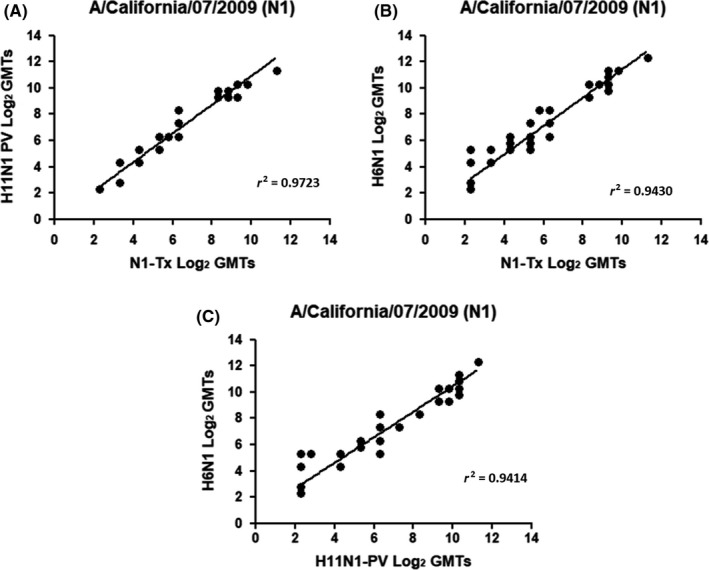
Comparison between (A) wild‐type N1‐Tx/H11N1 PV, (B) wild‐type N1‐Tx/H6N1, and (C) H6N1/H11N1 PV geometric end point titers. Results are represented as Log2 of the end point titer
Comparison between N1‐Tx and H11N1 PV (Figure 3A) yields an r2 = 0.9723. Interestingly both these two sources of antigens are comparable to H6N1 (Figure 3B,C), yielding r2 values of 0.9430 and 0.9414 with N1‐Tx and H11N1 PV, respectively. To assess, whether there was any bias Bland and Altman correlation analysis27 was performed (Figure 4).
Figure 4.
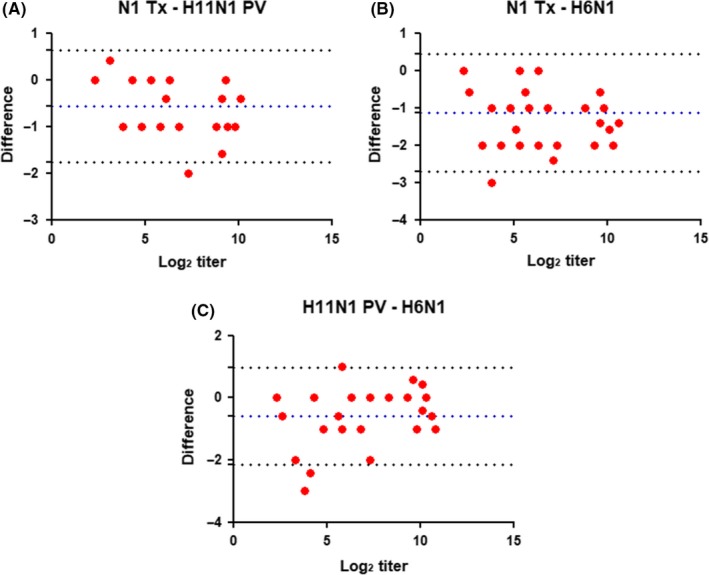
Bland‐Altman plot of the differences between (A) wild‐type N1‐Tx/H11N1 PV, (B) wild‐type N1‐Tx/H6N1, and (C) H11N1 PV/H6N1. The difference of titers (log 2) measured for each serum in ELLA using different sources of antigen (red bullets) plotted against the limit of agreement (±1.96 SD, stippled black line) and the overall mean of the different outcomes (bias, stippled dark blue line). There are no significant differences at high or low titers
This confirmed that the two measurements are comparable, with very few titers outside the intervals defined as “limits of agreement.” However, titers measured against N1‐Tx were often less than measured against H11N1 PV (Figure 4B), and titers measured against H6N1 were often higher than those measured by either N1‐Tx or H11N1 PV (Figure 4A,C, respectively). The difference in titers measured for sera 22 and 23 was outside the limits of agreement for assays using H6N1 and H11N1 PV (Figure 4C).
IC50 titers were compared through linear regression (Figure 5). Comparison between N1‐Tx and H11N1 PV IC50 titers (Figure 5B) shows an r2 = 0.9822, and an r2 = 0.9470, and r2 = 0.9315 when compared to H6N1 outcomes, respectively (Figure 5A,C).
Figure 5.
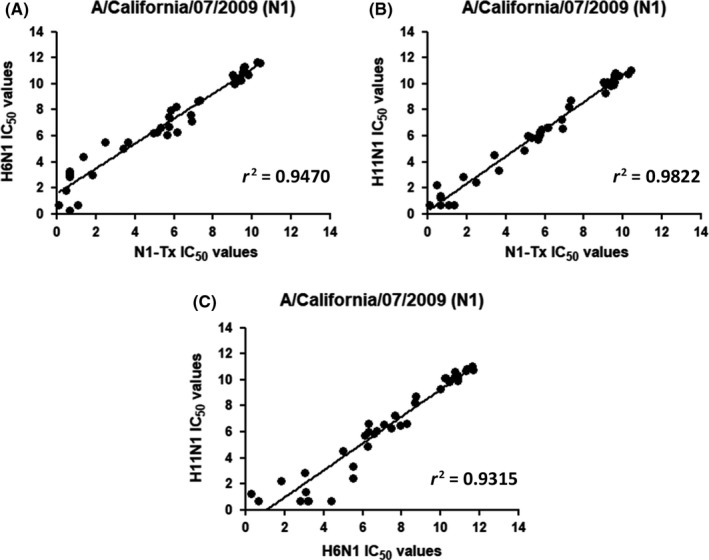
Comparison between (A) wild‐type N1‐Tx/H6N1, (B) wild‐type N1‐Tx/H11N1 PV, and (c) H6N1/H11N1 PV, IC50 titers. Results are represented as Log2 of the IC50 titers
As expected, the Bland‐Altman analyses performed with 50% end point and IC50 titers are similar (Figures 4 and 6). The Bland‐Altman analysis of IC50 titer differences showed a trend for larger differences measured by the three assays at low titers (Figure 6). This is evident from the titers reported in Table 1; sera 19, 22, and 23 all have low or unmeasurable (<10) titers using PV and N1‐Tx antigens, but a reasonable titer measured in assays using H6N1 as antigen.
Figure 6.
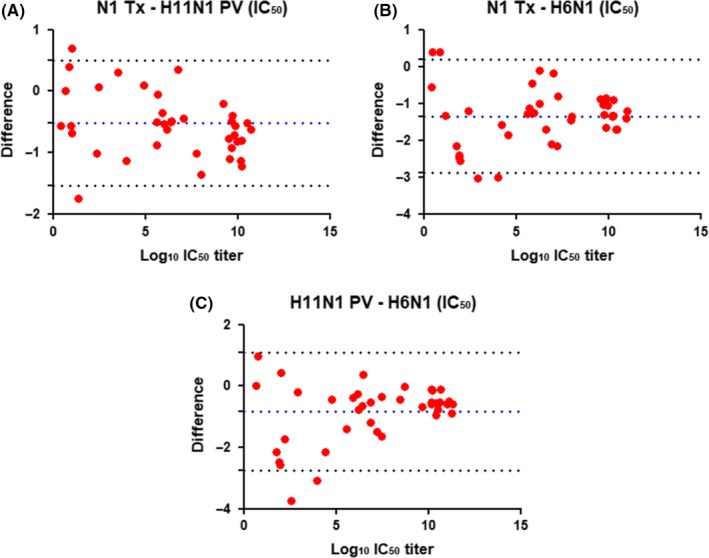
Bland‐Altman plot of the differences between (A) wild‐type N1‐Tx/H11N1 PV, (B) wild‐type N1‐Tx/H6N1 and (C) H11N1 PV/H6N1 (C), IC50s respectively. The mean difference of Log2 IC50 titers measured in assays using different antigens (red bullets) are plotted for each serum. The limit of agreement (±1.96 SD, stippled black line) and the overall mean of the differences (bias, stippled dark blue line) is shown on each graph
3.3. NA inhibition antibody titers measured in ELLA with H6N2 and H11N2 PV sources of antigen are similar
Since an N2‐Tx virus was not available, NI antibody titers measured by ELLA using only H6N2 and H11N2 PV antigens were compared (Figures 7 and 8).
Figure 7.
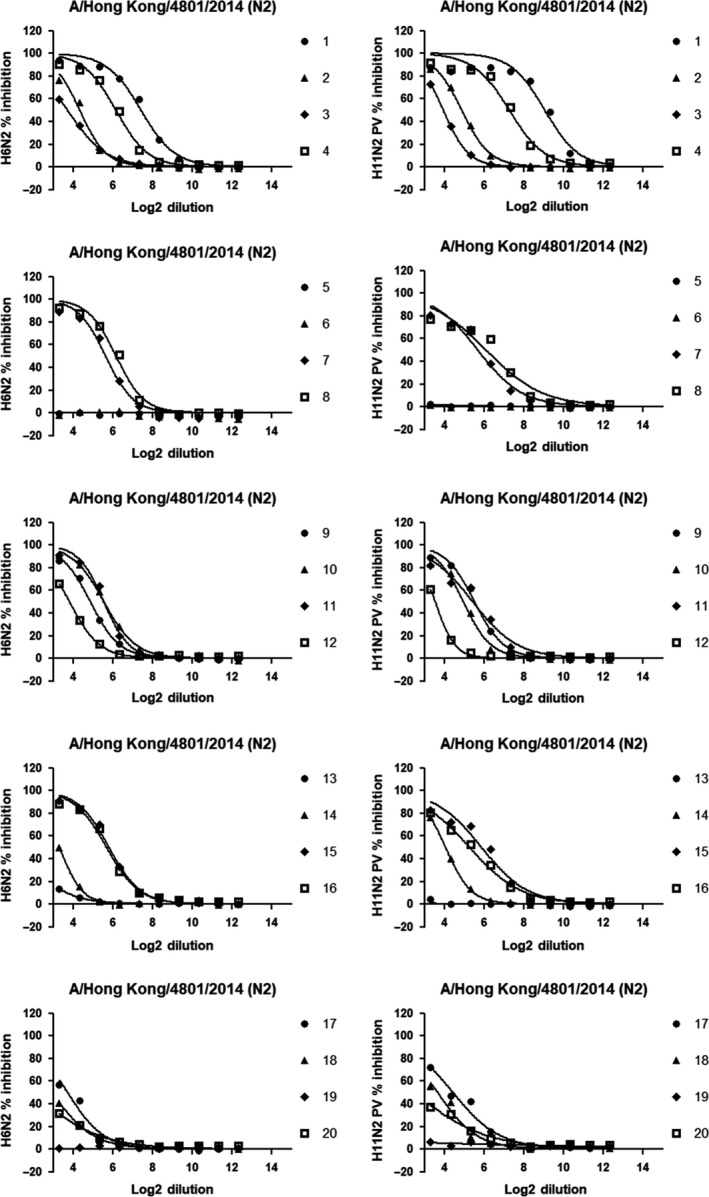
Inhibition curves showing the ability of sera to inhibit the sialidase activity across the plate. Sera from 1 to 20 (corresponding to plates 1‐5) were tested in duplicate (GMTs here reported) against H6N2 reassortant virus (left column) and H11N2 PV (right column). Y axes represent the percentage of inhibition while X axes report the Log2 of the dilution. The prefix "2." in front of every serum number is omitted to improve the readability of the legend
Figure 8.
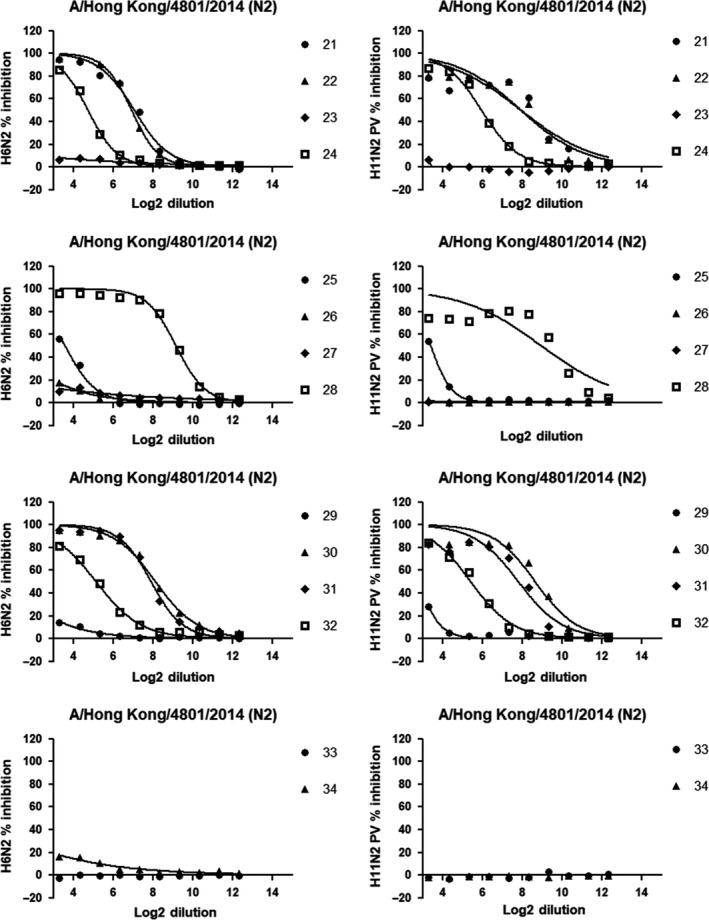
Inhibition curves showing the ability of sera to inhibit the sialidase activity across the plate. Sera from 21 to 34 (corresponding to plates 6‐9) were tested in duplicate (GMTs here reported) against H6N2 reassortant virus (left column) and H11N2 PV (right column). Y axes represent the percent inhibition while X axes report the Log2 of the serum dilution. The prefix "2." in front of every serum number is omitted to improve the readability of the legends
The protocol used for each antigen was the same, with the exception of HRPO concentration which was used at a higher concentration (1:500) for H11N2 PV to improve the signal (internal results, not showed). Results were analyzed as described in the methods.
End point titers measured using H6N2 and H11N2 PV as antigens are similar (2‐fold or less difference) in 88% of cases (30/34), with 19 of 34 titers being identical (56%). Only 4 sera had a 4‐fold difference (12%) in 1 of 2 replicates. Differently from N1 results, there was excellent consistency in both high and low titer replicate measurements within each assay and between assays using different antigens. The end point titers measured in both assays are shown in Table 2.
Table 2.
ELLA assay outcomes (S2.1‐S2.34) deriving from 2 different sources of antigens (N2 NA). Average of the results are also showed
| Test 1 | Test 2 | Test 1 | Test 2 | AVG | AVG | |
|---|---|---|---|---|---|---|
| Serum ID | H11N2‐PV | H11N2‐PV | H6N2 | H6N2 | H11N2‐PV | H6N2 |
| S2.1 | 320 | 640 | 160 | 160 | 453 | 160 |
| S2.2 | 20 | 20 | 20 | 20 | 20 | 20 |
| S2.3 | 10 | 10 | 10 | 10 | 10 | 10 |
| S2.4 | 80 | 160 | 40 | 40 | 113 | 40 |
| S2.5 | 5 | 5 | 5 | 5 | 5 | 5 |
| S2.6 | 5 | 5 | 5 | 5 | 5 | 5 |
| S2.7 | 40 | 40 | 40 | 40 | 40 | 40 |
| S2.8 | 80 | 80 | 80 | 80 | 80 | 80 |
| S2.9 | 40 | 40 | 20 | 20 | 40 | 20 |
| S2.10 | 20 | 20 | 40 | 40 | 20 | 40 |
| S2.11 | 40 | 40 | 40 | 40 | 40 | 40 |
| S2.12 | 10 | 10 | 10 | 10 | 10 | 10 |
| S2.13 | 5 | 5 | 5 | 5 | 5 | 5 |
| S2.14 | 10 | 10 | 5 | 10 | 10 | 7 |
| S2.15 | 80 | 40 | 40 | 40 | 57 | 40 |
| S2.16 | 40 | 20 | 40 | 40 | 28 | 40 |
| S2.17 | 10 | 20 | 10 | 10 | 14 | 10 |
| S2.18 | 10 | 10 | 5 | 5 | 10 | 5 |
| S2.19 | 5 | 5 | 5 | 5 | 5 | 5 |
| S2.20 | 5 | 5 | 5 | 5 | 5 | 5 |
| S2.21 | 320 | 320 | 80 | 160 | 320 | 113 |
| S2.22 | 320 | 160 | 80 | 80 | 226 | 80 |
| S2.23 | 5 | 5 | 5 | 5 | 5 | 5 |
| S2.24 | 40 | 40 | 20 | 20 | 40 | 20 |
| S2.25 | 10 | 10 | 10 | 10 | 10 | 10 |
| S2.26 | 5 | 5 | 5 | 5 | 5 | 5 |
| S2.27 | 5 | 5 | 5 | 5 | 5 | 5 |
| S2.28 | 640 | 640 | 320 | 320 | 640 | 320 |
| S2.29 | 5 | 5 | 5 | 5 | 5 | 5 |
| S2.30 | 320 | 320 | 160 | 160 | 320 | 160 |
| S2.31 | 160 | 160 | 160 | 160 | 160 | 160 |
| S2.32 | 40 | 20 | 20 | 20 | 28 | 20 |
| S2.33 | 5 | 5 | 5 | 5 | 5 | 5 |
| S2.34 | 5 | 5 | 5 | 5 | 5 | 5 |
| HP‐HS‐N2 | 1280 | 1280 | 2560 | 2560 | 1280 | 2560 |
| Minus | 5 | 5 | 5 | 5 | 5 | 5 |
The correlation between the H6N2 and H11N2 PV end point and IC50 titers (Figure 9) shows a good concordance of results, with correlation coefficient of r2 = 0.9303 and r2 = 0.9229, respectively. Interestingly the N2‐specific GMTs measured using these different antigens are closer than N1‐specific GMTs measured in ELLA using H11N1 PV and H6N1 antigens. Nevertheless, the higher variety in titers within the N2 panel has probably determined a lesser consistency between data, affecting the coefficient of correlation.
Figure 9.
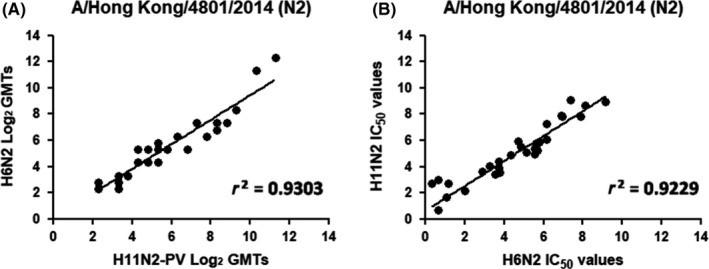
Comparison of NI titers measured in ELLA using H6N2 and H11N2PV antigens. Results are shown as (A) Log2 of the end point titer and (B) IC50 titers
As for N1 titers, the Bland‐Altman analysis on N2 titers show small differences in titers measured using the different antigens when either end point titers or IC50 titers were plotted (Figure 10). Only one serum (10) was greater than the higher limit of agreement, when end point titers measured by H11N2 PV were compared with H6N2 titers. In fact, this is the only case in which the titer measured in an assay using H11N2 PV antigen is 2‐fold higher than the titer measured with H6N2 as antigen. In addition, sera 23 and 29 were greater than the higher limit of agreement, when differences in IC50 titers from assays using H11N2 PV and H6N1 antigens were compared. Both sera 23 and 29 had no measurable NI antibodies (titer of 5) to inhibit H11N2 PV and H6N2 antigens. This explains why there is no difference between the 50% end point titers. However, it impacts the IC50 titer because it is not possible to establish a lower limit of quantitation (LLOQ) from which to determine an accurate IC50 value. The problem of determining an IC50 for samples that have low antibody titers is evident in viewing the H11N2 PV curves for sera 23 and 29 (Figure 8).
Figure 10.
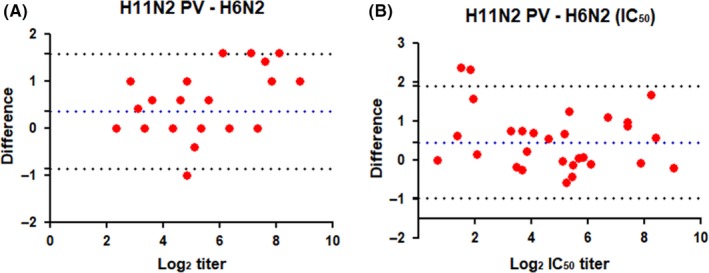
Bland‐Altman plot of the differences between (A) H6N2/H11N2 PV Log2 end point and (B) IC50 titers. The mean difference of each value (red bullets) between the ELLA run with different sources of antigen is plotted, with the limit of agreement (±1.96 SD, stippled black line) and the overall mean of differences (bias, stippled dark blue line) are shown
The correlations of titers were also evaluated by Spearman rank analysis for both N1 and N2 assays. As shown in Table 3, all the results showed good correlation when either IC50 or end point titers were evaluated.
Table 3.
Correlation coefficients of Spearman rank and regression analyses of end‐point and IC50 titres measured assays using different antigen sources
| Antigen | Spearman rank | Linear regression method | ||
|---|---|---|---|---|
| End point | IC50 | End point | IC50 | |
| H6N1/H11N1 | 0.9586 | 0.9665 | 0.9414 | 0.9315 |
| H6N1/N1‐Tx | 0.9631 | 0.9750 | 0.9430 | 0.9470 |
| H11N1/N1‐Tx | 0.9822 | 0.9783 | 0.9723 | 0.9822 |
| H6N2/H11N2 | 0.9668 | 0.9569 | 0.9303 | 0.9229 |
In conclusion, measurement of NI antibody titers against N1 and N2 antigens by ELLA demonstrate comparable results using PV or Triton X‐100‐disrupted virions and the gold‐standard H6 reassortant viruses.
4. DISCUSSION
This is the first study that compares NI antibody titers from assays employing three different sources of NA. The study included panels of sera tested against N1 and N2 antigens in the form of whole influenza virus and lentivirus pseudotype viruses with mismatched HAs, as well as Triton X‐100‐disrupted wild‐type H1N1 influenza virus. A previous study was conducted comparing reassortant mismatched viruses and PV as sources of antigen,22 but due to the different subgroups of NA used, a direct comparison of antigen equivalence was not possible at that time.
Treatment of N2 with Triton X‐100 was not optimal and unfortunately did not result in enzymatic activity; therefore, this antigen could not be included in the study. Wild‐type virus A/Hong Kong/4801/2014 (H3N2) was treated to different Tx concentrations, at different temperatures and at different incubation times, but all of them resulted in no NA activity. Additional investigations need to identify optimal conditions for Triton X‐100 treatment of influenza viruses that retain NA activity. This may include evaluating calcium concentration and a wider pH ranges in buffer and further detergents.
Each serum (panel N1 or N2) was run twice within each plate (one reportable value generated) against one source of antigen per day, in two different days. The raw data obtained were evaluated as end point titers and IC50 titers. The linear regression, Spearman rank, and Bland‐Altman analyses were employed to assess the comparability of results. The correlation coefficients for all comparisons were high (Table 3), suggesting the suitability of performing ELLA with any of these antigen sources. As observed from the Bland‐Altman analyses, titers measured against N2 antigens were in better agreement than N1 titers measured using H6N1 and H11N1 PV antigens. This suggests the N1 assays did not have equivalent sensitivity. This may be a result of using different absolute amounts of NA in each assay or the impact of extrinsic factors on assay performance. Further studies are needed to examine the reason for higher titers being measured using H6N1 as the antigen. In fact, it can either depend on different antigen accessibility of antibodies or different sensitivity of the assay.19 Although a 4‐fold increase is usually considered seroconversion when pre‐ and post‐vaccination sera are evaluated according to international harmonization guidelines, these assay still need to be validated to draw more robust conclusions. Multiple runs with the same panels of sera should ensure stronger reproducibility data in support of it.
Lentiviral PVs are a chimeric surrogate for influenza virus that can be employed to assess antibodies against NA without safety concerns. Even though avian HAs (ie, H11, but other non‐human HA can be co‐expressed) are expressed on its surface, there is very low risk of infection to avian species or humans. The HA subtype can easily be switched to co‐express a different avian HA with human NA if needed, providing a practical means to perform assays without the need for generating reassortant influenza viruses that need to be handled more stringently.21, 25 A previous comparison between NI titers using H11N1 and N1 only PVs in ELLA highlighted differences in titers.22 Whether this was due to PV stability, HA serum inhibition, or interference by antibodies that bind HA stem19 is unclear and should be further investigated.
Additional analysis on NA content and activity of the three sources of antigens would help optimize their use in ELLA. For example, scanning electron microscopy (SEM) or transmission electron microscopy (TEM) would better characterize the sources of antigen and their structure. Beside this, further comparisons to evaluate the applicability of our findings to other strains and subtypes of NAs would strengthen the results of our study, particularly if performed in multiple laboratories.
In conclusion, NA inhibition antibody titers measured in ELLA performed with three different sources of antigen are similar and suggest lentiviral PV can be used to evaluate anti‐neuraminidase responses. Further analyses with additional N1 and N2 strains and subtypes to strengthen this finding will be of value.
ACKNOWLEDGEMENTS
We declare no conflict of interest. FB, LP, and AM have designed the experiments and performed setup experiments. FB and LP performed the experiments; statistical evaluation was performed by FB and SV under the supervision of GL and EM. ME, LC, and JG provided the reassortant inactivated virus and contributed to the critical evaluation of the experiments. We thank St Jude Children's Research Hospital (Memphis, TN) for the kind gift of plasmids that were used to generate the reassortant influenza viruses.
Biuso F, Palladino L, Manenti A, et al. Use of lentiviral pseudotypes as an alternative to reassortant or Triton X‐100‐treated wild‐type Influenza viruses in the neuraminidase inhibition enzyme‐linked lectin assay. Influenza Other Respi Viruses. 2019;13:504–516. 10.1111/irv.12669
REFERENCES
- 1. Air GM. Influenza neuraminidase. Influenza Other Respi Viruses. 2012;6:245‐256. [DOI] [PMC free article] [PubMed] [Google Scholar]
- 2. Mitnaul LJ, Castrucci MR, Murti KG, Kawaoka Y. The Cytoplasmic Tail of Influenza A Virus Neuraminidase (NA) Affects NA Incorporation into Virions, Virion Morphology, and Virulence in Mice but Is Not Essential for Virus Replication. J Virol. 1996;70:873‐879. [DOI] [PMC free article] [PubMed] [Google Scholar]
- 3. Yang J‐R, Huang Y‐P, Chang F‐Y, et al. Characterization of oseltamivir‐resistant influenza A(H1N1)pdm09 viruses in Taiwan in 2009–2011. J Med Virol. 2013;85:379‐387. [DOI] [PubMed] [Google Scholar]
- 4. Getie‐Kebtie M, Sultana I, Eichelberger M, Alterman M. Label‐free mass spectrometry‐based quantification of hemagglutinin and neuraminidase in influenza virus preparations and vaccines. Influenza Other Respi Viruses. 2013;7:521‐530. [DOI] [PMC free article] [PubMed] [Google Scholar]
- 5. Su B, Wurtzer S, Rameix‐Welti M‐A, et al. Enhancement of the influenza a hemagglutinin (HA)‐mediated cell‐cell fusion and virus entry by the viral neuraminidase (NA). PLoS ONE. 2009; 4(12):e8495. [DOI] [PMC free article] [PubMed] [Google Scholar]
- 6. Tong N, Nobusawa E, Morishita M, Nakajima S, Nakajima K. M protein correlates with the receptor‐binding specificity of haemagglutinin protein of reassortant influenza A (H1N1) virus. J Gen Virol. 1998;79:2425‐2434. [DOI] [PubMed] [Google Scholar]
- 7. Sung JC, Van Wynsberghe AW, Amaro RE, Li WW, Andrew MJ. Role of secondary sialic acid binding sites in influenza N1 neuraminidase. J Am Chem Soc. 2010;132:2883‐2885. [DOI] [PMC free article] [PubMed] [Google Scholar]
- 8. Lin YP, Gregory V, Collins P, et al. Neuraminidase receptor binding variants of human influenza A(H3N2) viruses resulting from substitution of aspartic acid 151 in the catalytic site: A role in virus attachment? J Virol. 2010;84:6769‐6781. [DOI] [PMC free article] [PubMed] [Google Scholar]
- 9. Hassantoufighi A, Zhang H, Sandbulte M, et al. A practical influenza neutralization assay to simultaneously quantify hemagglutinin and neuraminidase‐inhibiting antibody responses. Vaccine. 2010;28:790‐797. [DOI] [PubMed] [Google Scholar]
- 10. Couch RB, Atmar RL, Franco LM, et al. Antibody correlates and predictors of immunity to naturally occurring influenza in humans and the importance of antibody to the neuraminidase. J Infect Dis. 2013;207:974‐981. [DOI] [PMC free article] [PubMed] [Google Scholar]
- 11. Murphy BR, Kasel JA, Chanock RM. Association of serum anti‐neuraminidase antibody with resistance to influenza in man. N Engl J Med. 1972;286:1329‐1332. [DOI] [PubMed] [Google Scholar]
- 12. Marcelin G, Sandbulte MR, Webby RJ. Contribution of antibody production against neuraminidase to the protection afforded by influenza vaccines. Rev Med Virol. 2012;22:267‐279. [DOI] [PMC free article] [PubMed] [Google Scholar]
- 13. Memoli MJ, Shaw PA, Han A, et al. Evaluation of antihemagglutinin and antineuraminidase antibodies as correlates of protection in an influenza A/H1N1 virus healthy human challenge model. MBio. 2016;7:1‐12. [DOI] [PMC free article] [PubMed] [Google Scholar]
- 14. Kilbourne ED, Laver WG, Schulman JL, Webster RG. Antiviral activity of antiserum specific for an influenza virus neuraminidase. J Virol. 1968;2:281‐288. [DOI] [PMC free article] [PubMed] [Google Scholar]
- 15. Lambré CR, Terzidis H, Greffard A, Webster RG. An enzyme‐linked lectin assay for sialidase. Clin Chim Acta. 1991;198:183‐193. [DOI] [PubMed] [Google Scholar]
- 16. Cate TR, Rayford Y, Niño D et al. NIH Public Access. Vaccine. 2011;193:118‐125. [Google Scholar]
- 17. Couzens L, Gao J, Westgeest K, et al. An optimized enzyme‐linked lectin assay to measure influenza A virus neuraminidase inhibition antibody titers in human sera. J Virol Methods. 2014;210:7‐14. [DOI] [PubMed] [Google Scholar]
- 18. Eichelberger MC, Couzens L, Gao Y, et al. Comparability of neuraminidase inhibition antibody titers measured by enzyme‐linked lectin assay (ELLA) for the analysis of influenza vaccine immunogenicity. Vaccine. 2016;34:458‐465. [DOI] [PMC free article] [PubMed] [Google Scholar]
- 19. Rajendran M, Nachbagauer R, Ermler ME, et al. Analysis of anti‐influenza virus neuraminidase antibodies in children, adults, and the elderly by ELISA and enzyme inhibition: Evidence for original antigenic sin. MBio. 2017;8:1‐12. [DOI] [PMC free article] [PubMed] [Google Scholar]
- 20. Jonges M, Liu WM, van der Vries E, et al. Influenza virus inactivation for studies of antigenicity and phenotypic neuraminidase inhibitor resistance profiling. J Clin Microbiol. 2010;48:928‐940. [DOI] [PMC free article] [PubMed] [Google Scholar]
- 21. Prevato M, Cozzi R, Pezzicoli A, et al. An innovative pseudotypes‐based Enzyme‐Linked Lectin Assay for the measurement of functional anti‐neuraminidase antibodies. PLoS ONE. 2015;10:e0135383. [DOI] [PMC free article] [PubMed] [Google Scholar]
- 22. Biuso F, Carnell G, Montomoli E, Temperton NJ.The study of antibody responses to influenza neuraminidase using a lentiviral pseudotype based ELLA. bioRxiv January 2017.
- 23. Nefkens I, Garcia J‐M, Ling CS, et al. Hemagglutinin pseudotyped lentiviral particles: Characterization of a new method for avian H5N1 influenza sero‐diagnosis. J Clin Virol. 2007;39:27‐33. [DOI] [PubMed] [Google Scholar]
- 24. Temperton NJ, Hoschler K, Major D, et al. A sensitive retroviral pseudotype assay for influenza H5N1‐neutralizing antibodies. Influenza Other Respi Viruses. 2007;1:105‐112. [DOI] [PMC free article] [PubMed] [Google Scholar]
- 25. Biuso F, Carnell G, Montomoli E, &Temperton N. A lentiviral pseudotype ELLA for the measurement of antibodies against influenza neuraminidase. Bio‐Protocol. 2018;8(14):1–15. [Google Scholar]
- 26. Chen BJ, Leser GP, Morita E, Lamb RA. Influenza virus hemagglutinin and neuraminidase, but not the matrix protein, are required for assembly and budding of plasmid‐derived virus‐like particles. J Virol. 2007;81:7111‐7123. [DOI] [PMC free article] [PubMed] [Google Scholar]
- 27. Martin Bland J, Altman DG. Statistical methods for assessing agreement between two methods of clinical measurement. Lancet. 1986;327:307‐310. [PubMed] [Google Scholar]
- 28. Laurie KL, Engelhardt OG, Wood J, et al. International laboratory comparison of influenza microneutralization assays for A(H1N1)pdm09, A(H3N2), and A(H5N1) influenza viruses by CONSISE. Clin Vaccine Immunol. 2015;22:957‐964. [DOI] [PMC free article] [PubMed] [Google Scholar]
- 29. Gao J, Couzens L, Eichelberger MC. Measuring influenza neuraminidase inhibition antibody titers by enzyme‐linked lectin assay. J Vis Exp. 2016;e54573‐e54573. [DOI] [PMC free article] [PubMed] [Google Scholar]


