

Abstract
Background and Purpose
A second‐generation antihistamine, terfenadine, is known to induce arrhythmia by blocking hERG channels. In this study, we have shown that terfenadine also inhibits the activity of G‐protein‐gated inwardly rectifying K+ (GIRK) channels, which regulate the excitability of neurons and cardiomyocytes. To clarify the underlying mechanism(s), we examined the effects of several antihistamines on GIRK channels and identified the structural determinant for the inhibition.
Experimental Approach
Electrophysiological recordings were made in Xenopus oocytes and rat atrial myocytes to analyse the effects of antihistamines on various GIRK subunits (Kir3.x). Mutagenesis analyses identified the residues critical for inhibition by terfenadine and the regulation of ion selectivity. The potential docking site of terfenadine was analysed by molecular docking.
Key Results
GIRK channels containing Kir3.1 subunits heterologously expressed in oocytes and native GIRK channels in atrial myocytes were inhibited by terfenadine and other non‐sedating antihistamines. In Kir3.1 subunits, mutation of Phe137, located in the centre of the pore helix, to the corresponding Ser in Kir3.2 subunits reduced the inhibition by terfenadine. Introduction of an amino acid with a large side chain in Kir3.2 subunits at Ser148 increased the inhibition. When this residue was mutated to a non‐polar amino acid, the channel became permeable to Na+. Phosphoinositide‐mediated activity was also decreased by terfenadine.
Conclusion and Implications
The Phe137 residue in Kir3.1 subunits is critical for inhibition by terfenadine. This study provides novel insights into the regulation of GIRK channels by the pore helix and information for drug design.
Abbreviations
- Ci‐VSP
Ciona intestinalis voltage sensing phosphatase
- DIDS
4,4′‐diisothiocyano‐2,2′‐stilbenedisulfonic acid
- GIRK
G‐protein‐gated inwardly rectifying K+
- hERG
human ether‐a‐go‐go‐related gene
- INa/IK
ratio of Na+ current to K+ current
- PIP2
phosphatidylinositol‐4,5‐biphosphate
- PNa/PK
ratio of Na+ permeability to K+ permeability
- TMs
transmembrane domains
What is already known
A non‐sedating antihistamine, terfenadine, is known to induce severe arrhythmia by blocking hERG channels.
What this study adds
Terfenadine blocks G‐protein‐gated inwardly rectifying K+ (GIRK) channels, particularly those containing Kir3.1 subunits.
An amino acid residue located in the pore helix is critical for this block.
What is the clinical significance
This study provides us with information for design of GIRK‐targeting drugs.
1. INTRODUCTION
G‐protein‐gated inwardly rectifying K+ (GIRK) channels are important cellular modulators that regulate neuronal excitability, heartbeat, and islet hormone secretion (Hibino et al., 2010). There are homotetrameric and heterotetrameric complexes of GIRK channels expressed in native tissues, and they are composed of different combinations of the four GIRK subunits, Kir3.1, Kir3.2, Kir3.3, and Kir3.4 (Krapivinsky et al., 1995; Kubo, Reuveny, Slesinger, Jan, & Jan, 1993; Lesage et al., 1994; Liao, Jan, & Jan, 1996). GIRK channels are known to be activated by Gβγ following the stimulation of a Gi/o‐coupled GPCR (Clapham & Neer, 1993; Logothetis, Kurachi, Galper, Neer, & Clapham, 1987; Reuveny et al., 1994). We had screened a small‐molecule library to identify ligands of a Gi/o‐coupled orphan GPCR by monitoring GIRK currents. We happened to find some compounds that regulated the GIRK current even in the absence of the orphan GPCR, suggesting that these compounds act on GIRK channel directly, and one of them was the antihistamine drug, terfenadine.
Terfenadine is a second‐generation antihistamine which targets the histamine H1 receptor and has a piperidine‐based chemical structure (Figure 1a; Woodward & Munro, 1982). H1 receptor antagonists are used in the treatment of allergic diseases, including rhinitis, conjunctivitis, and chronic urticaria, through stabilizing the inactive conformation of the H1 receptor (Simons & Simons, 2008). Sedation is a well‐known side effect of the first‐generation (sedating) antihistamines. The second‐generation antihistamines, which are less capable of crossing the blood–brain barrier compared to the first‐generation drugs, are classified as non‐sedating antihistamines (Hey et al., 1995). However, overdose of these drugs still cause side effects on the CNS (Hindmarch, Johnson, Meadows, Kirkpatrick, & Shamsi, 2001; Holgate et al., 2003). Terfenadine has been withdrawn from clinical use in the late 1990s due to its cardiac toxicity through its inhibition of the human ether‐a‐go‐go‐related gene (hERG/Kv11.1) channel and the ATP‐sensitive K+ channels (Kir6.x) in cardiomyocytes, resulting in arrhythmia (Crumb, 2000; Gottlieb, 1999; Jackman et al., 1984; Nishio et al., 1998; Taglialatela et al., 1999). However, there is no information about the effects of terfenadine on GIRK channels, which are also expressed in mammalian brain and heart and could be a potential target, producing adverse effects.
Figure 1.

Effects of terfenadine on GIRK currents expressed in Xenopus oocytes. (a) Chemical structure of terfenadine. (b–e) Currents were recorded in a high K+ (96 mM) solution with a protocol shown above and repeated every 5 s. Recorded in the absence and presence of 0.01, 0.1, 1, 10, 100, and 300 μM of terfenadine from oocytes expressing (b) Kir3.1 + Kir3.2, (c) Kir3.1 + Kir3.4, (d) Kir3.2 alone, and (e) Kir3.4 + Gβ1 + Gγ2. Left panels show the current traces, and right panels show the time courses of current change at −100 and +40 mV. (f) Dose–inhibition relationships were plotted by calculating the ratio of current amplitude in the presence of a certain concentration of terfenadine to the current before the application of terfenadine at −100 mV. The current amplitude in the ND96 solution was subtracted to remove leak current, and the basal current was normalized to 1. Data show the means ± SD, n = 6 for each from N = 7 frogs
As the effect of terfenadine on GIRK channels and its inhibitory mechanism are unknown, we investigated how terfenadine suppressed the activity of GIRK channels. By electrophysiological recordings and mutagenesis analyses in Xenopus oocytes, we demonstrated the selective effect of terfenadine and other antihistamines on different GIRK subunits and identified a structural determinant underlying the inhibitory mechanism.
2. METHODS
2.1. Ethical approval
All animal care and experimental procedures were approved by the Animal Care Committee of the National Institutes of Natural Sciences (Japan) and were conducted in accordance with its guidelines. Animal studies are reported in compliance with the ARRIVE guidelines (Kilkenny et al., 2010; Mcgrath & Lilley, 2015).
2.2. Mutagenesis and cRNA preparations
Preparations of Kir3.x subunit mutants and their cRNAs were performed as described previously (Chen, Tateyama, Fukata, Uesugi, & Kubo, 2017). Briefly, point mutations in Kir3.1, Kir3.2, and Kir3.2–Kir3.1 dimers were introduced by PCR using PfuUltra II Fusion HS DNA Polymerase kit (Agilent Technologies) and the primers listed in Table S1, and then the introduced mutations were verified by DNA sequencing. After linearization of cDNA by restriction enzymes, complementary RNAs were transcribed using mMessage mMachine kit (Ambion). The cRNAs of rat Kir3.1 (12.5 ng·oocyte−1 for the wild type; 12.5–25 ng·oocyte−1 for mutants), mouse Kir3.2 (6.25 ng·oocyte−1 for the wild type; 2.5–12.5 ng·oocyte−1 for mutants), rat Kir3.4 (12.5 ng·oocyte−1), bovine Gβ1 (12.5 ng·oocyte−1), bovine Gγ2 (12.5 ng·oocyte−1), porcine muscarinic M2 receptor (6.25 ng·oocyte−1), and Ciona intestinalis voltage sensing phosphatase (Ci‐VSP, 12.5 ng·oocyte−1) were used in the present study. For a few of Kir3.2 mutants which showed a very small current in oocytes, a high concentration of cRNAs (>50 ng·oocyte−1) was injected into the oocytes to confirm the limitation of membrane expression of protein. Kir3.2–Kir3.1 dimers were constructed as described previously (Tateyama & Kubo, 2018). The C‐terminal tail of the mouse Kir3.2 and the N‐terminal tail of the rat Kir3.1 were ligated by a glycine‐rich linker composed of 34 amino acid residues (TRGGSGGSGGSGGSGG‐TRGGSGGSGGSGGSGGGS).
2.3. Oocyte preparations
Oocytes from about 50 adult female Xenopus laevis (RRID:XEP_Xla100, purchased from Hamamatsu Seibutsu Kyouzai, Hamamatsu, Japan), a commonly used system for heterologous expression system of proteins, were used in electrophysiological experiments. Ten to 15 frogs (90–120 g each) were housed in each square water tank with sufficient space, four tanks in total, and normal feeding on a light–dark cycle (12:12 hr) at 18°C in the Aquatic Facility of National Institutes of Natural Sciences (Japan). Surgical procedures and care were performed as described previously (Chen, Tateyama, et al., 2017). Frogs were anaesthetized in a cold water bath with 0.15% tricaine (Sigma‐Aldrich) for 30 min via skin absorption, and the depth of anaesthesia was confirmed by checking the disappearance of withdrawal reflexes. Then a small incision was made in abdomen on ice to take the oocytes to a dish filled with frog Ringer's solution containing 88‐mM NaCl, 1‐mM KCl, 2.4‐mM NaHCO3, 0.3‐mM Ca (NO3)2, 0.41‐mM CaCl2, 0.82‐mM MgSO4, and 15‐mM HEPES, pH 7.6 with NaOH. After surgery, frogs were returned to another water tank for post‐anaesthesia recovery. The frogs recovered within 30 min and did not show signs of distress. Each frog was allowed to recover for 3 months until the next surgery and then killed by double pithing under anaesthesia using tricaine after emptying of the oocytes. After treatment of 2 mg·ml−1 collagenase type I (Sigma‐Aldrich) for 3–4 hr, the follicular membrane of oocytes was removed manually by forceps. Oocytes were injected with 50 nl of cRNA solution and then incubated in frog Ringer's solution with 0.1% penicillin–streptomycin (Sigma‐Aldrich) at 17°C. After 1–5 days, oocytes injected with cRNA were used for electrophysiological recordings.
2.4. Isolation of atrial myocytes
Four adult male Wistar rats (RRID:RGD_2314928, 8 weeks of age, 180–200 g each, SPF) were purchased from Japan SLC, Inc. (Hamamatsu, Japan). These rats are a commonly used animal model for cardiomyocyte isolation, to be used in electrophysiological experiments. Rats were housed in square cages with wood shavings, two rats per cage, on a light–dark cycle (12:12 hr) at 23 ± 1°C and fed noramal rat chow in the Animal Facility of the National Institute for Physiological Sciences (NIPS, Japan). Atrial myocytes were isolated as described previously (Chen, Furutani, Inanobe, & Kurachi, 2014; Chen, Furutani, & Kurachi, 2017). Briefly, rats were anaesthetized by i.p. injection of 10 mg·kg−1 xylazine and 20–25 mg·kg−1 pentobarbital for 20 min after i.p. injection of 1,000 U·kg−1 heparin. The depth of anaesthesia was confirmed by checking the disappearance of pedal withdrawal reflexes. Then the rat was killed by removing the heart from the thoracic cavity under anaesthesia. The heart was connected to a modified Langendorff perfusion system by insertion of a cannula into the aorta and retrogradely perfused through coronary arteries with a solution containing 0.6 mg·ml−1 collagenase type II (Worthington) and 0.2 mg·ml−1 protease type XIV (Sigma‐Aldrich) dissolved in a Ca2+‐free Tyrode's solution (137‐mM NaCl, 5.4‐mM KCl, 1‐mM MgCl2, 10‐mM glucose, and 10‐mM HEPES, pH 7.4 with NaOH) at 37°C for 25–30 min. The digested tissue was washed with KB solution (composition: 10‐mM taurine, 10‐mM oxalic acid, 70‐mM K‐glutamate, 25‐mM KCl, 10‐mM KH2PO4, 11‐mM glucose, 0.5‐mM EGTA, and 10‐mM HEPES, pH 7.3 with KOH). Atria were cut into pieces with scissors and transferred to a dish. Dissociated atrial myocytes were incubated in the KB solution and used on the day.
2.5. Electrophysiological recordings
Membrane currents of oocytes were recorded by two‐electrode voltage clamp at 22–25°C with two glass electrodes filled with a pipette solution containing 3‐m potassium acetate and 10‐mM KCl and had a resistance of 0.2–0.5 MΩ. Various solutions were used in the recordings as follows: a high K+ solution containing 96‐mM KCl, 3‐mM MgCl2, and 5‐mM HEPES, pH 7.5 with KOH; an ND96 solution containing 96‐mM NaCl, 2‐mM KCl, 1‐mM MgCl2, 1.8‐mM CaCl2, and 5‐mM HEPES, pH 7.5 with NaOH; a Ca2+‐free ND96 solution containing 96‐mM NaCl, 2‐mM KCl, 3‐mM MgCl2, and 5‐mM HEPES, pH 7.5 with NaOH; and an NMDG solution containing 96‐mM N‐methyl‐d‐glucamine Cl, 2‐mM KCl, 3‐mM MgCl2, and 5‐mM HEPES, pH 7.5 with KOH. Data acquisition was performed by an oocyte clamp amplifier (OC‐725C, Warner Instruments), a digital converter (Digidata 1440, Molecular Devices), and pCLAMP 10.5 software (RRID:SCR_011323, Molecular Devices). Compounds were applied to the extracellular solution which perfused the cells in a recording chamber, using a tubing pump (IPC‐4, Ismatec, 67 μl·s−1) for input and a suction pipette by pressure for outlet. Compounds were washed out by the same perfusion system.
Membrane currents of atrial myocytes were recorded by whole‐cell patch‐clamp at 22–25°C with a glass electrode filled with a pipette solution containing 130‐mM KCl, 5‐mM Na2ATP, 4‐mM MgCl2, 0.1‐mM CaCl2, 3‐mM EGTA, 0.2‐mM GTP, and 10‐mM HEPES (pH 7.4 with KOH), and the electrode resistance was 2–4 MΩ. The bath solution contained 115‐mM NaCl, 20‐mM KCl, 0.53‐mM MgCl2, 1.8‐mM CaCl2, 5.5‐mM glucose, and 5.5‐mM HEPES, pH 7.4 with NaOH. Data acquisition was performed with a low‐pass filter at 2 kHz by a patch‐clamp amplifier (Axopatch200B, Molecular Devices), a digital converter (Digidata 1332A, Molecular Devices), and pCLAMP 9.2 software (RRID:SCR_011323, Molecular Devices). Compounds were applied to the bath solution and perfused to a recording chamber using VC‐8 valve controller (Warner Instruments) and SF‐77B perfusion fast step (Warner Instruments) for inlet and a suction pipette by pressure for outlet. Compounds were washed out by the same perfusion system.
Dose‐dependent inhibitions were measured by sequential application of terfenadine to the extracellular solution. By using SigmaPlot 14 (Hulinks), the recording data were fitted to a Hill equation: y = min + (max − min) / (1 + (x/IC50) ^ (Hillslope)), where x refers to the terfenadine concentration, y refers to the normalized current at a certain concentration, and IC50 is the concentration of terfenadine that generates half‐maximal inhibition. Oocytes with a basal current below 1 μA or above 20 μA were excluded from the data set, to avoid influences from endogenous currents or insufficient voltage clamp.
To evaluate the ion selectivity, a modified K+ bath solution (containing 96‐mM KCl, 3‐mM MgCl2, and 5‐mM HEPES, pH 7.5 with NMDG) and a Na+ bath solution (containing 96‐mM NaCl, 3‐mM MgCl2, and 5‐mM HEPES, pH 7.5 with NMDG) were used. Ion selectivity was determined from the ratio of ionic current INa/IK and the ratio of permeability PNa/PK. The PNa/PK was calculated by a simplified form of the Goldman–Hodgkin–Katz equation (Hille, 1992): ΔE rev = (RT/zF) ln(PNa[Na]o/PK[K]o), where ΔE rev refers to the shift of the reversal potential and [Na]o and [K]o refer to the concentration of extracellular Na+ and K+, respectively.
The polarity scale of Kir3.2 subunit mutants was predicted by Grantham's (1974) method using ProtScale (ExPASy, Swiss Institute of Bioinformatics; Wilkins et al., 1999).
2.6. Molecular docking
The structure of the Kir3.2 subunit (residues 53–378) was retrieved from the Protein Data Bank (4KFM, a Kir3.2‐Gβγ complex with Na+ and phosphatidylinositol‐4,5‐biphosphate [PIP2] embedded). The structure of the Kir3.1 subunit (residues 44–367) was generated using the automated protein structure homology modelling web server Swiss‐Model (Waterhouse et al., 2018) and subsequently minimized by a steepest decent energy minimization using the amber ff14SB force field. Model quality was assessed using MolProbity (RRID:SCR_014226, Chen et al., 2010) and QMEAN (Studer, Biasini, & Schwede, 2014). QMEAN scores above 0.8 were observed for most model regions, with a few notable deviations at the channel turrets, which were excluded from subsequent docking analysis. The steric structure of compounds was retrieved from the DrugBank database (RRID:SCR_002700, Wishart et al., 2006). Terfenadine molecule was docked onto a Kir3.1/Kir3.2 tetramer model using two different methods: (a) the autodock‐vina chimera plugin (Pettersen et al., 2004), using a 50X50X40Å receptor search volume centred at the bottom of the selectivity filter (excluding the outer turret region and the large cytoplasmic domain), and (b) the Swiss‐dock web service (Grosdidier, Zoete, & Michielin, 2011). In both cases, the top 10 solutions/clusters have partitioned between the two prominent binding modes shown in Figure 9.
Figure 9.
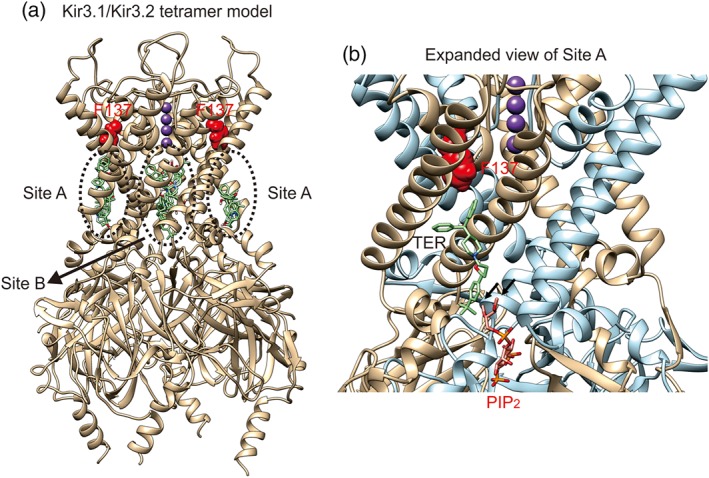
Docking simulations predict two distinct binding modes of terfenadine (TER) to Kir3.1/Kir3.2 subunits. (a) The protein scaffold of a Kir3.1/Kir3.2 heterotetramer is rendered in ribbons; the 10 TER docking poses with the highest scores are rendered in sticks. K+ ions in the pore are shown as purple spheres. The two putative docking sites for TER, Site A and Site B, are indicated. Red colour displays Phe137 in Kir3.1. (b) Zoom‐in on a TER molecule (green) docked at Site A on the left side in panel (a), in a cleft formed between a Kir3.1 (tan) and Kir3.2 (light blue) monomers. A PIP2 molecule bound at an adjacent pocket is shown, based on the structural alignment with Kir3.2 crystal structure. Black arrows indicate the positions of the missing stearic and arachidonic acids moieties on the PIP2 molecule scaffold
2.7. Data and statistical analysis
The data and statistical analysis comply with the recommendations on experimental design and analysis in pharmacology (Curtis et al., 2018). All data were analysed by Clampfit 10.5 (RRID: SCR_011323, Molecular Devices) and SigmaPlot 14 (RRID:SCR_003210, Hulinks) and are shown as mean ± SD from n single cells. We did not perform power analysis, randomization, or blinding of the samples under recording. All experiments from oocytes were performed with the cell number of n ≥ 5 for each group from N ≥ 1 frog(s), which is considered to be sufficient for the evaluation of statistical difference in our electrophysiological recordings. Data with a basal current out of the range between 1 and 20 μA, except for Figure S4, were excluded from the data set, and this caused the variable group sizes. For experiments using atrial myocytes, n cells from N = 4 rats is considered to be independent measurements, and most of the data set were n ≥ 5, except for Figure S2 (n = 4 for one group because of its high reproducibility). Statistical differences were evaluated when n ≥ 5 using Tukey's multiple comparison test following one‐way ANOVA to compare all pairwise and Dunnett's multiple comparison test following one‐way ANOVA to compare every group with the control group. Post hoc tests were conducted only if F was significant and there was no variance inhomogeneity. Paired t test was used to compare the current amplitude before and after the application of a compound. Unpaired t test was used to compare two independent groups. Statistical significance was judged when the P values were less than 0.05.
2.8. Materials
A small‐molecule library, which comprises over 1,000 compounds, in one of the author's laboratory (M.U.) was used for the initial screening towards searching ligand(s) of an orphan Gi/o‐coupled GPCR. ACh, ivermectin, terfenadine, astemizole, and 4,4′‐diisothiocyano‐2,2′‐stilbenedisulfonic acid (DIDS) were purchased from Sigma‐Aldrich. Loratadine, desloratadine, ebastine, and fexofenadine hydrochloride were purchased from Tokyo Chemical Industry. ACh was dissolved in water, and the others were dissolved in DMSO, except for terfenadine. Due to a low solubility of terfenadine in DMSO, methanol was used as the solvent to give a higher solubility for dose–response evaluation. Chemical compounds were diluted to a final concentration in the extracellular solution in which the solvent concentration was ≤0.6% in experiments. The vehicle alone had negligible effects on GIRK currents.
2.9. Nomenclature of targets and ligands
Key protein targets and ligands in this article are hyperlinked to corresponding entries in http://www.guidetopharmacology.org, the common portal for data from the IUPHAR/BPS Guide to PHARMACOLOGY (Harding et al., 2018), and are permanently archived in the Concise Guide to PHARMACOLOGY 2017/18 (Alexander, Christopoulos et al., 2017; Alexander, Striessnig et al., 2017).
3. RESULTS
3.1. Terfenadine selectively inhibits the current of channels containing Kir3.1 subunits in Xenopus oocytes
To characterize the terfenadine‐mediated inhibition of GIRK current, we examined the effect of terfenadine on different GIRK subtypes by two‐electrode voltage clamp in a high K+ solution (96‐mM K+). We first tested 0.01–300 μM of terfenadine in oocytes heterologously expressing heterotetrameric complexes, Kir3.1/Kir3.2 or Kir3.1/Kir3.4 subunits, and observed that application of terfenadine reduced the inward currents at −100 mV in a dose‐dependent manner (Figure 1b,c). We next tested 0.1–300 μM of terfenadine in oocytes expressing Kir3.2 subunits alone and observed a relatively small reduction in current amplitude, compared with its effects on the Kir3.1/Kir3.2 or Kir3.1/Kir3.4 complexes (Figure 1d). Oocytes expressing Kir3.4 subunits alone showed negligible current (Figure S1A), suggesting a low activity of homotetrameric Kir3.4 channels, and this is consistent with previous studies (Krapivinsky et al., 1995; Kubo & Iizuka, 1996). By co‐expression of Kir3.4 subunits with G‐protein β1γ2 subunits (Gβ1γ2), we observed a detectable inward current at −100 mV and a small current reduction by application of terfenadine (Figure 1e).
The dose–inhibition relationship of terfenadine on GIRK currents was calculated from the current amplitude in the presence of a certain concentration of terfenadine, and the basal current was normalized to 1 to control the variation of expression level in each single oocyte (Figures 1f and S1B–E). Curves of the concentration–inhibition relationship were generated by log10 of the concentration of terfenadine. A current amplitude recorded in the ND96 extracellular solution (containing 96‐mM Na+ and 2‐mM K+) was subtracted to remove leak and endogenous currents. By fitting these data to Hill equation, we found that IC50 of terfenadine is 9.8 ± 3.1 μM (Hillslope: 0.97 ± 0.38) for Kir3.1/Kir3.2 channels, 11.5 ± 1.1 μM (Hillslope: 1.15 ± 0.18) for the Kir3.1/Kir3.4 channels, and 34.6 ± 17.7 μM (Hillslope: 1.00 ± 0.18) for homotetrameric Kir3.2 channels (mean ± SD, n = 6 for each). The IC50 of terfenadine for homotetrameric Kir3.4 channels (with Gβ1γ2) could not be determined due to the solubility limitation of terfenadine in the vehicle. The results show the maximal inhibition in a ranked order as follows: Kir3.1/Kir3.2 ≅ Kir3.1/Kir3.4 > Kir3.2 ≅ Kir3.4. These data show that terfenadine preferentially inhibits the current of Kir3.1 subunit‐containing channels, demonstrating that the Kir3.1 subunits were highly sensitive to terfenadine.
3.2. Terfenadine inhibits ACh‐induced GIRK current in rat atrial myocytes
ACh is a physiological agonist of the M2 receptor, and the ACh‐induced K+ current in atrial myocytes is known to be carried by channels composed of Kir3.1 and Kir3.4 subunits (Krapivinsky et al., 1995). We examined the effect of terfenadine on the native cardiac GIRK currents using freshly isolated atrial myocytes from rats. Application of 1‐μM ACh increased current amplitude in 20‐mM K+ extracellular solution, and the current was time dependently desensitized from the maximal level (Figure 2a). This phenomenon is a well‐known feature of ACh‐induced GIRK current in atrial myocytes (Kurachi, Nakajima, & Sugimoto, 1987). The maximal current amplitude of ACh‐evoked current at −100 mV was normalized as 1, and the normalized current in the absence or presence of inhibitor was calculated at the same time to control the influence of current desensitization (Figure 2e). Current contribution from native GIRK channel was confirmed by application of 3‐μM tertiapin‐Q, a GIRK channel‐specific blocker (Hibino et al., 2010; Jin & Lu, 1999), which completely eliminated the ACh‐induced current (Figure 2b,e). The current was also significantly inhibited by 10–100 μM of terfenadine (Figure 2c–e), confirming that terfenadine also inhibits the native GIRK channel in the rat atrial myocytes.
Figure 2.

Effects of terfenadine on ACh‐induced GIRK currents in the rat atrial myocytes. (a–d) Whole‐cell currents from the rat atrial myocytes were recorded in a 20‐mM K+ Tyrode's solution with a protocol shown above and repeated every 3 s. Recorded in the presence of (a) 1 μM of ACh alone, (b) ACh with 3 μM of tertiapin‐Q (TPN‐Q, a GIRK channel blocker), and ACh with (c) 10 μM or (d) 100 μM of terfenadine (TER). (e) The maximal current amplitude of ACh‐evoked current at −100 mV was normalized as 1, and the current amplitude before application of ACh was subtracted. Normalized current for each group was calculated from current amplitude at −100 mV after application of TPN‐Q or TER for 15 s. For the control group shown in panel (a), the normalized current was calculated at the same timing as the case in panels (b) to (d), and this indicates the time‐dependent desensitization of ACh‐evoked current from the peak level. Data shown are individual values, with means ± SD, n = 5 for each from N = 4 rats. Some of the symbols overlap with each other. *P<0.05, significantly different from control; one‐way ANOVA with Dunnett's multiple comparison test
3.3. Effects of other H1 receptor antagonist antihistamines on GIRK currents
We examined the effects of other H1 receptor antagonists which also belong to the second‐generation and the piperidine‐based antihistamines, including fexofenadine, desloratadine, astemizole, ebastin, and loratadine (Figure 3a). The basal current amplitude was normalized as 100% to control the expression variation of each oocyte (Figure 3b–f). Fexofenadine is an active metabolite of terfenadine; however, we observed that 100 μM of fexofenadine showed almost no effects on the various GIRK complexes (Figure 3b). We tested 100 μM of other drugs and observed that desloratadine inhibited Kir3.1 subunit‐containing complexes markedly and the homomeric Kir3.2 and Kir3.4 channels weakly, and this is similar to the terfenadine effect, suggesting that the Kir3.1 subunit is also sensitive to desloratadine (Figure 3c). Applications of astemizole, ebastine, and loratadine only showed a limited reduction in current amplitude of each of the GIRK complexes, suggesting that the GIRK channel is less sensitive to these drugs (Figure 3d–f). Interestingly, these drugs slightly increased the homomeric Kir3.2 current, suggesting that Kir3.2‐specific amino acid residue(s) may contribute to the increase and this is independent of the mechanism underlying the inhibition. Taken together, the results demonstrate that some of the H1 receptor antagonists also inhibit GIRK current.
Figure 3.

Effects of piperidine‐based antihistamines on GIRK currents. (a) Chemical structure of fexofenadine, desloratadine, astemizole, ebastine, and loratadine. A red dotted circle indicates the structural difference between terfenadine and fexofenadine. (b–f) Inhibition (as %) by each compound on different combinations of GIRK subunits: Kir3.1 + Kir3.2, Kir3.2 alone, Kir3.1 + Kir3.4, and Kir3.4 + Gβ1 + Gγ2. Currents were recorded with a protocol as shown in Figure 1b in the high K+ solution. The current in ND96 solution was subtracted. Inhibition was calculated by the reduction of the current amplitude in the presence of 100 μM of each compound from the current before the application at −100 mV, and the basal current amplitude was normalized as 100%. Data shown are individual values, with means ± SD, n = 5 for each from N = 9 frogs. Some of the symbols overlap with each other. *P<0.05, significantly different as indicated, n.s., not significant; one‐way ANOVA with Tukey's multiple comparison test
We further examined the effect of fexofenadine on native GIRK current in rat atrial myocytes and observed that 10–100 μM of fexofenadine partly inhibited the ACh‐induced K+ current (Figure S2A–C). Elevation of fexofenadine concentration to 1 mM could slightly increase the inhibition of Kir3.1/Kir3.4 channel current in oocytes. When reconstructing the cardiac GIRK current by co‐expression of M2 receptors with Kir3.1/Kir3.4 subunits in oocytes, 10 times higher concentration of fexofenadine showed similar inhibition effect to that in atrial myocytes (Figure S2C,D). These results demonstrate that higher concentrations of fexofenadine are necessary for inhibition of the reconstructed GIRK current in oocytes than that of the native cardiac GIRK current.
3.4. Terfenadine‐mediated inhibition of GIRK channels is not due to the uncoupling of Gβγ subunits
As it is well known that Gβγ directly activates the GIRK channel via coupling to cytoplasmic domains (Whorton & Mackinnon, 2013), we examined whether or not terfenadine inhibits GIRK channel via disturbance of the Gβγ coupling. To this end, we measured the effects of terfenadine on both the Gβγ‐dependent activation and the Gβγ‐independent activation of GIRK currents. We recorded the Gβγ‐dependent activation by application of 1‐μM ACh in oocytes expressing Kir3.1/Kir3.2 channels together with M2 receptors and observed that ACh‐induced GIRK current at −100 mV was significantly inhibited by 100‐μM terfenadine (Figure 4a–c). We next induced GIRK activation by application of 10‐μM ivermectin, which activates the Kir3.2 channel directly in a Gβγ‐independent manner (Chen, Tateyama, et al., 2017). Application of 100‐μM terfenadine significantly reduced the ivermectin‐induced GIRK current at −100 mV (Figure 4d–f), suggesting that the terfenadine‐mediated inhibition of GIRK channel is not due to the uncoupling of Gβγ from GIRK channels. These results demonstrate that terfenadine reduced the basal activity of GIRK channel and also inhibited both the Gβγ‐dependent and the Gβγ‐independent activations. Therefore, terfenadine acts as a negative regulator of GIRK channels by direct inhibition which is independent of Gβγ. With fexofenadine, there was only part inhibition of the ACh‐induced current and only limited inhibition of the ivermectin‐induced current at 100 μM (Figure S2D,E), suggesting that fexofenadine preferentially inhibits the Gβγ‐dependently activated GIRK current. Taken together, the inhibitory mechanisms by terfenadine may be different from that of fexofenadine, in spite of the high similarity of their structures.
Figure 4.

Effects of terfenadine on the Gβγ‐dependent and Gβγ‐independent activations of GIRK currents. (a) Currents were recorded in oocytes expressing Kir3.1 + Kir3.2 + M2 receptors (M2R) with a protocol as shown above, every 5 s, in the high K+ solution. The current amplitude in ND96 solution was subtracted. Current traces before (left panel) and after the application of 1 μM of ACh in the absence (centre panel) or presence of 100 μM of terfenadine (TER, right panel) are shown. (b) Time courses of current change at −100 and +40 mV. (c) Normalized currents induced by ACh in the absence and presence of terfenadine. Basal currents were normalized to 1 and indicated by a dotted line. Data shown are individual values, with means ± SD, n = 6 for each. (d) Current traces in oocytes expressing Kir3.1 + Kir3.2 subunits before (left panel) and after the application of 10 μM of ivermectin (IVM) in the absence (centre panel) or presence of 100 μM of terfenadine (right panel). (e) Time courses of current change at −100 and +40 mV. (f) Normalized currents induced by ivermectin in the absence and presence of terfenadine. Data shown are individual values, with means ± SD, n = 6 for each from N = 5 frogs. *P<0.05, significantly different as indicated; paired t tests
3.5. Phe137 at the pore helix of Kir3.1 subunits is critical for terfenadine‐mediated inhibition
Here, we focus on the inhibition mechanisms of GIRK channel by terfenadine. As Kir3.1 subunit‐containing channels were more sensitive to terfenadine than channels composed of Kir3.2 or Kir3.4 subunits (Figure 1), we have reasoned that some unique amino acid residue(s) in Kir3.1 subunits should play a critical role in the inhibitory mechanism. Terfenadine is a highly hydrophobic compound, and it is unlikely to interrupt the Gβγ‐GIRK coupling via interaction with the cytoplasmic domains of GIRK, as described above. Therefore, we speculated that some of the Kir3.1 subunit‐specific amino acid residues located in the transmembrane domains (TMs) may act as the structural determinants for the terfenadine effect. To verify this hypothesis, we constructed mutants of the Kir3.1 subunit by replacing the unique residues one at a time, which are located in the region between the N‐terminal start of the TM1 and C‐terminal end of the TM2, with those of Kir3.2 or Kir3.4 (Figure 5a). The Kir3.1 turret mutant contains a sequence of MDHIEDPSW between the residue positions 112 to 120. We recorded the current of oocytes expressing these Kir3.1 subunit mutants with the Kir3.2 wild type and observed that the basal currents of most of the Kir3.1 mutants/Kir3.2 wild type were markedly inhibited by application of 100‐μM terfenadine and only Kir3.1 F137S/Kir3.2 showed a reduced inhibition by terfenadine (Figure 5b,c). These results suggest that Phe137, which is located at the centre of the pore helix in the Kir3.1 subunit (Figure 5d), is critical for terfenadine‐mediated inhibition.
Figure 5.

Identification of structural determinants of Kir3.1 subunits for terfenadine‐mediated inhibition. (a) Alignment of amino acid sequence of the regions between TM1 and TM2 of Kir3.1, Kir3.2, and Kir3.4 subunits. SF indicates the selectivity filter. Red triangles indicate the locations of mutations in Kir3.1 mutants analysed in this study. (b) Currents in oocytes expressing Kir3.2 with Kir3.1 wild type and mutants were recorded with a protocol shown above in the high K+ solution. Black traces show the basal currents, and the red traces show the currents in the presence of 100 μM of terfenadine (TER). Black triangles indicate the zero current level. (c) Inhibition was calculated by the reduction of the current amplitude in the presence of 100 μM of TER from the current before the application at −100 mV, and the basal current amplitude was normalized as 100%. Data shown are individual values, with means ± SD, n = 7 for the wild type, M98F, and F137S groups; n = 6 for the others, from N = 10 frogs. *P<0.05, significantly different from wild type, n.s. indicates not statistically significant; one‐way ANOVA with Dunnett's multiple comparison tests. (d) The homology model of rat Kir3.1 structure based on the crystal structure of mouse Kir3.2 (Protein Data Bank ID: 3SYA; Whorton & Mackinnon, 2011). Marine colour shows the pore helix, yellow colour shows the selectivity filter (SF), and red arrows indicate the location of Ser148 in Kir3.2 and Phe137 in Kir3.1 models
It is known that the various GIRK subunits differ in their gating behaviour (Kofuji, Doupnik, Davidson, & Lester, 1996). For example, channels containing Kir3.1 subunits display a time‐dependent increase in current amplitude upon membrane hyperpolarization (e.g., Figure 1b,c), while homomeric Kir3.2 and Kir3.4 do not display such slow activation but are typified by a gradual decrease in current amplitude (Figure 1d,e). We observed that Kir3.1 F137S/Kir3.2 channels showed a time‐dependent decrease, rather than an increase, in current amplitude upon hyperpolarization, suggesting that mutation of the Phe137 to Ser alters channel gating, consistent with previous studies (Kofuji et al., 1996). Because the gating behaviour of Kir3.1 F137S/Kir3.2 channels is similar to that of homomeric Kir3.2 and Kir3.4 channels, there remains a possibility that the time‐dependent inactivation of current is contributed by an excess homotetramer of Kir3.2 subunits in oocytes expressing an insufficient Kir3.1 F137S. To confirm this possibility, we constructed tandem dimers in which the Kir3.2 wild type is ligated with the Kir3.1 wild type or the F137S mutant (Figure S3). The Kir3.2–Kir3.1 dimer showed a slow activation upon hyperpolarization, and the current was markedly reduced by application of 100‐μM terfenadine. Oocytes expressing Kir3.2–Kir3.1 F137S dimer did not display the slow activation and were weakly inhibited by terfenadine. These results are consistent with the data of coexpression of the single Kir3.2 subunit with the single Kir3.1 subunit in oocytes, supporting the interpretation that the Phe137 to Ser substitution both reduces the sensitivity to terfenadine and alters the gating behaviour of the Kir3.1‐containing channels.
3.6. GIRK heterotetramers in which only two subunits contain a pore helix Phe residue are susceptible to inhibition by terfanidine
To further confirm the role of Phe137 in Kir3.1 subunits, we introduced a reverse mutation S148F in the Kir3.2 subunit (Figure 5d) and observed that this mutation potentiated the inhibition by terfenadine (Figure 6). As there are four pore helixes within the tetrameric channel complex, we examined how many Phe or Ser residues in the tetrameric context are required for inhibition by terfenadine. Here, we compared the dose–inhibition relationships of terfenadine between different combinations of GIRK subunits with the pore helix Phe/Ser mutations in Kir3.1 and/or Kir3.2 subunits (Figures 6 and S1). The wild‐type Kir3.1/Kir3.2 channel contains two Phe and two Ser at the pore helix in tetrameric complex, and this channel showed a lower IC50 and greater maximal inhibition than that of Kir3.1 F137S/Kir3.2 channels (IC50: 50.6 ± 17.9 μM; Hillslope: 1.46 ± 0.39, mean ± SD, n = 6) or the homomeric Kir3.2 channels which contain four pore helix Ser and no Phe. The homomeric Kir3.1 F137S channel, which also contains four pore helix Ser and no Phe and is detectable on the plasma membrane (Chan, Sui, Vivaudou, & Logothetis, 1996), also showed a slight inhibition of K+ current by a high concentration of terfenadine (Figure S4). The tetrameric complex Kir3.1 F137S/Kir3.2 S148F contains two Phe and two Ser had similar sensitivity towards terfenadine as wild‐type Kir3.1/Kir3.2 channels. The tetrameric complexes Kir3.1/Kir3.2 S148F and Kir3.2 S148F, which have four Phe and no Ser, also showed similar inhibition by terfenadine. There was no significant difference in the IC50 between the four Phe complexes and the two Phe/two Ser complexes, showing that two Phe at the pore helix in the tetrameric complex of GIRK channels are sufficient for the terfenadine‐mediated inhibition.
Figure 6.

Effects of terfenadine on the different combinations of pore helix Phe/Ser residue in Kir3.1 and Kir3.2 complexes. (a–f) Currents were recorded in a high K+ (96 mM) solution with a protocol shown above. Recorded in the absence and presence of 0.01–300 μM of terfenadine in oocytes expressing (a) Kir3.1 + Kir3.2, (b) Kir3.1 F137S + Kir3.2, (c) Kir3.2 alone, (d) Kir3.1 + Kir3.2 S148F, (e) Kir3.1 F137S + Kir3.2 S148F, and (f) Kir3.2 S148F alone. Schemes of the combination of the Phe and Ser in the pore helix of Kir3.1 (blue colour) and Kir3.2 (pink colour) are shown above the traces. (g) Dose–inhibition relationships were plotted by calculating the ratio of current amplitude in the presence of a certain concentration of terfenadine to the current before the application at −100 mV. The basal current was normalized to 1. In the case of panels (a) to (c), the current amplitude in the ND96 solution was subtracted. For panels (d) to (f), the current amplitude in the NMDG solution was subtracted to remove leak currents and the variation of endogenous currents. Data show the means ± SD, n = 6 for each from N = 7 frogs
3.7. Kir3.2 S148F substitution alters ion selectivity
Unexpectedly, we observed that the Kir3.2 S148F‐containing complexes, but not the complexes without Kir3.2 S148F subunit, showed an abnormal K+ selectivity (see Figures 6, 7, and S4). Heteromeric wild type Kir3.1/Kir3.2 channels and homomeric Kir3.2 wild type channels showed almost no inward current in the ND96 solution, while Kir3.2 S148F‐containing complexes showed large inward currents and outward currents in the same solution (Figure 7a–c). The outward current was eliminated by replacing the ND96 solution (containing 1.8‐mM Ca2+) with the high K+ solution (no Ca2+). This current was also inhibited by 100 μM of DIDS (a Cl− channel blocker) or terfenadine (Figure 7d,e), demonstrating that the influx of extracellular Ca2+ and an induced Ca2+‐dependent Cl− current (Weber, 1999) were blocked by terfenadine. To further characterize the change of ion selectivity, we recorded the current of homomeric Kir3.2 S148F channels in various solutions and observed that these channels could not be fully blocked by 1‐mM Ba2+ and were almost fully blocked by 100 μM of terfenadine (Figure 7f,g). Removal of the Ca2+ from the ND96 solution also eliminated the Ca2+‐activated Cl− current. When the extracellular Na+ was replaced with NMDG+, the inward current at −100 mV disappeared (Figure 7h), showing that the large cation NMDG+ cannot permeate through the pore. Taken together, Kir3.2 S148F‐containing complexes lose the “wild‐type” K+ selectivity and become permeable not only to K+ but also to Na+ and Ca2+, and they are less sensitive to the block by Ba2+. It is likely that the mutation of Ser148 to Phe induces a conformational change in the ion selectivity filter of the channel.
Figure 7.

Ion selectivity of Kir3.2 S148F‐containing channels. (a–c) Na+ current and K+ current in oocytes expressing (a) Kir3.2 S148F alone, (b) Kir3.1 + Kir3.2 S148F, and (c) Kir3.1 F137S + Kir3.2 S148F. Currents were recorded with a same protocol in Figure 5 in the ND96 solution (containing 1.8‐mM Ca2+) and the high K+ solution (without Ca2+) subsequently in the same cell. (d, e) Current traces and time courses of inhibition were recorded in oocytes expressing Kir3.2 S148F alone in ND96 solution in the absence (blue trace) or presence of 100 μM of DIDS (orange trace) or presence of 100 μM of terfenadine (red trace). (f, g) Current traces of oocytes expressing Kir3.2 S148F alone in various types of extracellular solution, including ND96 solution (blue trace), Ca2+‐free ND96 solution in the absence (green trace) or presence of 1 mM of Ba2+ (purple trace), and high K+ solution in the absence (black trace) or presence of 100 μM of terfenadine (red trace). (h) Current traces and time courses of the current before (green trace) and after replacing the extracellular Na+ with NMDG+ (black trace). Data were recorded using oocytes from N = 4 frogs
To further investigate the roles of the Phe and Ser at the pore helix in ion selectivity, we examined the effect of various amino acid residues at this position (Figure S5). As wild‐type homomeric Kir3.1 channels cannot be correctly exported to the plasma membrane and instead accumulate in the endoplasmic reticulum (Hibino et al., 2010), we have introduced specific substitutions at the pore helix of Kir3.2 subunits instead and analysed the ion selectivity of the resulting homotetramers. We measured the ratio of Na+ current to K+ current (INa/IK) at −100 mV and the ratio of Na+ permeability to K+ permeability (PNa/PK) of each Kir3.2 Ser148 mutant (Figures S6 and S7). Currents were recorded in a modified 96‐mM K+ solution and 96‐mM Na+ solution. The leak and endogenous current was subtracted (Figure S6). Substitution of Ser148 with either Lys or Arg abolished ionic currents and we therefore, excluded these two mutants from the analysis. We did not mutate Ser148 to Pro, because proline is known as a helix breaker which may drastically change the structure of the pore helix. When Ser148 was substituted by Gly, Ala, Thr, Asp, Glu, or Asn, we observed that INa/IK and PNa/PK values are similar to that of the wild‐type Kir3.2 channels, showing that these mutants maintain strict K+ selectivity and strong inward rectification (Figure S7B,C). In contrast, when Ser148 was substituted with Phe, Val, Leu, Met, Tyr, or Trp, we observed significantly higher INa/IK and PNa/PK (a value of 0.38 ~ 0.84 for INa/IK and 0.62 ~ 0.72 for PNa/PK) and a weaker inward rectification as compared with the wild‐type Kir3.2 subunits. These results indicate a reduced K+ selectivity which may be linked to structural perturbations at the selectivity filter. Thus, it seems that Kir3.2 mutants bearing residues with a high polarity and a small side‐ chain at position 148 retain intact K+ selectivity while substitution with nonpolar and bulky side chains at this position hampers the ion selectivity. This suggests that a nonpolar environment at the Ser148 position alters the structure of the selectivity filter. However, the side‐chain volume may not be a strictly critical determinant as substitution of Ser148 with Val or Glu, which has a similar volume, showed an apparently different ion selectivity (Figure S7B).
3.8. Roles of the Phe/Ser at the pore helix in terfenadine‐mediated inhibition
We next measured the dose–inhibition relationship of each Kir3.2 Ser148 mutant homotetramer and observed that inhibition efficacy by terfenadine was drastically changed by mutations of Ser148 (Figures 8a and S8A). When Ser148 was mutated to an amino acid containing a large side chain like Tyr and Trp, these mutants showed a strong inhibition by 300 μM of terfenadine, and this efficacy is significantly greater than that of wild type. Interestingly, a high concentration (100–300 μM) of terfenadine increased the current of S148G and S148A mutants. As the solvent of terfenadine, methanol, is known as an activator of GIRK channels (Kobayashi et al., 1999), we examined the effect of methanol (0.49–147 mM) alone on Kir3.2 wild type and S148G mutant homotetramers (Figure S8B,C). Application of 147 mM of methanol (the vehicle for 300‐μM terfenadine) induces only a small increase in the current amplitude of wild type and S148G channels, and there was no significant difference between the two groups, suggesting that mutation of Ser148 to Gly did not increase the response to methanol. Application of 300‐μM terfenadine induced a current that is larger than the current induced by methanol alone, showing that mutation of Ser148 to Gly reverses the terfenadine effect from inhibition to activation. We analysed the correlations between the maximal inhibition by 300 μM of terfenadine and the polarity or the side‐chain volume of the amino acid at the Ser148 position (Figure 8b,c). The basal current amplitude was normalized as 100% to control the variation of expression in each oocyte. Terfenadine efficacy does not correlate with the polarity (r = 0.40) but highly correlates with the side‐chain volume (r = 0.84), suggesting that a large side chain of the amino acid residue at the Ser148 position is critical for the terfenadine effect.
Figure 8.

Relationships between the terfenadine efficacy on Kir3.2 S148 mutant homotetramers and amino acid properties. (a) Dose–inhibition relationships were plotted by normalizing of current amplitude in the presence of a certain concentration of terfenadine (0.1–300 μM) to the current before the application at −100 mV (dotted line) in oocytes expressing Kir3.2 wild type or S148 mutants respectively. The mutants were generate by substituting the Ser in the wild type with other amino acids, as indicated by their standard single letter abbreviation (S, serine; A, alanine etc). Basal currents were normalized to 1 and indicated by the dotted line. (b, c) The relationship between maximal inhibition % induced by 300 μM of terfenadine and the polarity (b) or the side‐chain volume (c) of the amino acid residue at the position 148 in Kir3.2 wild type and mutants. Dotted lines indicate the zero inhibition level. Data show the means ± SD, n = 6 for the wild type and S148D; n = 5 for the others, from N = 8 frogs. A straight line demonstrates the linear regression. Correlation coefficients (r) are 0.40 in panel (b) and 0.84 in panel (c)
3.9. Modelling of terfenadine‐GIRK complex
Molecular docking simulations of terfenadine to Kir3.1/Kir3.2 heterotetramers using different approaches has revealed two distinct potential drug‐binding sites (Figure 9a, showing the 10 terfenadine poses with the highest score). The first site is a cleft formed below Phe137 in the Kir3.1 subunit and in between the lower parts of the TM helices from two neighbouring subunits (Site A). The two Site A shown are identical, but the shapes of terfenadine are different. The second site is at the central cavity of the channel, confined by the selectivity filter and the G‐loop gate (Site B). To evaluate potential terfenadine binding at the Site B, we tested the voltage dependence of the blockage by this drug, which is a common feature of pore blockers that bind at the central cavity of ion channels (Inanobe, Itamochi, & Kurachi, 2018; Kawada, Inanobe, & Kurachi, 2016). We recorded Kir3.1/Kir3.2 channel currents by applying voltage ramp from −100 to +40 mV and did not observe any voltage dependence on the extent of blockage by the drug (Figure S9). We further examined the effect of terfenadine on Kir3.1 S170P/Kir3.4 S176P heterotetramer, which exhibits an enhanced open probability of the channel pore and increased ligands access to the central cavity of the channel (Sadja, Smadja, Alagem, & Reuveny, 2001). The block of Kir3.1 S170P/Kir3.4 S176P channels by terfenadine was not either larger in magnitude or faster in kinetics than that of wild‐type channel (Figure S10). Taken together, the above results argue against terfenadine binding at the central cavity (Site B).
The channel cleft that constitutes the putative terfenadine binding Site A is partly shared by the PIP2 binding site (Figure 9b; Whorton & Mackinnon, 2011). As PIP2 is critical for GIRK channel activation, we examined the effect of terfenadine on PIP2‐mediated activity. By co‐expressing Kir3.1/Kir3.2 channels with the voltage sensitive phosphatase, Ci‐VSP (Murata, Iwasaki, Sasaki, Inaba, & Okamura, 2005), channel activity was decreased by the depletion of PIP2 at depolarized potential (+60 mV), and the current was recovered by switch of interval potential from +60 to 0 mV (Figure 10). The maximal current after recovery was normalized to 1 to control the variation of endogenous PIP2 level in each oocyte (Figure 10c,d). Application of 100‐μM terfenadine decreased the current amplitude and showed a slower current recovery upon the change of interval potential from +60 to 0 mV (Figure 10e). Oocytes expressing Ci‐VSP with a mutant channel, Kir3.1 E142D/Kir3.2 E152D (Adney, Ha, Meng, Kawano, & Logothetis, 2015), which has stronger channel–PIP2 interaction compared to the wild‐type channel, displayed a weaker inhibition by terfenadine and a faster current recovery upon hyperpolarization of interval potential (Figure 10e,f). Taken together with the mutagenesis results and the docking simulations, it seems likely that terfenadine binds at Site A and sterically hampers the interactions of PIP2 with the channel.
Figure 10.

Effects of terfenadine on PIP2‐modulated GIRK currents. (a, b) Currents were recorded in the high K+ solution with a protocol shown above and repeated every 0.5 s. Recorded in the absence and presence of 100 μM of terfenadine (TER) from oocytes expressing (a) Kir3.1 + Kir3.2 + Ci‐VSP or (b) Kir3.1 E141D + Kir3.2 E152D + Ci‐VSP. (c, d) Current recovery kinetics calculated from the current amplitude at −100 mV recovered with an interval potential from 60 to 0 mV. The maximal current after recovery was normalized to 1. (e) Tau of current recovery. Data show the means ± SD, n = 5 for each (* indicates statistically significant difference, paired t test). (f) Inhibition % calculated from the reduction of the current amplitude in the presence of 100 μM of TER from the current before the application at −100 mV. Data show the means ± SD, n = 5 for each from N = 4 frogs (unpaired t test)
Interestingly, in docking simulations of fexofenadine, which is structurally very similar to terfenadine but far less potent, we observed a similar mode of binding at putative Site A (not shown). In concert with this observation, concentration–inhibition curves of terfenadine constructed in the presence of fexofenadine displayed a marked rightward shift (Figure S11), indicating that fexofenadine indeed binds to Kir3.1/Kir3.2 channels at a site that overlaps with that used by terfenadine.
4. DISCUSSION AND CONCLUSIONS
In the present study, we observed the following: (a) GIRK channels, especially those containing Kir3.1 subunits, are novel targets of some second‐generation antihistamines, such as terfenadine; (b) terfenadine also inhibits native cardiac GIRK currents; (c) terfenadine inhibits the GIRK channel in a Gβγ‐independent manner; (d) a Phe residue located in the centre of the pore helix (position 137 in the Kir3.1 subunit) is crucial for terfenadine‐mediated inhibition. Mutations in the corresponding position, 148, in Kir3.2 subunits alter the response to terfenadine, and the side‐chain volume is critical; (e) the polarity of this residue contributes to the ion selectivity; (f) terfenadine is likely to interfere with PIP2 binding and vice versa.
Terfenadine is known to inhibit the H1 receptor at nanomolar concentrations in various tissues of different species (Benavides et al., 1995; Merlos et al., 1997). The IC50 of terfenadine for inhibition of the hERG channel is about 350 nM (Crumb, 2000; Kamiya, Niwa, Morishima, Honjo, & Sanguinetti, 2008; Taglialatela et al., 1998), and there are reports that the severe cardiac arrhythmia, Torsades de Pointes, was induced in patients by terfenadine (June & Nasr, 1997; Monahan et al., 1990; Paris, Parente, Bruschetta, Guzman, & Niarchos, 1994). Here, we have demonstrated that terfenadine inhibits Kir3.1/Kir3.2 channels expressed in oocytes with an IC50 of ~10 μM, which is higher than the dosage required for inhibition of the H1 receptor and the hERG channel. Fexofenadine, the active metabolite of terfenadine, is as potent as terfenadine for the treatment of allergic reaction with less cardiac toxicity (Pratt, Mason, Russell, Reynolds, & Ahlbrandt, 1999; Terrien, Rahm, Fellrath, & Spertini, 1999). We observed that fexofenadine displays weaker inhibition of GIRK current than terfenadine both in oocytes and atrial myocytes, suggesting that fexofenadine is safer than terfenadine. However, we observed that fexofenadine has different IC50 towards the GIRK channel in different cell types. Our data also showed that loratadine inhibits GIRK current only weakly while its active metabolite, desloratadine, inhibits GIRK current markedly, indicating a risk associated with these drugs. On the other hand, the inhibitory effects of these antihistamines on GIRK channels could be of use in the treatment of atrial fibrillation and drug addiction, because GIRK channels have been reported as a potential target for novel therapy of these conditions (Dobrev et al., 2005; Marker, Stoffel, & Wickman, 2004).
All these antihistamines contain a piperidine ring and several aromatic rings, but they show different inhibitory effects on GIRK current (Figure 3), suggesting that these structural moieties may not be the trigger for inhibitory effect. There is a possibility that the substituted groups, which are attached to the non‐piperidine moiety, provide a proper size and length for the insertion of the compounds into the binding cavity in the GIRK channel. We show that Phe137 at the pore helix in the Kir3.1 subunit is critical for the inhibitory effects of terfenadine. Our docking simulation combined with the functional assays indicates that the terfenadine binding site is confined to the cleft formed below Phe137 of the Kir3.1 subunit and in between the lower parts of two TM helices contributed by neighbouring channel subunits (Site A in Figure 9). Phe137 is unique to Kir3.1 subunits and the amino‐acid residue in the same position in Kir3.2, Kir3.3, and Kir3.4 subunits is Ser. This Kir3.1 subunit‐specific Phe residue at the pore helix supports the preferential inhibition of Kir3.1 subunit‐containing channels, rather than other Kir3.x subunits. We have demonstrated that the side‐chain volume of the amino acid located at Phe137 in Kir3.1 and at Ser148 in Kir3.2 subunits determines the efficacy of inhibition by terfenadine. Judging from the molecular docking data for Site A, there may not be a direct contact between terfenadine and Phe137. Thus, the effect might be indirect, and Phe137 is critical for the inhibition induced by the structural rearrangements upon terfenadine binding.
This terfenadine binding site is distinct from the binding site in hERG channels, which is the central cavity surrounded by hydrophobic residues below the selectivity filter (Fernandez, Ghanta, Kauffman, & Sanguinetti, 2004; Kamiya et al., 2008; Myokai, Ryu, Shimizu, & Oiki, 2008; Wang & Mackinnon, 2017). Unlike the bee venom tertiapin, a pore blocker of Kir3.x and Kir1.1 channels (Doupnik, 2017), terfenadine does not seem to bind to the channel cap, as the mutations at the extracellular turret did not significantly alter its potency.
The only structural difference between terfenadine and fexofenadine is a substitution of a methyl moiety with a carboxyl group, as shown in Figure 3. Our molecular docking data show that the methyl group of terfenadine orients towards the intracellular side and not towards the crucial Phe137, suggesting that the low potency of fexofenadine is not determined by an altered interaction with this residue. An attractive hypothesis would be that the carboxylic group of fexofenadine makes it more compatible with PIP2 binding than the methyl group of terfenadine, by allowing the drug and the PIP2 tail to occupy the same channel cavity at the same time. As we observed that fexofenadine shows more inhibition of the Gβγ‐dependent activation than the Gβγ‐independent activation, it would be possible that Gβγ‐coupling structure disturbs the compatibility of fexofenadine and PIP2 occupancies. While this hypothesis rationalizes our observations, further substantiation would be required to define the overall inhibition mechanism by fexofenadine. In the case of terfenadine, it is also possible that a competition between terfenadine and PIP2 in binding to Site A is involved in the inhibition mechanism (Figure 10). There might be a possible link between PIP2 binding and the pore helix conformation, which warrants further investigation.
Our results show that this Phe137 may also couple the change in the selectivity filter with the pore helix conformation. It is well known that the selectivity of ion channels is largely determined by the conserved sequence of the selectivity filter (Zagotta, 2006). Mutations in this region modify the K+ selectivity of GIRK channels and result in severe disorder of physiological function, such as Keppen–Lubinsky syndrome in humans (Masotti et al., 2015) and neural development impairment in weaver mouse (Patil et al., 1995). The pore helix is located behind the selectivity filter. We observed that substitution of the pore helix residue by various other amino acid residues altered the ion selectivity. This finding is consistent with previous studies that concluded that both the selectivity filter and the pore helix of GIRK channels are responsible for controlling ion selectivity (Silverman, Lester, & Dougherty, 1998; Slesinger, 2001). In the case of Kir3.1 subunits, a chimeric homotetramer of Kir3.1 transmembrane regions connected with Kir2.1 cytoplasmic regions is permeable to Na+ (Slesinger, 2001). Mutations of Phe137 to Ser and Ala142 (this residue linked the pore helix with the selectivity filter) to Thr, abolished the permeability to Na+. However, here, we show that, in the mutant Kir3.2 S148F, with the intrinsic Thr153 (corresponding to Ala142 in Kir3.1) permeates Na+. Homology models of mutant Kir3.2 subunits shown in Figure S5 demonstrate that the side chain of nonpolar and bulky amino acid residues at position 148 orients towards TM1. Therefore, we speculate that abnormal, non‐polar interactions between the pore helix and TM1 may change the conformation of the selectivity filter.
Summarizing our observations of mutants at Phe137 in Kir3.1 subunits, this pore helix residue has several roles in channel functions which may be summarised as follows: (a) it couples the terfenadine‐induced conformational change with the channel closure; (b) it contributes to the gating behaviour upon voltage changes; and (c) it regulates ion selectivity. It would be interesting to investigate further the relationships between these mechanisms.
In conclusion, our present results have identified a novel GIRK inhibitor, terfenadine, and the subunit structure crucial for its inhibitory effects. This study provides us with novel insights into the gating behaviour of GIRK channels by the pore helix, along with valuable information for the design of drugs targeting GIRK channels.
CONFLICT OF INTEREST
The authors declare no conflict of interest.
AUTHOR CONTRIBUTIONS
I‐S.C. and Y.K. designed the study and experiments. I‐S.C. and C.L. performed all experiments using Xenopus oocytes and data analyses. I‐S.C. isolated rat atrial myocytes, and M.T. performed patch‐clamp recording from atrial myocytes and data analyses. I.K. and E.R. performed molecular docking analyses and interpreted the data. I‐S.C., M.U., and Y.K. contributed to the initial research of screening of a small‐molecule library. I‐S.C. and Y.K. wrote the paper, and all authors revised the paper and confirmed the final version.
DECLARATION OF TRANSPARENCY AND SCIENTIFIC RIGOUR
This Declaration acknowledges that this paper adheres to the principles for transparent reporting and scientific rigour of preclinical research as stated in the BJP guidelines for Design & Analysis, and Animal Experimentation, and as recommended by funding agencies, publishers, and other organizations engaged with supporting research.
Supporting information
Table S1. The primers used for constructions of Kir3.1 and Kir3.2 mutants by site‐directed mutagenesis or inverse PCR using PfuUltra II Fusion HS DNA Polymerase kit (Agilent Technologies).
Figure S1. Datasets of the terfenadine effects on different combinations of GIRK wild‐type subunits and mutants in Xenopus oocytes. (A) Currents were recorded with a protocol shown above in oocytes expressing Kir3.4 alone. (B–I) Dose‐inhibition relationships of terfenadine on various combinations of GIRK wild‐type subunits and mutants were evaluated by normalization of the basal current to 1. Each type of symbol indicates a set of data recording in the same cell (n = 1) and a number of n = 6 for each groups from N = 7 frogs. The filled circle indicated the mean with an error bar showing the SD.
Figure S2. Effects of fexofenadine on ACh‐induced GIRK currents in rat atrial myocytes and Xenopus oocytes. (A, B) Whole‐cell currents from rat atrial myocytes were recorded in a 20 mM K+ Tyrode's solution with a protocol shown above and repeated every 3 s in the presence of 1 μM ACh with (A) 10 μM or (B) 100 μM of fexofenadine (FEX). (C) The maximal current amplitude of ACh‐evoked current at −100 mV was normalized as 1 and the current amplitude before application of ACh was subtracted. Normalized current for each group were calculated from current amplitude at −100 mV after application of FEX for 15 s. Data show the means±SD, n = 5 for 10 μM; n = 4 for 100 μM group from N = 4 rats. (D) Inhibitory effect of 100 μM and 1 mM of FEX in oocytes expressing Kir3.1 + Kir3.4 (left panel) and Kir3.1 + Kir3.4 + M R (right panel). Each type of 2 symbol indicates the raw data recorded at different FEX concentrations in the same cell, n = 5 for each from N = 2 frogs. In the left panel, current amplitude of the basal current was normalized to 1. In the right panel, maximal current amplitude in the presence of 1 μM ACh alone was normalized to 1. The current amplitude in ND96 solution was subtracted. (E) Currents induced by 10 μM ivermectin (IVM) in the presence of FEX in oocytes expressing Kir3.1 + Kir3.2. The current amplitude in the presence of 10 μM IVM alone was normalized to 1, n = 5 for each from N = 1 frog.
Figure S3. Scheme of Kir3.2‐Kir3.1 dimer and the terfenadine effects. Dimers were constructed as shown upper part of the panel (see detail in Methods). Currents were recorded with a protocol shown above in oocytes expressing (A) Kir3.2‐Kir3.1 wild‐type dimer and (B) Kir3.2‐Kir3.1 F137S dimer. Black traces indicate the basal currents and red traces indicate the currents in the presence of 100 μM trefenadine (TER) in the same cell. Data were recorded using oocytes from N = 1 frog.
Figure S4. Currents of homomeric Kir3.1 F137S channel. (A–C) Na+ current and K+ current in (A) non‐injected oocytes or oocytes expressing (B) Kir3.1 F137S alone or (C) Kir3.1 F137S + Gβ1 + Gγ2. Currents were recorded with a protocol shown above in the ND96 solution (blue trace) and the high K+ solution in the absence (black trace) or presence of 100 μM of terfenadine (TER, red trace) in the same cell. (D) Current amplitudes at −100 mV. Each circle symbol indicates each raw data and some of the symbols overlap with each other, means±SD, n = 5 for each from N = 1 frog (*statistically significant difference, paired t‐test).
Figure S5. (A) The crystal structure of mouse Kir3.2 (Protein Data Bank ID: 3SYA) (Whorton and Mackinon, 2011). (B–M) Homology models of Kir3.2 S148 mutants' structures based on the WT structure (3SYA). Light blue color shows the pore helix and yellow color shows the selectivity filter (SF). Green sticks indicate the side‐chain of the amino acid located at the residue position 148 with elements colored as follows: red refers to O; blue refers to N; yellow refers to S.
Figure S6. Current–voltage relationships. Currents were recorded with a ramp protocol from −100 to +40 mV for 1 s, repeating every 5 s to monitor the changes of current amplitude. (A) In oocytes expressing Kir3.2 wild‐type, the K+ current (IK) was recorded in a 96 mM K+ bath solution and the current in the presence of 3 mM Ba2+ (the blue trace in left panel) was subtracted to remove leak and endogenous currents. In the same cell, the Na+ current (INa) was subsequently recorded by replacing the bath solution with a 96 mM Na+ bath solution and the current in the presence of 3 mM Ba2+ (the gray trace in right panel) was also subtracted. (B) Currents were recorded in the 96 mM K+ bath solution and subsequently in the Na+ bath solution in oocytes injected with water alone. Data were recorded using oocytes from N = 1 frog.
Figure S7. K+ selectivity of Kir3.2 S148 mutant homotetramers. (A) Current‐voltage curves in oocytes expressing various Kir3.2 wild‐type and various S148 mutants respectively. Currents were recorded with a ramp protocol from −100 to +40 mV for 1 s, repeating every 5 s. The K+ current (IK, black traces), in the oocytes expressing a channel with normal K+ selectivity (the wild‐type, G, A, T, D, E and N mutants), was recorded in a 96 mM K+ bath solution and the current in the presence of 3 mM Ba2+ was subtracted to remove the variation of endogenous current. The Na+ current (INa, red traces) was recorded in a 96 mM Na+ bath solution in the same cell and the current in the presence of 3 mM Ba2+ was also subtracted. In the case of oocytes expressing a channel with abnormal K+ selectivity (the F, V, L, M, Y and W mutants), a averaged current amplitude from the current recorded in oocytes injected water alone (n = 6) was subtracted to remove the endogenous current (see the detail in Supporting Information Figure S6B). (B) The relationship between INa/IK or PNa/PK and the polarity of each amino acid at the position Ser148 in Kir3.2 wild‐type and mutants. The polarity scale was predicted by Grantham's method using ExPASy. (C) The relationship between INa/IK or PNa/PK and the side‐chain volume of amino acids. Dotted lines indicate the zero level. Data show the means±SD, n = 8 for S148F, n = 7 for S148 W and n = 6 for the others from N = 4 frogs.
Figure S8. (A) Dose‐inhibition relationships of the terfenadine effect on Kir3.2 S148 mutants. Each type of symbol indicates a set of data recording in the same cell (n = 1) and n = 6 for WT and S148D; n = 5 for the others from N = 8 frogs. The filled circle indicated the mean with an error bar showing the SD. (B) Dose‐inhibition relationship of methanol (0.49, 4.9, 49, 147 mM) on Kir3.2 wild‐type and S148G mutant, n = 5 for each from N = 1 frog. (C) Effects of methanol and terfenadine on the current of Kir3.2 S148G at −100 mV.
Figure S9. Current blocking by terfenadine at different membrane potentials. (A) Currents were recorded in the high K+ (96 mM) solution in the absence (black trace) and presence 100 μM of terfenadine (TER, red trace) or 3 mM Ba2+ (blue trace) from oocytes expressing Kir3.1 + Kir3.2 with a protocol shown above: a voltage ramp from −100 to +40 mV for 1 s followed a pulse at −100 mV for 50 ms, and returned to 0 mV after a pulse of +40 mV for 50 ms. The current ratio was calculated from the current amplitude in the presence of TER to the current before the application of TER and the current amplitude in the presence of Ba2+ was subtracted. (B) Inhibition % at −100 mV and +40 mV were calculated by the averaged current amplitude from the last 20 ms of the −100 mV pulse before the ramp pulse and the first 20 ms of the +40 mV pulse after the ramp pulse, means±SD, n = 7 for each from N = 1 frog (unpaired t‐test).
Figure S10. Effects of terfenadine on the current of wild‐type Kir3.1/Kir3.4 and Kir3.1 S170P/Kir3.4 S176P mutant. (A, B) Currents were recorded in oocytes expressing (A) Kir3.1 + Kir3.4 or (B) Kir3.1 S170P + Kir3.4 S176P with a protocol as shown above, every 5 s, in the high K+ solution. The current amplitude in ND96 solution was subtracted. Current traces before (black trace) and after the application of 100 μM terfenadine (TER, red trace) are shown. Right panels show the time courses of current change at −100 mV and +40 mV. (C) Inhibition% of current by TER. Basal current amplitude was normalized as 100%. (D, E) The inhibition kinetics of current by 100 μM terfenadine. Tau‐fast (D) and Tau‐slow (E) of inhibition were calculated by the current reduction from the maximal level to the minimal level. Data show each raw data and means±SD, n = 7 for each from N = 2 frogs (*: statistically significant difference; n.s.: not statistically significant, unpaired t‐test).
Figure S11. Dose‐inhibition relationships of terfenadine in the absence or presence of 100 μM fexofenadine in oocytes expressing Kir3.1 + Kir3.2. Normalized currents were plotted by calculating the current amplitude at −100 mV. The current amplitude in the ND96 solution was subtracted and the basal current was normalized to 1. Data show the means±SD, n = 5 for each from N = 3 frogs.
ACKNOWLEDGEMENTS
We thank Ms. C. Naito and T. Yamamoto for technical assistance and all members in Kubo laboratory for discussion. Ci‐VSP cDNA was kindly provided by Dr Y. Okamura (Osaka University, Japan). iCeMS is supported by World Premier International Research Center Initiative (WPI), MEXT, Japan. This study was supported by the Hiroshi and Aya Irisawa Memorial Promotion Award for Young Physiologists (to I‐S.C.) from the Physiological Society of Japan, the Japan Society for the Promotion of Science KAKENHI Grants JP18K15020 (to I‐S.C.), JP17H04021 (to Y.K.), and JP26220206 (to M.U.) and also supported by the Israeli Science Foundation Grant 1248/15 (to E.R.). E.R. is the incumbent of the Charles H. Hollenberg Professorial Chair.
Chen I‐S, Liu C, Tateyama M, et al. Non‐sedating antihistamines block G‐protein‐gated inwardly rectifying K+ channels. Br J Pharmacol. 2019;176:3161–3179. 10.1111/bph.14717
REFERENCES
- Adney, S. K. , Ha, J. , Meng, X. Y. , Kawano, T. , & Logothetis, D. E. (2015). A critical gating switch at a modulatory site in neuronal Kir3 channels. The Journal of Neuroscience, 35, 14397–14405. 10.1523/JNEUROSCI.1415-15.2015 [DOI] [PMC free article] [PubMed] [Google Scholar]
- Alexander, S. P. , Christopoulos, A. , Davenport, A. P. , Kelly, E. , Marrion, N. V. , Peters, J. A. , … Collaborators C . (2017). The Concise Guide to PHARMACOLOGY 2017/18: G protein‐coupled receptors. British Journal of Pharmacology, 174(Suppl 1), S17–S129. 10.1111/bph.13878 [DOI] [PMC free article] [PubMed] [Google Scholar]
- Alexander, S. P. , Striessnig, J. , Kelly, E. , Marrion, N. V. , Peters, J. A. , Faccenda, E. , … Collaborators C . (2017). The Concise Guide to PHARMACOLOGY 2017/18: Voltage‐gated ion channels. British Journal of Pharmacology, 174(Suppl 1), S160–S194. 10.1111/bph.13884 [DOI] [PMC free article] [PubMed] [Google Scholar]
- Benavides, J. , Schoemaker, H. , Dana, C. , Claustre, Y. , Delahaye, M. , Prouteau, M. , … Langer, S. Z. (1995). In vivo and in vitro interaction of the novel selective histamine H1 receptor antagonist mizolastine with H1 receptors in the rodent. Arzneimittel‐Forschung, 45, 551–558. [PubMed] [Google Scholar]
- Chan, K. W. , Sui, J. L. , Vivaudou, M. , & Logothetis, D. E. (1996). Control of channel activity through a unique amino acid residue of a G protein‐gated inwardly rectifying K+ channel subunit. Proceedings of the National Academy of Sciences of the United States of America, 93, 14193–14198. 10.1073/pnas.93.24.14193 [DOI] [PMC free article] [PubMed] [Google Scholar]
- Chen, I. S. , Furutani, K. , Inanobe, A. , & Kurachi, Y. (2014). RGS4 regulates partial agonism of the M2 muscarinic receptor‐activated K+ currents. The Journal of Physiology, 592, 1237–1248. 10.1113/jphysiol.2013.269803 [DOI] [PMC free article] [PubMed] [Google Scholar]
- Chen, I. S. , Furutani, K. , & Kurachi, Y. (2017). Structural determinants at the M2 muscarinic receptor modulate the RGS4‐GIRK response to pilocarpine by impairment of the receptor voltage sensitivity. Scientific Reports, 7, 6110 10.1038/s41598-017-05128-z [DOI] [PMC free article] [PubMed] [Google Scholar]
- Chen, I. S. , Tateyama, M. , Fukata, Y. , Uesugi, M. , & Kubo, Y. (2017). Ivermectin activates GIRK channels in a PIP2‐dependent, Gβγ‐independent manner and an amino acid residue at the slide helix governs the activation. The Journal of Physiology, 595, 5895–5912. 10.1113/JP274871 [DOI] [PMC free article] [PubMed] [Google Scholar]
- Chen, V. B. , Arendall, W. B. 3rd , Headd, J. J. , Keedy, D. A. , Immormino, R. M. , Kapral, G. J. , … Richardson, D. C. (2010). MolProbity: All‐atom structure validation for macromolecular crystallography. Acta Crystallographica. Section D, Biological Crystallography, 66, 12–21. 10.1107/S0907444909042073 [DOI] [PMC free article] [PubMed] [Google Scholar]
- Clapham, D. E. , & Neer, E. J. (1993). New roles for G‐protein βγ‐dimers in transmembrane signalling. Nature, 365, 403–406. 10.1038/365403a0 [DOI] [PubMed] [Google Scholar]
- Crumb, W. J. Jr. (2000). Loratadine blockade of K+ channels in human heart: comparison with terfenadine under physiological conditions. The Journal of Pharmacology and Experimental Therapeutics, 292, 261–264. [PubMed] [Google Scholar]
- Curtis, M. J. , Alexander, S. , Cirino, G. , Docherty, J. R. , George, C. H. , Giembycz, M. A. , … Ahluwalia, A. (2018). Experimental design and analysis and their reporting II: updated and simplified guidance for authors and peer reviewers. British Journal of Pharmacology, 175, 987–993. 10.1111/bph.14153 [DOI] [PMC free article] [PubMed] [Google Scholar]
- Dobrev, D. , Friedrich, A. , Voigt, N. , Jost, N. , Wettwer, E. , Christ, T. , … Ravens, U. (2005). The G protein‐gated potassium current I(K,ACh) is constitutively active in patients with chronic atrial fibrillation. Circulation, 112, 3697–3706. 10.1161/CIRCULATIONAHA.105.575332 [DOI] [PubMed] [Google Scholar]
- Doupnik, C. A. (2017). Venom‐derived peptides inhibiting Kir channels: Past, present, and future. Neuropharmacology, 127, 161–172. 10.1016/j.neuropharm.2017.07.011 [DOI] [PubMed] [Google Scholar]
- Fernandez, D. , Ghanta, A. , Kauffman, G. W. , & Sanguinetti, M. C. (2004). Physicochemical features of the HERG channel drug binding site. The Journal of Biological Chemistry, 279, 10120–10127. 10.1074/jbc.M310683200 [DOI] [PubMed] [Google Scholar]
- Gottlieb, S. (1999). Antihistamine drug withdrawn by manufacturer. BMJ, 319, 7 10.1136/bmj.319.7201.7a [DOI] [PMC free article] [PubMed] [Google Scholar]
- Grantham, R. (1974). Amino acid difference formula to help explain protein evolution. Science, 185, 862–864. 10.1126/science.185.4154.862 [DOI] [PubMed] [Google Scholar]
- Grosdidier, A. , Zoete, V. , & Michielin, O. (2011). SwissDock, a protein‐small molecule docking web service based on EADock DSS. Nucleic Acids Research, 39, W270–W277. 10.1093/nar/gkr366 [DOI] [PMC free article] [PubMed] [Google Scholar]
- Harding, S. D. , Sharman, J. L. , Faccenda, E. , Southan, C. , Pawson, A. J. , Ireland, S. , … NC‐IUPHAR (2018). The IUPHAR/BPS Guide to PHARMACOLOGY in 2018: Updates and expansion to encompass the new guide to IMMUNOPHARMACOLOGY. Nucleic Acids Research, 46, D1091–D1106. 10.1093/nar/gkx1121 [DOI] [PMC free article] [PubMed] [Google Scholar]
- Hey, J. A. , Del Prado, M. , Cuss, F. M. , Egan, R. W. , Sherwood, J. , Lin, C. C. , & Kreutner, W. (1995). Antihistamine activity, central nervous system and cardiovascular profiles of histamine H1 antagonists: Comparative studies with loratadine, terfenadine and sedating antihistamines in guinea‐pigs. Clinical and Experimental Allergy, 25, 974–984. 10.1111/j.1365-2222.1995.tb00400.x [DOI] [PubMed] [Google Scholar]
- Hibino, H. , Inanobe, A. , Furutani, K. , Murakami, S. , Findlay, I. , & Kurachi, Y. (2010). Inwardly rectifying potassium channels: Their structure, function, and physiological roles. Physiological Reviews, 90, 291–366. 10.1152/physrev.00021.2009 [DOI] [PubMed] [Google Scholar]
- Hille, B. (1992). Ionic channels of excitable membranes. Sunderland, MA: Sinauer Associates. [Google Scholar]
- Hindmarch, I. , Johnson, S. , Meadows, R. , Kirkpatrick, T. , & Shamsi, Z. (2001). The acute and sub‐chronic effects of levocetirizine, cetirizine, loratadine, promethazine and placebo on cognitive function, psychomotor performance, and weal and flare. Current Medical Research and Opinion, 17, 241–255. 10.1185/0300799019117011 [DOI] [PubMed] [Google Scholar]
- Holgate, S. T. , Canonica, G. W. , Simons, F. E. , Taglialatela, M. , Tharp, M. , Timmerman, H. , … Consensus Group on New‐Generation A (2003). Consensus Group on New‐Generation Antihistamines (CONGA): Present status and recommendations. Clinical and Experimental Allergy, 33, 1305–1324. [DOI] [PubMed] [Google Scholar]
- Inanobe, A. , Itamochi, H. , & Kurachi, Y. (2018). Kir channel blockages by proflavine derivatives via multiple modes of interaction. Molecular Pharmacology, 93, 592–600. 10.1124/mol.117.111377 [DOI] [PubMed] [Google Scholar]
- Jackman, W. M. , Clark, M. , Friday, K. J. , Aliot, E. M. , Anderson, J. , & Lazzara, R. (1984). Ventricular tachyarrhythmias in the long QT syndromes. The Medical Clinics of North America, 68, 1079–1109. 10.1016/S0025-7125(16)31087-2 [DOI] [PubMed] [Google Scholar]
- Jin, W. , & Lu, Z. (1999). Synthesis of a stable form of tertiapin: A high‐affinity inhibitor for inward‐rectifier K+ channels. Biochemistry, 38, 14286–14293. 10.1021/bi991205r [DOI] [PubMed] [Google Scholar]
- June, R. A. , & Nasr, I. (1997). Torsades de pointes with terfenadine ingestion. The American Journal of Emergency Medicine, 15, 542–543. 10.1016/S0735-6757(97)90206-0 [DOI] [PubMed] [Google Scholar]
- Kamiya, K. , Niwa, R. , Morishima, M. , Honjo, H. , & Sanguinetti, M. C. (2008). Molecular determinants of hERG channel block by terfenadine and cisapride. Journal of Pharmacological Sciences, 108, 301–307. 10.1254/jphs.08102FP [DOI] [PMC free article] [PubMed] [Google Scholar]
- Kawada, H. , Inanobe, A. , & Kurachi, Y. (2016). Isolation of proflavine as a blocker of G protein‐gated inward rectifier potassium channels by a cell growth‐based screening system. Neuropharmacology, 109, 18–28. 10.1016/j.neuropharm.2016.05.016 [DOI] [PubMed] [Google Scholar]
- Kilkenny, C. , Browne, W. , Cuthill, I. C. , Emerson, M. , Altman, D. G. , & Group NCRRGW (2010). Animal research: Reporting in vivo experiments: The ARRIVE guidelines. British Journal of Pharmacology, 160, 1577–1579. 10.1111/j.1476-5381.2010.00872.x [DOI] [PMC free article] [PubMed] [Google Scholar]
- Kobayashi, T. , Ikeda, K. , Kojima, H. , Niki, H. , Yano, R. , Yoshioka, T. , & Kumanishi, T. (1999). Ethanol opens G‐protein‐activated inwardly rectifying K+ channels. Nature Neuroscience, 2, 1091–1097. 10.1038/16019 [DOI] [PubMed] [Google Scholar]
- Kofuji, P. , Doupnik, C. A. , Davidson, N. , & Lester, H. A. (1996). A unique P‐region residue is required for slow voltage‐dependent gating of a G protein‐activated inward rectifier K+ channel expressed in Xenopus oocytes. The Journal of Physiology, 490 (Pt 3, 633–645. 10.1113/jphysiol.1996.sp021173 [DOI] [PMC free article] [PubMed] [Google Scholar]
- Krapivinsky, G. , Gordon, E. A. , Wickman, K. , Velimirovic, B. , Krapivinsky, L. , & Clapham, D. E. (1995). The G‐protein‐gated atrial K+ channel IKACh is a heteromultimer of two inwardly rectifying K+‐channel proteins. Nature, 374, 135–141. 10.1038/374135a0 [DOI] [PubMed] [Google Scholar]
- Kubo, Y. , & Iizuka, M. (1996). Identification of domains of the cardiac inward rectifying K+ channel, CIR, involved in the heteromultimer formation and in the G‐protein gating. Biochemical and Biophysical Research Communications, 227, 240–247. 10.1006/bbrc.1996.1496 [DOI] [PubMed] [Google Scholar]
- Kubo, Y. , Reuveny, E. , Slesinger, P. A. , Jan, Y. N. , & Jan, L. Y. (1993). Primary structure and functional expression of a rat G‐protein‐coupled muscarinic potassium channel. Nature, 364, 802–806. 10.1038/364802a0 [DOI] [PubMed] [Google Scholar]
- Kurachi, Y. , Nakajima, T. , & Sugimoto, T. (1987). Short‐term desensitization of muscarinic K+ channel current in isolated atrial myocytes and possible role of GTP‐binding proteins. Pflügers Archiv, 410, 227–233. 10.1007/BF00580270 [DOI] [PubMed] [Google Scholar]
- Lesage, F. , Duprat, F. , Fink, M. , Guillemare, E. , Coppola, T. , Lazdunski, M. , & Hugnot, J. P. (1994). Cloning provides evidence for a family of inward rectifier and G‐protein coupled K+ channels in the brain. FEBS Letters, 353, 37–42. 10.1016/0014-5793(94)01007-2 [DOI] [PubMed] [Google Scholar]
- Liao, Y. J. , Jan, Y. N. , & Jan, L. Y. (1996). Heteromultimerization of G‐protein‐gated inwardly rectifying K+ channel proteins GIRK1 and GIRK2 and their altered expression in weaver brain. The Journal of Neuroscience, 16, 7137–7150. 10.1523/JNEUROSCI.16-22-07137.1996 [DOI] [PMC free article] [PubMed] [Google Scholar]
- Logothetis, D. E. , Kurachi, Y. , Galper, J. , Neer, E. J. , & Clapham, D. E. (1987). The βγ subunits of GTP‐binding proteins activate the muscarinic K+ channel in heart. Nature, 325, 321–326. 10.1038/325321a0 [DOI] [PubMed] [Google Scholar]
- Marker, C. L. , Stoffel, M. , & Wickman, K. (2004). Spinal G‐protein‐gated K+ channels formed by GIRK1 and GIRK2 subunits modulate thermal nociception and contribute to morphine analgesia. The Journal of Neuroscience, 24, 2806–2812. 10.1523/JNEUROSCI.5251-03.2004 [DOI] [PMC free article] [PubMed] [Google Scholar]
- Masotti, A. , Uva, P. , Davis‐Keppen, L. , Basel‐Vanagaite, L. , Cohen, L. , Pisaneschi, E. , … Dallapiccola, B. (2015). Keppen‐Lubinsky syndrome is caused by mutations in the inwardly rectifying K+ channel encoded by KCNJ6. American Journal of Human Genetics, 96, 295–300. 10.1016/j.ajhg.2014.12.011 [DOI] [PMC free article] [PubMed] [Google Scholar]
- Mcgrath, J. C. , & Lilley, E. (2015). Implementing guidelines on reporting research using animals (ARRIVE etc.): New requirements for publication in BJP. British Journal of Pharmacology, 172, 3189–3193. 10.1111/bph.12955 [DOI] [PMC free article] [PubMed] [Google Scholar]
- Merlos, M. , Giral, M. , Balsa, D. , Ferrando, R. , Queralt, M. , Puigdemont, A. , … Forn, J. (1997). Rupatadine, a new potent, orally active dual antagonist of histamine and platelet‐activating factor (PAF). The Journal of Pharmacology and Experimental Therapeutics, 280, 114–121. [PubMed] [Google Scholar]
- Monahan, B. P. , Ferguson, C. L. , Killeavy, E. S. , Lloyd, B. K. , Troy, J. , & Cantilena, L. R. Jr. (1990). Torsades de pointes occurring in association with terfenadine use. Jama, 264, 2788–2790. 10.1001/jama.1990.03450210088038 [DOI] [PubMed] [Google Scholar]
- Murata, Y. , Iwasaki, H. , Sasaki, M. , Inaba, K. , & Okamura, Y. (2005). Phosphoinositide phosphatase activity coupled to an intrinsic voltage sensor. Nature, 435, 1239–1243. 10.1038/nature03650 [DOI] [PubMed] [Google Scholar]
- Myokai, T. , Ryu, S. , Shimizu, H. , & Oiki, S. (2008). Topological mapping of the asymmetric drug binding to the human ether‐a‐go‐go‐related gene product (HERG) potassium channel by use of tandem dimers. Molecular Pharmacology, 73, 1643–1651. 10.1124/mol.107.042085 [DOI] [PubMed] [Google Scholar]
- Nishio, M. , Habuchi, Y. , Tanaka, H. , Morikawa, J. , Yamamoto, T. , & Kashima, K. (1998). Blockage by terfenadine of the adenosine triphosphate (ATP)‐sensitive K+ current in rabbit ventricular myocytes. The Journal of Pharmacology and Experimental Therapeutics, 287, 293–300. [PubMed] [Google Scholar]
- Paris, D. G. , Parente, T. F. , Bruschetta, H. R. , Guzman, E. , & Niarchos, A. P. (1994). Torsades de pointes induced by erythromycin and terfenadine. The American Journal of Emergency Medicine, 12, 636–638. 10.1016/0735-6757(94)90029-9 [DOI] [PubMed] [Google Scholar]
- Patil, N. , Cox, D. R. , Bhat, D. , Faham, M. , Myers, R. M. , & Peterson, A. S. (1995). A potassium channel mutation in weaver mice implicates membrane excitability in granule cell differentiation. Nature Genetics, 11, 126–129. 10.1038/ng1095-126 [DOI] [PubMed] [Google Scholar]
- Pettersen, E. F. , Goddard, T. D. , Huang, C. C. , Couch, G. S. , Greenblatt, D. M. , Meng, E. C. , & Ferrin, T. E. (2004). UCSF Chimera—A visualization system for exploratory research and analysis. Journal of Computational Chemistry, 25, 1605–1612. 10.1002/jcc.20084 [DOI] [PubMed] [Google Scholar]
- Pratt, C. M. , Mason, J. , Russell, T. , Reynolds, R. , & Ahlbrandt, R. (1999). Cardiovascular safety of fexofenadine HCl. The American Journal of Cardiology, 83, 1451–1454. 10.1016/S0002-9149(99)00124-1 [DOI] [PubMed] [Google Scholar]
- Reuveny, E. , Slesinger, P. A. , Inglese, J. , Morales, J. M. , Iniguez‐Lluhi, J. A. , Lefkowitz, R. J. , … Jan, L. Y. (1994). Activation of the cloned muscarinic potassium channel by G protein βγ subunits. Nature, 370, 143–146. 10.1038/370143a0 [DOI] [PubMed] [Google Scholar]
- Sadja, R. , Smadja, K. , Alagem, N. , & Reuveny, E. (2001). Coupling Gβγ‐dependent activation to channel opening via pore elements in inwardly rectifying potassium channels. Neuron, 29, 669–680. 10.1016/S0896-6273(01)00242-2 [DOI] [PubMed] [Google Scholar]
- Silverman, S. K. , Lester, H. A. , & Dougherty, D. A. (1998). Asymmetrical contributions of subunit pore regions to ion selectivity in an inward rectifier K+ channel. Biophysical Journal, 75, 1330–1339. 10.1016/S0006-3495(98)74051-2 [DOI] [PMC free article] [PubMed] [Google Scholar]
- Simons, F. E. , & Simons, K. J. (2008). H1 antihistamines: Current status and future directions. World Allergy Organization Journal, 1, 145–155. 10.1097/WOX.0b013e318186fb3a [DOI] [PMC free article] [PubMed] [Google Scholar]
- Slesinger, P. A. (2001). Ion selectivity filter regulates local anesthetic inhibition of G‐protein‐gated inwardly rectifying K+ channels. Biophysical Journal, 80, 707–718. 10.1016/S0006-3495(01)76050-X [DOI] [PMC free article] [PubMed] [Google Scholar]
- Studer, G. , Biasini, M. , & Schwede, T. (2014). Assessing the local structural quality of transmembrane protein models using statistical potentials (QMEANBrane). Bioinformatics, 30, i505–i511. 10.1093/bioinformatics/btu457 [DOI] [PMC free article] [PubMed] [Google Scholar]
- Taglialatela, M. , Castaldo, P. , Pannaccione, A. , Giorgio, G. , Genovese, A. , Marone, G. , & Annunziato, L. (1999). Cardiac ion channels and antihistamines: Possible mechanisms of cardiotoxicity. Clinical and Experimental Allergy, 29(Suppl 3), 182–189. 10.1046/j.1365-2222.1999.0290s3182.x [DOI] [PubMed] [Google Scholar]
- Taglialatela, M. , Pannaccione, A. , Castaldo, P. , Giorgio, G. , Zhou, Z. , January, C. T. , … Annunziato, L. (1998). Molecular basis for the lack of HERG K+ channel block‐related cardiotoxicity by the H1 receptor blocker cetirizine compared with other second‐generation antihistamines. Molecular Pharmacology, 54, 113–121. 10.1124/mol.54.1.113 [DOI] [PubMed] [Google Scholar]
- Tateyama, M. , & Kubo, Y. (2018). Gi/o‐coupled muscarinic receptors co‐localize with GIRK channel for efficient channel activation. PLoS ONE, 13, e0204447 10.1371/journal.pone.0204447 [DOI] [PMC free article] [PubMed] [Google Scholar]
- Terrien, M. H. , Rahm, F. , Fellrath, J. M. , & Spertini, F. (1999). Comparison of the effects of terfenadine with fexofenadine on nasal provocation tests with allergen. The Journal of Allergy and Clinical Immunology, 103, 1025–1030. 10.1016/S0091-6749(99)70174-0 [DOI] [PubMed] [Google Scholar]
- Wang, W. , & Mackinnon, R. (2017). Cryo‐EM structure of the open human ether‐a‐go‐go‐related K+ channel hERG. Cell, 169, 422–430 e10. [DOI] [PMC free article] [PubMed] [Google Scholar]
- Waterhouse, A. , Bertoni, M. , Bienert, S. , Studer, G. , Tauriello, G. , Gumienny, R. , … Schwede, T. (2018). SWISS‐MODEL: Homology modelling of protein structures and complexes. Nucleic Acids Research, 46, W296–W303. 10.1093/nar/gky427 [DOI] [PMC free article] [PubMed] [Google Scholar]
- Weber, W. (1999). Ion currents of Xenopus laevis oocytes: State of the art. Biochimica et Biophysica Acta, 1421, 213–233. 10.1016/S0005-2736(99)00135-2 [DOI] [PubMed] [Google Scholar]
- Whorton, M. R. , & Mackinnon, R. (2011). Crystal structure of the mammalian GIRK2 K+ channel and gating regulation by G proteins, PIP2, and sodium. Cell, 147, 199–208. 10.1016/j.cell.2011.07.046 [DOI] [PMC free article] [PubMed] [Google Scholar]
- Whorton, M. R. , & Mackinnon, R. (2013). X‐ray structure of the mammalian GIRK2‐βγ G‐protein complex. Nature, 498, 190–197. 10.1038/nature12241 [DOI] [PMC free article] [PubMed] [Google Scholar]
- Wilkins, M. R. , Gasteiger, E. , Bairoch, A. , Sanchez, J. C. , Williams, K. L. , Appel, R. D. , & Hochstrasser, D. F. (1999). Protein identification and analysis tools in the ExPASy server. Methods in Molecular Biology, 112, 531–552. [DOI] [PubMed] [Google Scholar]
- Wishart, D. S. , Knox, C. , Guo, A. C. , Shrivastava, S. , Hassanali, M. , Stothard, P. , … Woolsey, J. (2006). DrugBank: A comprehensive resource for in silico drug discovery and exploration. Nucleic Acids Research, 34, D668–D672. 10.1093/nar/gkj067 [DOI] [PMC free article] [PubMed] [Google Scholar]
- Woodward, J. K. , & Munro, N. L. (1982). Terfenadine, the first non‐sedating antihistamine. Arzneimittel‐Forschung, 32, 1154–1156. [PubMed] [Google Scholar]
- Zagotta, W. N. (2006). Membrane biology: Permutations of permeability. Nature, 440, 427–429. 10.1038/440427a [DOI] [PubMed] [Google Scholar]
Associated Data
This section collects any data citations, data availability statements, or supplementary materials included in this article.
Supplementary Materials
Table S1. The primers used for constructions of Kir3.1 and Kir3.2 mutants by site‐directed mutagenesis or inverse PCR using PfuUltra II Fusion HS DNA Polymerase kit (Agilent Technologies).
Figure S1. Datasets of the terfenadine effects on different combinations of GIRK wild‐type subunits and mutants in Xenopus oocytes. (A) Currents were recorded with a protocol shown above in oocytes expressing Kir3.4 alone. (B–I) Dose‐inhibition relationships of terfenadine on various combinations of GIRK wild‐type subunits and mutants were evaluated by normalization of the basal current to 1. Each type of symbol indicates a set of data recording in the same cell (n = 1) and a number of n = 6 for each groups from N = 7 frogs. The filled circle indicated the mean with an error bar showing the SD.
Figure S2. Effects of fexofenadine on ACh‐induced GIRK currents in rat atrial myocytes and Xenopus oocytes. (A, B) Whole‐cell currents from rat atrial myocytes were recorded in a 20 mM K+ Tyrode's solution with a protocol shown above and repeated every 3 s in the presence of 1 μM ACh with (A) 10 μM or (B) 100 μM of fexofenadine (FEX). (C) The maximal current amplitude of ACh‐evoked current at −100 mV was normalized as 1 and the current amplitude before application of ACh was subtracted. Normalized current for each group were calculated from current amplitude at −100 mV after application of FEX for 15 s. Data show the means±SD, n = 5 for 10 μM; n = 4 for 100 μM group from N = 4 rats. (D) Inhibitory effect of 100 μM and 1 mM of FEX in oocytes expressing Kir3.1 + Kir3.4 (left panel) and Kir3.1 + Kir3.4 + M R (right panel). Each type of 2 symbol indicates the raw data recorded at different FEX concentrations in the same cell, n = 5 for each from N = 2 frogs. In the left panel, current amplitude of the basal current was normalized to 1. In the right panel, maximal current amplitude in the presence of 1 μM ACh alone was normalized to 1. The current amplitude in ND96 solution was subtracted. (E) Currents induced by 10 μM ivermectin (IVM) in the presence of FEX in oocytes expressing Kir3.1 + Kir3.2. The current amplitude in the presence of 10 μM IVM alone was normalized to 1, n = 5 for each from N = 1 frog.
Figure S3. Scheme of Kir3.2‐Kir3.1 dimer and the terfenadine effects. Dimers were constructed as shown upper part of the panel (see detail in Methods). Currents were recorded with a protocol shown above in oocytes expressing (A) Kir3.2‐Kir3.1 wild‐type dimer and (B) Kir3.2‐Kir3.1 F137S dimer. Black traces indicate the basal currents and red traces indicate the currents in the presence of 100 μM trefenadine (TER) in the same cell. Data were recorded using oocytes from N = 1 frog.
Figure S4. Currents of homomeric Kir3.1 F137S channel. (A–C) Na+ current and K+ current in (A) non‐injected oocytes or oocytes expressing (B) Kir3.1 F137S alone or (C) Kir3.1 F137S + Gβ1 + Gγ2. Currents were recorded with a protocol shown above in the ND96 solution (blue trace) and the high K+ solution in the absence (black trace) or presence of 100 μM of terfenadine (TER, red trace) in the same cell. (D) Current amplitudes at −100 mV. Each circle symbol indicates each raw data and some of the symbols overlap with each other, means±SD, n = 5 for each from N = 1 frog (*statistically significant difference, paired t‐test).
Figure S5. (A) The crystal structure of mouse Kir3.2 (Protein Data Bank ID: 3SYA) (Whorton and Mackinon, 2011). (B–M) Homology models of Kir3.2 S148 mutants' structures based on the WT structure (3SYA). Light blue color shows the pore helix and yellow color shows the selectivity filter (SF). Green sticks indicate the side‐chain of the amino acid located at the residue position 148 with elements colored as follows: red refers to O; blue refers to N; yellow refers to S.
Figure S6. Current–voltage relationships. Currents were recorded with a ramp protocol from −100 to +40 mV for 1 s, repeating every 5 s to monitor the changes of current amplitude. (A) In oocytes expressing Kir3.2 wild‐type, the K+ current (IK) was recorded in a 96 mM K+ bath solution and the current in the presence of 3 mM Ba2+ (the blue trace in left panel) was subtracted to remove leak and endogenous currents. In the same cell, the Na+ current (INa) was subsequently recorded by replacing the bath solution with a 96 mM Na+ bath solution and the current in the presence of 3 mM Ba2+ (the gray trace in right panel) was also subtracted. (B) Currents were recorded in the 96 mM K+ bath solution and subsequently in the Na+ bath solution in oocytes injected with water alone. Data were recorded using oocytes from N = 1 frog.
Figure S7. K+ selectivity of Kir3.2 S148 mutant homotetramers. (A) Current‐voltage curves in oocytes expressing various Kir3.2 wild‐type and various S148 mutants respectively. Currents were recorded with a ramp protocol from −100 to +40 mV for 1 s, repeating every 5 s. The K+ current (IK, black traces), in the oocytes expressing a channel with normal K+ selectivity (the wild‐type, G, A, T, D, E and N mutants), was recorded in a 96 mM K+ bath solution and the current in the presence of 3 mM Ba2+ was subtracted to remove the variation of endogenous current. The Na+ current (INa, red traces) was recorded in a 96 mM Na+ bath solution in the same cell and the current in the presence of 3 mM Ba2+ was also subtracted. In the case of oocytes expressing a channel with abnormal K+ selectivity (the F, V, L, M, Y and W mutants), a averaged current amplitude from the current recorded in oocytes injected water alone (n = 6) was subtracted to remove the endogenous current (see the detail in Supporting Information Figure S6B). (B) The relationship between INa/IK or PNa/PK and the polarity of each amino acid at the position Ser148 in Kir3.2 wild‐type and mutants. The polarity scale was predicted by Grantham's method using ExPASy. (C) The relationship between INa/IK or PNa/PK and the side‐chain volume of amino acids. Dotted lines indicate the zero level. Data show the means±SD, n = 8 for S148F, n = 7 for S148 W and n = 6 for the others from N = 4 frogs.
Figure S8. (A) Dose‐inhibition relationships of the terfenadine effect on Kir3.2 S148 mutants. Each type of symbol indicates a set of data recording in the same cell (n = 1) and n = 6 for WT and S148D; n = 5 for the others from N = 8 frogs. The filled circle indicated the mean with an error bar showing the SD. (B) Dose‐inhibition relationship of methanol (0.49, 4.9, 49, 147 mM) on Kir3.2 wild‐type and S148G mutant, n = 5 for each from N = 1 frog. (C) Effects of methanol and terfenadine on the current of Kir3.2 S148G at −100 mV.
Figure S9. Current blocking by terfenadine at different membrane potentials. (A) Currents were recorded in the high K+ (96 mM) solution in the absence (black trace) and presence 100 μM of terfenadine (TER, red trace) or 3 mM Ba2+ (blue trace) from oocytes expressing Kir3.1 + Kir3.2 with a protocol shown above: a voltage ramp from −100 to +40 mV for 1 s followed a pulse at −100 mV for 50 ms, and returned to 0 mV after a pulse of +40 mV for 50 ms. The current ratio was calculated from the current amplitude in the presence of TER to the current before the application of TER and the current amplitude in the presence of Ba2+ was subtracted. (B) Inhibition % at −100 mV and +40 mV were calculated by the averaged current amplitude from the last 20 ms of the −100 mV pulse before the ramp pulse and the first 20 ms of the +40 mV pulse after the ramp pulse, means±SD, n = 7 for each from N = 1 frog (unpaired t‐test).
Figure S10. Effects of terfenadine on the current of wild‐type Kir3.1/Kir3.4 and Kir3.1 S170P/Kir3.4 S176P mutant. (A, B) Currents were recorded in oocytes expressing (A) Kir3.1 + Kir3.4 or (B) Kir3.1 S170P + Kir3.4 S176P with a protocol as shown above, every 5 s, in the high K+ solution. The current amplitude in ND96 solution was subtracted. Current traces before (black trace) and after the application of 100 μM terfenadine (TER, red trace) are shown. Right panels show the time courses of current change at −100 mV and +40 mV. (C) Inhibition% of current by TER. Basal current amplitude was normalized as 100%. (D, E) The inhibition kinetics of current by 100 μM terfenadine. Tau‐fast (D) and Tau‐slow (E) of inhibition were calculated by the current reduction from the maximal level to the minimal level. Data show each raw data and means±SD, n = 7 for each from N = 2 frogs (*: statistically significant difference; n.s.: not statistically significant, unpaired t‐test).
Figure S11. Dose‐inhibition relationships of terfenadine in the absence or presence of 100 μM fexofenadine in oocytes expressing Kir3.1 + Kir3.2. Normalized currents were plotted by calculating the current amplitude at −100 mV. The current amplitude in the ND96 solution was subtracted and the basal current was normalized to 1. Data show the means±SD, n = 5 for each from N = 3 frogs.