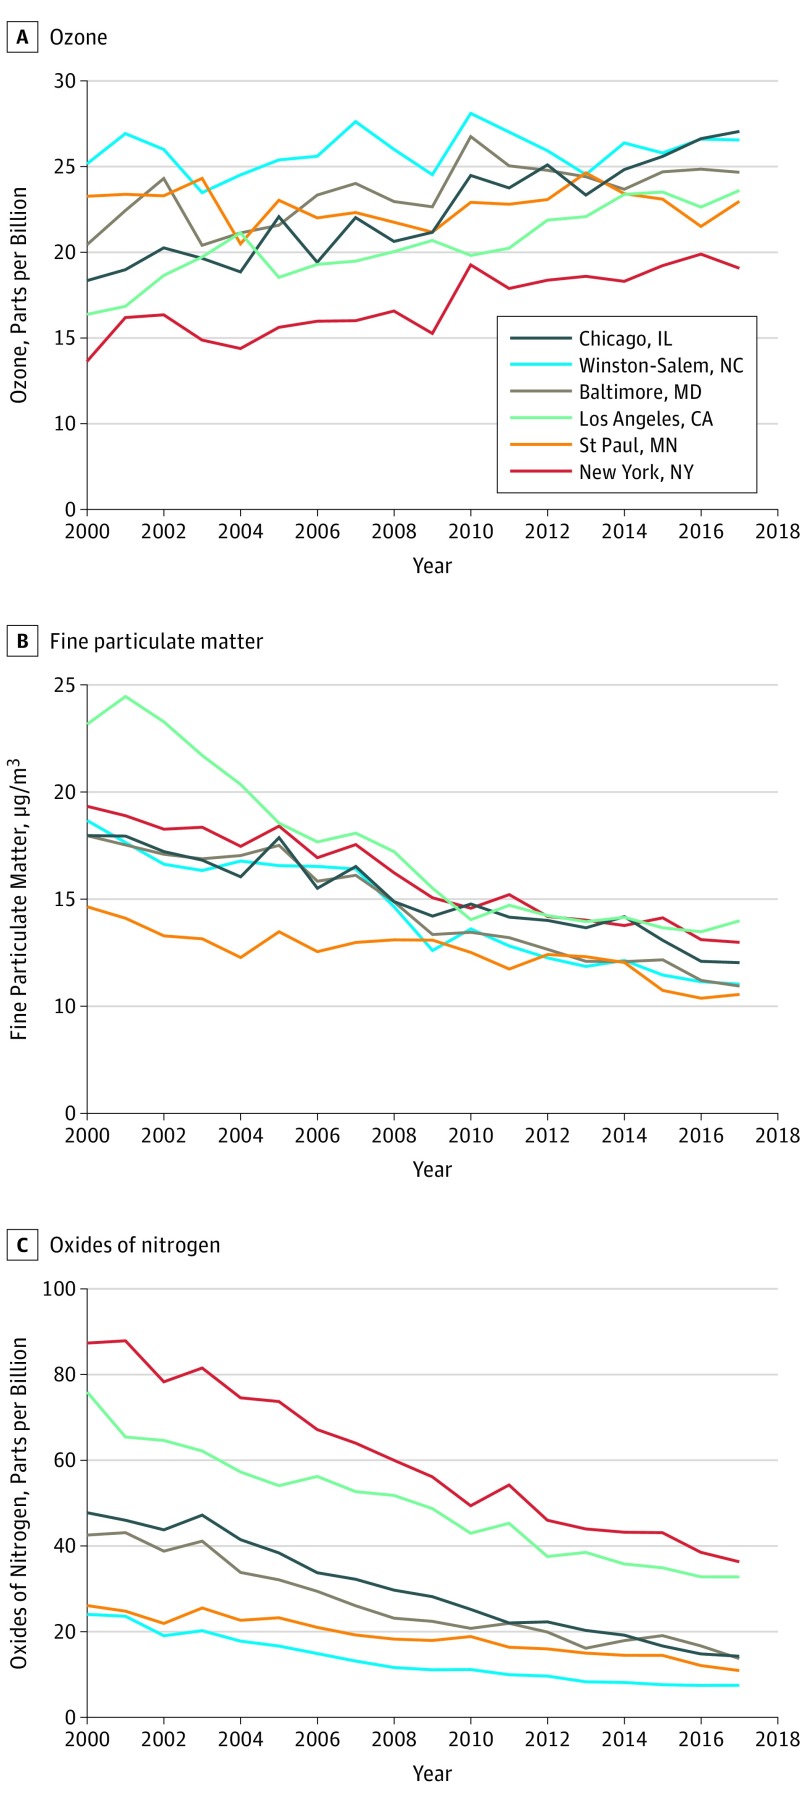
Figure 2. Annual Mean Air Pollution Concentrations per Year Based on Location.
Metropolitan area temporal trends in air pollution exposures are shown based on annual mean concentrations for all participants in each area from continuous 2-week average concentrations from 2000 through follow-up. The exposure data included 1037 participants in Winston-Salem, NC; 1182 in New York, NY, and Rockland County, NY; 1054 in Baltimore, MD; 1021 in St Paul, MN; 1142 in Chicago, IL; and 1424 in the Los Angeles Basin area.

