

ABSTRACT
Background
Minimal human data exist on liver vitamin A (VA) compared with serum biomarkers. Cutoffs of 5% and 10% total serum VA as retinyl esters (REs) suggest a VA intoxication diagnosis.
Objectives
We compared total liver VA reserves (TLRs) with the percentage of total serum VA as REs to evaluate hypervitaminosis with the use of US adult autopsy samples. Secondary objectives evaluated serum retinol sensitivity, TLRs among lobes, and hepatic α-retinol concentrations, an α-carotene cleavage product.
Design
Matched serum and liver samples were procured from cadavers (n = 27; mean ± SD age: 70.7 ± 14.9 y; range: 49–101 y). TLRs and α-REs were quantified by ultra-performance liquid chromatography. Pearson correlations showed liver and serum associations. Sensitivity and specificity were calculated for >5%, 7.5%, and 10% total serum VA as REs to predict TLRs and for serum retinol <0.7 and 1 μmol/L to predict deficiency.
Results
Serum RE concentrations were correlated with TLRs (r = 0.497, P < 0.001). Nine subjects (33%) had hypervitaminosis A (≥1.0 μmol VA/g liver), 2 of whom had >7.5% total serum VA as REs; histologic indicators corroborated toxicity at 3 μmol/g liver. No subject had >10% total serum VA as REs. Serum retinol sensitivity to determine deficiency (TLRs <0.1 μmol VA/g) was 83% at 0.7 and 1 μmol/L. Hepatic α-retinol was positively correlated with age (P = 0.047), but removing an outlier nullified significance.
Conclusions
This study evaluated serum REs as a biomarker of VA status against TLRs (gold standard), and abnormal histology suggested that 7.5% total serum VA as REs is diagnostic for toxicity at the individual level in adults. The long-term impact of VA supplements and fortificants on VA status is currently unknown. Considering the high prevalence of hypervitaminotic TLRs in this cohort, and given that many countries are adding preformed VA to processed products, population biomarkers diagnosing hypervitaminosis before toxicity are urgently needed.
This trial was registered at clinicaltrials.govas NCT03305042.
Keywords: aging, α-retinol, hypervitaminosis A, toxicity, vitamin A biomarkers
INTRODUCTION
Minimally invasive, accurate biomarkers of vitamin A (VA) status are needed at the population level to identify groups at risk of VA deficiency (VAD) and hypervitaminosis A (1). VA is critical for growth, reproduction, vision, and immunity; and deficiency is implicated in childhood morbidity, mortality, and blindness (2). Chronic VA toxicity can occur from ingestion of moderate levels of preformed VA for months or years. The elderly are particularly sensitive, with ill effects including anemia, bone abnormalities, edema, elevated cerebrospinal pressure, fatigue, headache, hepatotoxicity, and skin abnormalities, among others (reviewed in references 3 and 4).
The VA status in the United States is assumed to be adequate, but ∼40% of the population aged >1 y consume less than the Estimated Average Requirement (5). In low-income US pregnant women, 9% had low liver VA stores (6). On the other hand, mandatory milk and margarine fortification (7), voluntary fortification of snack foods (8), and increased consumption of VA supplements and multivitamins (9–11) cause concern for overconsumption of preformed VA (3, 8), particularly in the elderly who have had long-term exposure to fortified foods and supplements. Indeed, the increased consumption of preformed VA and low intakes of carotenoids from fruit and vegetables may, in part, explain the increasing rates of osteoporosis in the United States (12).
Optimal liver VA reserves are 0.1–0.7 μmol/g liver (1). Actual liver samples are the gold standard for assessing VA status, but biopsy is expensive and invasive. The WHO-recommended population indicator of VAD is a serum retinol concentration <0.7 μmol/L in combination with other biomarkers or surveys (13). However, serum retinol is homeostatically controlled, influenced by inflammation (14), and often does not correctly identify cases of VAD when compared with total liver VA reserves (TLRs) calculated with more accurate assays, such as stable retinol isotope dilution (RID) (15). Although RID provides a more accurate estimate of TLRs and was correlated with long-term exposure to VA intake in US women (16), it is currently not feasible for population evaluations (1).
Serum retinyl esters (REs) are used to measure intoxication, but human studies have not validated this biomarker against actual TLRs and liver histology. The original work proposing serum REs as a measure of VA toxicity included 3 patients with clinical, chronic toxicity due to high-dose VA supplement usage (17). In these patients, 41–67% total serum VA as REs was determined within 3 wk of supplement cessation, but liver was not available (17). Current cutoffs for intoxication are 10% total serum VA as REs in adults based on supplement usage (1, 18) and a proposed cutoff of 5% in children based on comparison with TLRs measured by RID (19). These cutoffs are similar to those found in rhesus monkeys (5.5–23%) (20) with toxic VA status assessed at necropsy (mean ± SD: 17.0 ± 6.3 μmol VA/g liver) (21), but matched human serum and liver data are lacking and urgently needed (1). The primary objective of this study was to analyze TLRs, liver histology, and serum indicators of VA collected from US adult cadavers and evaluate percentage total serum VA as REs as a biomarker of hypervitaminosis A and toxic status via correlation, sensitivity, and specificity. Secondary objectives evaluated serum retinol concentration sensitivity and specificity for VAD, determined variation in TLRs among hepatic lobes, and quantified liver α-REs, a cleavage product of α-carotene.
METHODS
Sample procurement
Matched human liver and serum samples were collected from 27 cadavers, 13 male and 14 female, and acquired as a consecutive sample through a request to the National Disease Research Interchange Service (Figure 1). Because this research involved decedents, the protocol (2015–1482) was submitted to and exempted from review by the University of Wisconsin–Madison Health Sciences Institutional Review Board. The trial was registered as NCT03305042. Ages ranged from 49 to 101 y and BMI (in kg/m2) ranged from 13 to 67 (Table 1). Deidentified clinical summaries were obtained from notes taken at autopsy. We planned to analyze all samples obtained during the active period of funding, review these summaries, and perform statistical tests to determine potential outliers. The donor criteria were as follows: no restrictions on race or sex, no history of chemotherapy and/or radiation, no history of prolonged endotracheal intubation or ventilation, no evidence of sepsis or infectious disease (negative serology panel), and age ranges of 21–54, 55–74, and ≥75 y (target collection was 5 male and 5 female donors per age range to provide a nonhomogeneous sample). After 10 individuals were acquired in each of the 2 higher age ranges (i.e., 55–74 and ≥75 y), samples were no longer requested for individuals aged ≥55 y.
FIGURE 1.
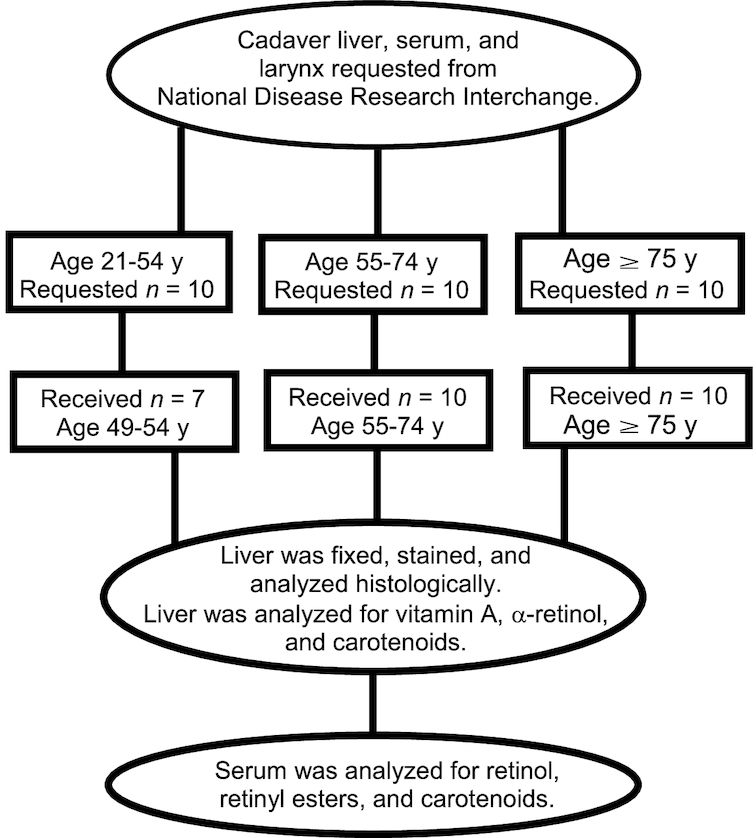
CONSORT chart for sample requests and procurement from cadavers (n = 27). Samples were requested over a 4-y period. Equal numbers from each age range and sex were requested. A total of 13 male and 14 female donors were received. Larynx data will be published elsewhere. CONSORT, Consolidated Standards of Reporting Trials.
TABLE 1.
Descriptive statistics and measures of vitamin A status in liver and serum for 13 male and 14 female adults postmortem
| n 1 | Mean ± SD | Median | Minimum | Maximum | |
|---|---|---|---|---|---|
| Age, y | 27 | 70.7 ± 14.9 | 70.0 | 49 | 101 |
| BMI, kg/m2 | 27 | 26.5 ± 12.5 | 23.8 | 13.1 | 67.3 |
| Liver parameters | |||||
| Total vitamin A reserves, µmol/g | 27 | 0.77 ± 0.96 | 0.31 | 0.001 | 3.38 |
| Total α-retinol,2 nmol/g | 27 | 10.1 ± 14.1 | 7.68 | 0 | 73 |
| Lycopene, nmol/g | 26 | 3.0 ± 5.6 | 0.58 | Not detected | 24 |
| α-Carotene, nmol/g | 26 | 0.8 ± 0.8 | 0.45 | Not detected | 2.7 |
| β-Carotene, nmol/g | 26 | 2.1 ± 2.1 | 1.5 | Not detected | 6.7 |
| Serum parameters | |||||
| Retinol, µmol/L | 27 | 1.14 ± 0.81 | 1.00 | 0.065 | 3.14 |
| Retinyl esters, nmol/L | 27 | 19.8 ± 24.4 | 10.4 | 0 | 109 |
| Total retinol as esters, % | 27 | 2.1 ± 2.4 | 1.5 | 0.0 | 9.6 |
| Lycopene, nmol/L | 24 | 21 ± 15 | 13 | Not detected | 50 |
| α-Carotene, nmol/L | 24 | 21 ± 25 | 12 | Not detected | 95 |
| β-Carotene, nmol/L | 24 | 140 ± 130 | 110 | 12 | 510 |
| C-reactive protein, mg/L | 25 | 102 ± 85.5 | 81.6 | 1.04 | 293 |
| α1-Acid glycoprotein, g/L | 25 | 3.17 ± 1.16 | 2.98 | 1.06 | 5.28 |
1From clinical summaries of the 27 cadavers: 1 was African American, 2 were Hispanic, and 24 were Caucasian.
2Includes the esters (majority) + free α-retinol.
Tissue procurement was kept open during the active period of the funding. The procurement protocol numbers were DWEN1 002 022, 002 023, and 002 024 for frozen liver, embedded liver, and serum, respectively. All tissues and sera were procured ≤16 h postmortem from September 2013 through August 2016. We set a 16-h postmortem cutoff because in whole blood from US volunteers, retinol and retinyl palmitate were stable at 32°C for ≥24 h, whereas small increases were noted for the carotenes (22). In Thai autopsy samples collected from 3 to 103 h postmortem, neither plasma nor liver VA values were significantly affected by the interval between death and autopsy (23). Peripheral blood was sampled from the femoral vein, which is best practice during autopsies. Serum samples were isolated via gel separation and then frozen; primary liver samples were snap frozen in liquid nitrogen; a second liver sample from each donor was embedded in optimal cutting temperature compound and snap frozen in a cryomold. Two livers were procured almost whole and evaluated for VA distribution within and among lobes. Samples were shipped on dry ice to Madison, Wisconsin, and stored in a −80°C freezer.
Liver samples
Optimal cutting temperature compound–embedded samples were prepared as 5-µm frozen sections with the use of a cryostat and stained with the use of routine hematoxylin and eosin and Masson's trichrome protocols and reagents (Newcomer Supply). Images were captured with the use of a Nikon E-600 bright field microscope and an Olympus DP-71 digital microscopy camera.
Liver samples (1 g) for VA (which includes retinol and REs) and carotenoid analyses were weighed and then ground with sodium sulfate (4–5 g) in a mortar and pestle, following published methods (24) with minor modifications. Purified C-23 β-apo-carotenol was added as an internal standard to determine extraction efficiencies. Samples were extracted repeatedly with dichloromethane and filtered through Whatman #1 paper (GE Healthcare Life Sciences) into 50-mL volumetric flasks. An aliquot (5 mL) was dried under nitrogen and fully redissolved in 300 µL methanol:dichloroethane (75:25, volume:volume), and an aliquot of 1 µL was injected into a Waters Acquity H-Class ultra-pressure liquid chromatograph (UPLC) system equipped with a photodiode array detector. Aliquots were further saponified for quantification of total α-retinol as described below for the lobe analyses.
For the liver lobe sample evaluations, 1-g samples were extracted in triplicate from each available lobe into a total volume of 50 mL. A 5-mL aliquot of the extract was dried under nitrogen, resuspended in 0.75 mL ethanol with 0.1% butylated hydroxytoluene added as an antioxidant, and saponified with 400 μL potassium hydroxide:water (50:50, weight:volume) at 45°C for 45 min. The reaction was quenched with 0.5 mL water and extracted 3 times with 0.5 mL hexanes. The hexane layers were pooled and dried under nitrogen and redissolved in 150 µL methanol:dichloroethane (75:25, volume:volume), and an aliquot of 1 µL was injected into the UPLC system. Extraction efficiencies for the liver analyses were 72%.
Serum samples
Serum samples (0.5 mL) were divided into aliquots in test tubes for retinol and RE determination; 1.25 × volume of ethanol was added to denature proteins. The internal standard C23-β-apo-carotenol was added for extraction efficiencies, which were ∼100% from the extraction procedure (24). Samples were extracted 3 times with 0.75 mL hexanes; the supernatant fractions were pooled and dried under nitrogen and reconstituted in 100 µL methanol:dichloroethane (75:25, volume:volume). Two microliters was injected into the UPLC under the conditions described below. Serum C-reactive protein (CRP) and α1-acid glycoprotein (AGP) were analyzed to evaluate inflammation with the use of ELISA kits (CRP: Cayman Chemical Company; AGP: Abcam). Lycopene and α- and β-carotene concentrations were determined by routine HPLC analysis (25).
UPLC method
A Waters Acquity UPLC HSS C18 1.8-µm VanGuard precolumn was used in conjunction with a Waters Acquity UPLC HSS C18 column (1.8 µm, 2.1 × 150 mm). The method utilized 2 solvent mixes programmed for a 29-min gradient. Solvent A was acetonitrile:water:isopropanol (70:25:5, volume:volume:volume) with 10 mmol ammonium acetate/L and solvent B was methanol:isopropanol (75:25, volume:volume). The column temperature was set to 32°C and the flow rate was 0.4 mL/min. The gradient began by holding 100% solvent A for 7 min, followed by a 4-min linear transition to 5% A and another transition to 1% A over 12 min. The solvent gradient was then reversed to 100% A in 2 min and equilibrated for 4 min. Chromatograms were generated at 311 nm for α-retinol and α-REs, 325 nm for retinol and REs, and 450 nm for carotenoids. Retinyl oleate and palmitate co-eluted in this UPLC system. α-Retinol and α-REs, derived almost exclusively from α-carotene in the diet, were quantified as a proxy for long-term vegetable exposure. The concentrations were calculated with the use of standard curves derived from authentic HPLC-purified standards of α-retinol and retinol.
Data analysis
Subject demographic data included age, sex, and BMI (Table 1). VA data from serum and liver samples included TLRs in micromoles per gram, liver α-retinol + α-REs in micromoles per gram, serum retinol concentration in micromoles per liter, and serum REs in nanomoles per liter. Serum cutoffs of 5 mg/L for CRP and 1 g/L for AGP were used to denote the presence of inflammation (26). Categories of TLRs were defined as deficient (<0.1 μmol/g) (1, 27), optimal (>0.1 to <0.7 μmol/g), high (0.7–1 μmol/g), and hypervitaminotic (≥1.0 μmol/g) (1). Total body retinol stores were estimated to compare results with other RID data via a formula based on surface area for estimated liver weight used by transplant surgeons (28):
 |
(1) |
 |
(2) |
 |
(3) |
where e is 0.5 for liver concentrations <0.1 μmol/g and 0.8 for those >0.1 μmol/g.
Descriptive statistics were tabulated for subjects’ demographic, inflammation, and VA data (Table 1). The primary outcomes were TLRs, serum REs, and percentage total serum VA as REs with comparison to hepatic histology; the secondary outcomes were serum retinol concentrations, variation in TLRs among lobes, and liver α-REs. Pearson correlations were calculated among the variables; least-squares regression was used to identify influential outliers among significant correlations with the use of Cook's distance. Linear trends between serum retinol concentrations and serum REs with TLRs were determined through least-squares regression and plotted. The percentage total serum VA as REs was calculated as serum REs (µmol/L)/[serum REs (µmol/L) + serum retinol (µmol/L)] × 100, and the numbers of subjects above the predetermined cutoffs of 5% (19) and 10% (1, 18) total serum VA as REs were compared against those with hypervitaminosis A determined by TLRs ≥1.0 µmol/g. We planned to explore other potential cutoffs based on the findings of TLRs and liver histology, which ultimately included 7.5% total serum VA as REs. CVs were determined for TLRs within and among liver lobes.
Sensitivity was defined as the ability of the biomarker to reflect either deficiency or toxicity (i.e., both positive for the condition). Specificity was defined as the congruency of the biomarkers to indicate adequate or normal status (i.e., both negative for the condition). Sensitivity and specificity analyses were conducted with the use of serum retinol concentration cutoffs for deficiency of <0.7 µmol/L (13) and <1 µmol/L (1), with the cutoff for liver VAD of <0.1 µmol/g as the reference (1). It is suggested to adjust serum retinol deficiency cutoffs for inflammation stage determined by CRP (≥5 mg/L) and AGP (≥1 g/L) (26). For illness incubation or late convalescence during the recovery period (elevated CRP or AGP), the adjusted serum retinol cutoff for VAD was 0.6 μmol/L, and at the beginning of recovery (elevated CRP and AGP), it was 0.5 μmol/L; if neither CRP nor AGP were elevated, the cutoff of 0.7 μmol/L was used. By this method, sensitivity and specificity were recalculated. Sensitivity and specificity analyses were also conducted for percentage total serum VA as REs. Data analysis was performed in the Statistical Analysis System (SAS Institute, version 9.4) and Stata/SE 14.1 (StataCorp LP).
RESULTS
Subject characteristics
The causes of death were primarily cardiac and respiratory related; other causes or conditions at death included drug overdose, dementia, granulomatosis with polyangiitis, renal disease, esophageal cancer, natural cause, or unknown. One severely VA-deficient subject had pathologist-confirmed cirrhosis of the liver (Figure 2). Indicators of inflammation were highly elevated, with only 3 subjects in the normal range for CRP (<5 mg/L) and no subjects within the normal range for AGP (<1 g/L).
FIGURE 2.

Representative histology of liver biopsies from human donors in VA-deficient, VA-sufficient, and hypervitaminotic/toxic statuses. Tissue sections were stained with hematoxylin and eosin (left panels) and Masson's trichrome (right panels). The VA-deficient donor had a pathologist-confirmed diagnosis of hepatic cirrhosis. Insets show polynuclear inflammatory cell infiltrate and bilirubin deposit (yellow) in the VA-deficient condition and lipid deposits (white) and stellate cell hypertrophy in the hypervitaminotic A condition; black arrows indicate dense collagen deposition (blue) associated with advanced cirrhosis in the VA-deficient condition; black arrowheads indicate normal collagen deposition associated with connective tissue of the portal triad in the VA-sufficient condition and the central vein in the hypervitaminosis A condition. Scale bar, 50 µm (insets, 25 µm). CV, central vein; pt, portal trial; VA, vitamin A.
Biomarkers of VA status
Biomarkers of VA were highly variable (Table 1). For TLRs, 22% had VAD <0.1 μmol VA/g, 1 subject (4%) was in the high VA range of 0.7–1 μmol VA/g, and 33% had hypervitaminotic concentrations ≥1.0 μmol VA/g (Table 2). Only 11 subjects (41%) were in the optimal range of between 0.1 and 0.7 μmol VA/g liver. Total body retinol stores (mean ± SD) were estimated to be 1300 ± 1500 μmol (range: 2.4–5300 μmol). Histologic evaluation confirmed cirrhosis with breakdown of the perisinusoidal space in 1 subject with severe VAD (0.001 μmol/g liver) and stellate cell hypertrophy in 1 subject with hypervitaminosis A (3.38 μmol/g liver) (Figure 2). Evaluation of all 3 livers ≥2.87 μmol/g revealed perisinusoidal space enlargement and the formation of visible lipid droplets (29). Interpretation of all abnormalities was confirmed with a pathologist at the University of Wisconsin School of Medicine and Public Health, who inspected all slides for consistency. Quantifiable α-REs (Table 1), with free α-retinol in some samples, reflect its ability to accumulate in the ester form in the liver after exposure to vegetables or direct supplementation with α-RE (24, 30, 31).
TABLE 2.
VA indicators and percentage total serum VA as REs categorized by total liver VA reserves1
| Deficient (<0.1 μmol VA/g) | Optimal (≥0.1 to <0.7 μmol VA/g) | High (≥0.7 to <1 μmol VA/g) | Hypervitaminotic (≥1.0 μmol VA/g) | |
|---|---|---|---|---|
| n | 6 | 11 | 1 | 9 |
| Total liver VA reserves, µmol/g | 0.04 ± 0.032 | 0.28 ± 0.14 | 0.77 | 1.85 ± 0.96 |
| Serum retinol, µmol/L | 0.61 ± 0.68 | 1.26 ± 0.85 | 2.77 | 1.17 ± 0.64 |
| Serum REs, nmol/L | 2.27 ± 4.09 | 18.0 ± 14.4 | 24.8 | 33.2 ± 35.0 |
| Total serum VA | ||||
| As REs, % | 0.90 | 1.75 | 0.89 | 3.31 |
| As REs >5%, n | 1 | 0 | 0 | 2 |
| As REs >7.5%, n | 0 | 0 | 0 | 2 |
| As REs >10%, n | 0 | 0 | 0 | 0 |
1Categories for total liver VA reserves, as defined by reference 1. RE, retinyl ester; VA, vitamin A.
2Mean ± SD (all such values); the “High” category had only one subject and therefore does not have an SD.
Serum retinol ranged from 0.07 to 3.14 μmol/L; when serum retinol concentrations from subjects who had hypervitaminosis A (n = 9; mean ± SD: 1.17 ± 0.21 μmol/L) were compared with those subjects who did not (n = 18; mean ± SD: 1.13 ± 0.21 μmol/L), the means were not different (P = 0.90). Three subjects had >5% total serum VA as REs (1 with <0.1 μmol VA/g liver and 2 classified as hypervitaminotic), and no subjects had >10% total serum VA as REs, the generally accepted cutoff for toxicity in adults (1). Serum α-retinol and α-REs were not detectable, which corresponds to α-retinol's inability to bind to retinol-binding protein (32).
Correlations between demographic variables, VA data, and inflammation indicators are shown in Table 3. BMI did not correlate with any variables of interest. TLRs showed a significant positive correlation with serum REs (r = 0.497, P < 0.001) but were not significantly correlated with serum retinol concentrations (r = −0.012, P = 0.95); scatterplots and linear trends of these relations are shown in Figure 3. Serum retinol concentrations were negatively correlated with CRP (r = −0.579, P < 0.001). Total liver α-retinol was positively correlated with age (r = 0.386, P = 0.047), but removal of an influential outlier (age 94 y, liver α-retinol of 73 nmol/g) nullified the significance (r = 0.17, P = 0.42). Serum and liver carotenoid concentrations were low (Table 1), which may reflect limited food intake close to death. Serum and liver lycopene concentrations were highly correlated (r = 0.70, P = 0.0003), whereas α-carotene was not (r = 0.23, P = 0.30). A trend existed between serum and liver β-carotene concentrations (r = 0.40, P = 0.067).
TABLE 3.
Pearson correlation coefficients assessing significant correlations between age, BMI (in kg/m2), and measures of VA1
| Age, y | BMI | Total liver VA reserves, µmol/g | Liver α-retinol, nmol/g | Serum retinol, µmol/L | Serum REs, nmol/L | Total serum VA as REs, % | CRP, mg/L | |
|---|---|---|---|---|---|---|---|---|
| BMI | −0.232 | |||||||
| Total liver VA reserves, µmol/g | 0.280 | −0.183 | ||||||
| Liver α-retinol, nmol/g | 0.386*2 | −0.080 | 0.740*** | |||||
| Serum retinol, µmol/L | 0.086 | 0.043 | −0.012 | 0.105 | ||||
| Serum REs, nmol/L | 0.136 | −0.163 | 0.497** | 0.285 | 0.350 | |||
| Total serum VA as REs, % | 0.109 | −0.238 | 0.657*** | 0.247 | −0.233 | 0.595** | ||
| CRP,3 mg/L | 0.144 | −0.214 | 0.047 | 0.057 | −0.579** | −0.258 | 0.064 | |
| AGP,3 g/L | 0.032 | −0.089 | −0.080 | −0.137 | −0.132 | 0.064 | −0.036 | 0.453* |
1 n = 27. ***P < 0.001, **P < 0.01, *P < 0.05. AGP, α1-acid-glycoprotein; CRP, C-reactive protein; RE, retinyl ester; VA, vitamin A.
2Influential outlier (age 94 y, liver α-retinol of 73 nmol/g), which, when removed, nullifies the significance (r = 0.17, P = 0.42).
3 n = 25.
FIGURE 3.
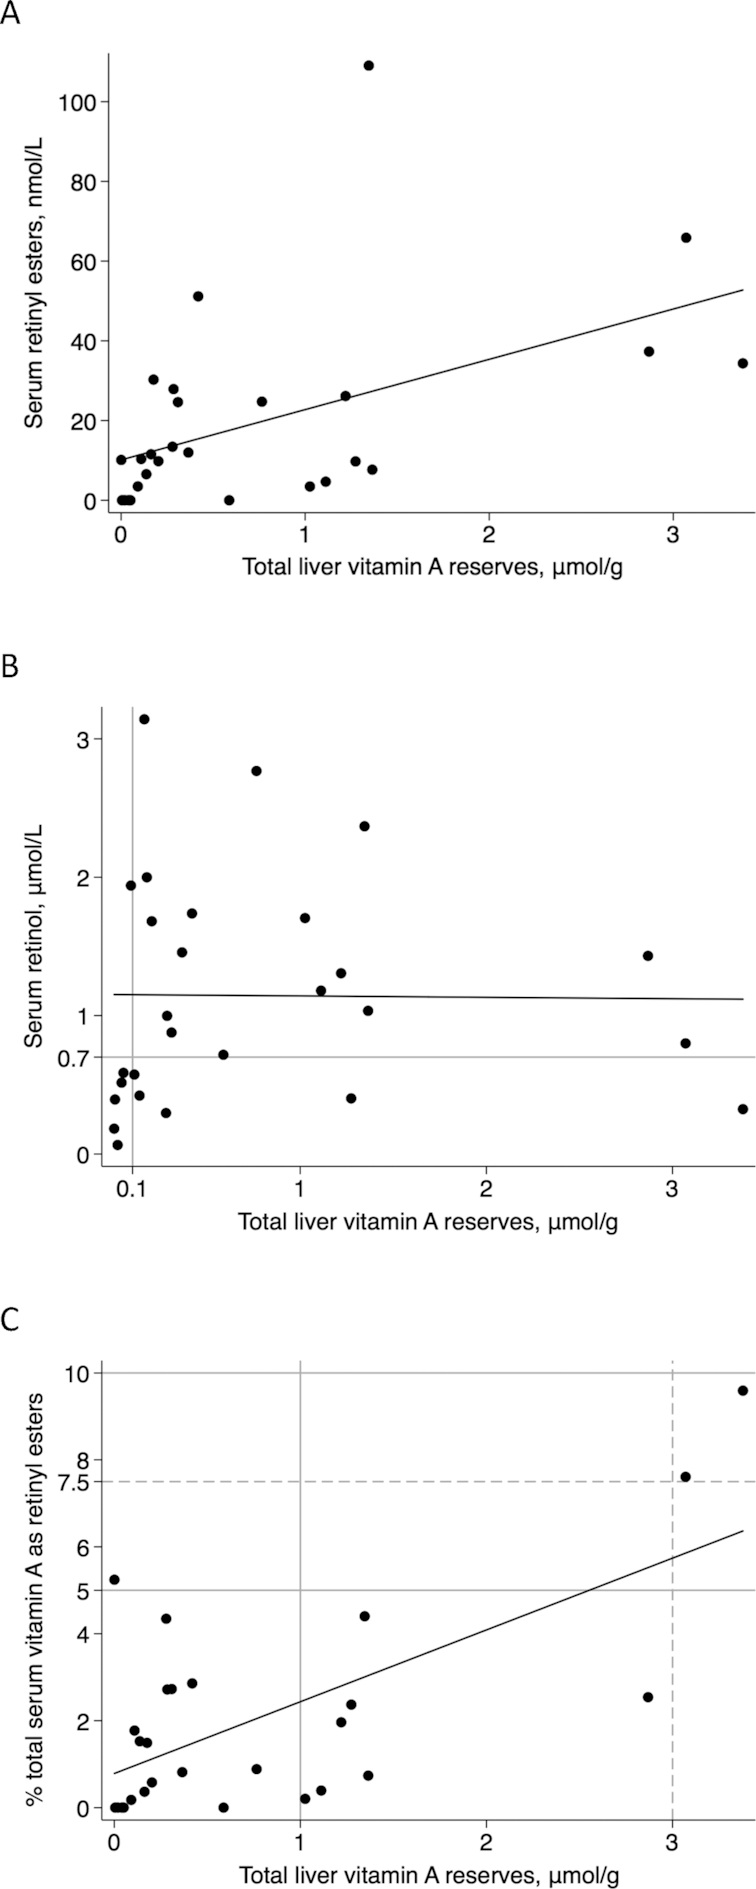
Scatterplots of relations with total liver vitamin A reserves (n = 27). (A) Serum retinyl esters compared with total liver vitamin A reserves (r = 0.497, P = 0.008). (B) Serum retinol concentrations compared with total liver vitamin A reserves represented by the black linear regression line (r = 0.00, P = 0.95). The gray lines are the generally accepted cutoffs for vitamin A deficiency. (C) Percentage total serum vitamin A as retinyl esters compared with total liver vitamin A reserves (r = 0.43, P < 0.001). The solid gray lines are the current cutoffs for hypervitaminosis A (≥1.0 μmol/g liver) and the cutoffs of 5% used for children (19) and 10% used for adults (1) for percentage total serum vitamin A as retinyl esters. The dashed lines are those proposed by the current analyses to indicate vitamin A toxicity in these adult cadavers (i.e., 7.5% total serum vitamin A as retinyl esters and 3 μmol/g liver). Linear regression was used to assess relations.
Sensitivity and specificity evaluation
Sensitivity and specificity evaluations were performed by DJS without reference to subject characteristics. With a serum retinol concentration cutoff for deficiency of <0.7 μmol/L uncorrected for inflammation and the TLR cutoff of <0.1 μmol/g, the sensitivity of serum retinol to determine VAD was 83% and specificity was 76% (Figure 3B). A serum retinol cutoff of <1 μmol/L decreased the specificity to 57% and sensitivity remained the same (Figure 3B). Correcting the 0.7-μmol/L cutoff for subjects’ inflammation status resulted in a decrease in sensitivity to 50% due to false negatives and a slight increase in specificity to 79%. Analysis of the percentage total serum VA as REs to determine hypervitaminosis A with ≥1.0 μmol VA/g liver as the reference value and the cutoff of >5% total serum VA as REs resulted in 22% sensitivity and 94% specificity. No subjects had >10% total serum VA as REs; therefore, sensitivity and specificity could not be calculated at this threshold. Based on TLRs >3 μmol/g liver and abnormal liver histology, the exploratory cutoff of 7.5% total serum VA as REs resulted in sensitivity and specificity of 100% (Figure 3C).
Liver lobe evaluation
In the comparison between the liver lobes, the mean ± SD CV within a lobe was 13.2% ± 5.6% for the subject with optimal VA status (mean ± SD: 0.375 ± 0.060 μmol/g liver; 3 determinations/lobe) and 13.6% ± 8.0% for the subject with hypervitaminosis A (1.11 ± 0.18 μmol/g liver; 3 determinations/lobe). TLRs did not differ among the analyzed liver lobes in either case (Supplemental Figure 1; P ≥ 0.11). The CVs of the mean concentrations among the lobes were 12.7% (12 determinations across the liver) and 8.2% (8 determinations across the liver) for the normal and hypervitaminotic livers, respectively.
DISCUSSION
Cadaver liver samples were analyzed to explore VA status biomarker associations in US adults. Subjects showed a high prevalence of VAD (22%) and hypervitaminosis A (33%). The WHO often uses a 20% prevalence to define a severe public health concern (33). A cross-sectional study in US women evaluated long-term VA intake, calculated total body stores (141.5–3116 μmol) by RID, and determined that VA intake exceeded the Recommended Dietary Allowance, which correlated with estimated TLRs (16). The hypervitaminotic A concentrations discovered in these subjects would not have been identified by currently applied serum indicators. Although serum REs and liver VA were positively correlated, only 2 of 9 subjects with hypervitaminosis (≥1.0 μmol/g liver) had >5% total serum VA as REs [a value used in children (19) based on data in rhesus monkeys (20)], and none had REs >10% [the accepted value (1)]. The previous findings supporting >10% total serum VA as REs were based on the 95% percentiles for elderly subjects (13% REs) and young adults (11% REs); in that study, fasting serum REs were elevated with supplement usage (18).
A study in Zambian children found 59% hypervitaminotic TLRs ≥1.0 μmol/g through the use of RID, 16% with fasting total serum VA as REs >5%, and 2% with >10% (19). Thus, similar proportions of these cadavers (22%; 2 of 9 adults) and these children (27%; 19 of 71) had >5% total serum VA as REs among those diagnosed with hypervitaminosis by either liver sample or RID analyses, respectively. Considering the grossly abnormal histology in the 3 subjects with the highest TLR values, if VA toxicity was designated at >3 μmol/g liver, an exploratory cutoff of 7.5% total serum VA as REs (R Russell, Emeritus Tufts University, personal communication, 2017) resulted in sensitivity and specificity of 100%. Although only 2 subjects had this concentration and percentage REs and 1 subject with TLRs of 2.87 μmol/g and abnormal liver histology had <5% total serum VA as REs, 24 other subjects had congruent results (i.e., TLRs <3 μmol/g liver and serum REs <7.5% total serum VA as REs), which is an important finding. Elevated serum REs may be limited as a biomarker of toxicity and not hypervitaminosis A before clinical symptoms present. Nonetheless, rats administered α-retinol as a tracer had circulating serum α-REs when liver reserves were ∼2 μmol α-retinol/g liver but did not have abnormal liver histology (31). This suggests that serum REs may increase before the development of hepatic membrane–encased lipid droplets consistent with excessive TLRs (29). In these cadavers, we did not observe anyone between 1.33 and 2.87 μmol VA/g liver.
Serum retinol is suppressed during inflammation, which may explain the low mean value in these cadavers considering that AGP was elevated and mean CRP was >100 mg/L. Although traumatic death and infection can elevate postmortem CRP, it is not generally increased, even in cases of cirrhosis (34). Serum retinol concentrations were nonsignificantly lower in subjects with hypervitaminosis A than in those with optimal status, showing the nonsensitivity of this biomarker to high TLRs (1). This was shown with measured TLRs in Thai adults (23, 35) and by RID in children (15). Although limited by sample size, serum retinol to determine VAD in this cohort resulted in a high rate of false positives; 0.7 μmol/L had higher specificity than 1 μmol/L. Adjusting for inflammation decreased sensitivity at 0.7 μmol/L, indicating that this may be more important in studies in children (15, 26). In these adults, adjustment of the cutoff caused 2 cases to shift from being positive for VAD by both TLRs and serum retinol to being identified as not VAD by the inflammation-adjusted serum retinol cutoff (0.5 μmol/L), decreasing sensitivity. Both subjects had deficient TLRs (0.05 and 0.04 μmol/g) and serum retinol <0.7 μmol/L but >0.5 μmol/L. Poorer sensitivity after correction in these adults supports other research on retinol-binding protein in women of reproductive age (36). These findings should be confirmed in generally healthy individuals, perhaps via the RID test as the benchmark.
Many VA interventions are occurring in the same target groups. For example, in Zambian children, high-dose supplementation (37), sugar fortification with retinyl palmitate (38), and a diet high in provitamin A carotenoids (19) led to a high prevalence of hypervitaminosis A (39). This underscores the need for population monitoring in countries with multiple VA interventions (40). RID tests require expensive isotopes and sophisticated instrumentation, which have limited availability (1). Although UPLC is also not widely available, serum REs can be determined on standard HPLC systems (41, 42), which are likely available in all countries that want to evaluate the potential for hypervitaminosis A or toxic VA status among their population groups. Two livers were evaluated within and across lobes through the use of internal and external standardization and selective UPLC (CVs: 8–13%). Prior distribution in 13 human livers resulted in a CV of 63% (43). This high CV is likely due to overnight storage of samples in chloroform without adding antioxidant and no internal standardization to evaluate extraction efficiency with Carr-Price assays, which only rely on external standardization with retinyl acetate.
Further research into the positive correlation between age and liver α-retinol is needed in conjunction with measures of liver function. We speculated that older individuals with higher vegetable intake would have higher α-retinol based on a study in female Iowan centenarians that found serum α-carotene concentrations of >0.1 μmol/L (44). From NHANES III data, serum α-carotene of >0.09 μmol/L was proposed as a health indicator because disease risk increased below this cutoff (45). The influential outlier in the current study was aged 94 y. Long-term α-carotene intake results in higher liver α-REs. α-REs accumulated in pigs administered high doses (30) and in gerbils fed α-carotene (24), indicating preferential utilization of retinol for metabolic needs. Evaluating dietary patterns and serum carotenoids, especially among the elderly, could add to these data.
The results in these cadavers are unique and shed light on current TLRs in US adults and how total serum VA as REs relates to TLRs. Although our subjects were heterogeneous in age, weight, and morbidity, the results are not generalizable to all US adults and more research is needed among diverse groups. We had no information on fasting status, dietary intake, and supplement usage. Fasting status influences serum REs but decreases ≤6 h after consuming VA (1, 41, 46). It is well known that patients close to death experience anorexia, dysphagia, and confusion, all of which impair food intake (47). Food intake was likely diminished in most of the subjects close to death, which we confirmed with serum and liver carotenoids, although carotenoids may have been depressed because of the presence of disease or inflammation (48). Despite these potential influences on serum REs, no subjects showed highly elevated values.
A high variation in TLRs was discovered, ranging from severe VAD through hypervitaminosis A resulting in hepatic hypertrophy. Liver cirrhosis is associated with deficient VA stores and may even lead to xerophthalmia (49). Although the ramifications of overt VA toxicity are well documented and have been reviewed (3, 4), the negative health impacts of high liver reserves of >0.7–1 μmol/g and hypervitaminotic liver reserves ≥1 μmol/g are largely unknown (1). Serum REs, bone mineral density, and osteoporosis have been examined (42, 50). In postmenopausal women, the percentage total serum VA as REs was correlated with osteoporosis and approached significance (42). In our study, a positive association between serum REs and TLRs existed, but current cutoffs performed poorly at identifying subjects with hypervitaminosis A, with the exception of >7.5% defining TLRs of >3 μmol/g, which perhaps should be defined as toxicity considering abnormal liver histology at this concentration. Further examination of this association is needed with the use of RID to define the percentage total serum VA as REs that should be used in surveys (19). Serum retinol was neither associated with TLRs nor different between subjects with and without hypervitaminosis A, thus not identifying excess exposure risk.
With VA intakes above the Recommended Dietary Allowance (16), increased supplement and fortified-food use (7–11), and elevated TLRs in communities with >1 VA intervention (39), an increasing concern for hypervitaminosis A and VA toxicity exists. This study found a high prevalence of both deficient and hypervitaminotic TLRs in a group of US adults, with a trend toward higher TLRs with age. Further work is needed on minimally invasive VA biomarkers for hypervitaminosis A and on the potential risks of elevated TLRs in population groups exposed to multiple interventions.
Supplementary Material
ACKNOWLEDGEMENTS
The authors’ responsibilities were as follows—KO: analyzed samples and prepared the first draft of the manuscript for completion of the MS degree; DJS: conducted the statistical evaluations and revised the manuscript; CD, KH, and YT: coordinated the transfer of samples between laboratories; KN and YT: reviewed and curated the clinical data available; KN and YY: performed liver histology and microscopy; NVW: evaluated all histologic sections and consulted with the pathologist; CD and JS: analyzed samples for carotenoids and estimated total body stores; SAT: revised the manuscript; NVW and SAT: conceived of and designed the study; and all authors: read and approved the final manuscript. None of the authors reported a conflict of interest related to the study.
Notes
Supported by NIH grants R01 DC004428 (to NVW) and T32 DC009401 (to KO), both from the National Institute on Deafness and Other Communication Disorders, and Global Health Funds at the University of Wisconsin–Madison.
Supplemental Figure 1 is available from the “Supplementary data” link in the online posting of the article and from the same link in the online table of contents at https://academic.oup.com/ajcn/.
Abbreviations used: AGP, α1-acid glycoprotein; CRP, C-reactive protein; RE, retinyl ester; RID, retinol isotope dilution; TLR, total liver vitamin A reserve; UPLC, ultra-pressure liquid chromatograph; VA, vitamin A; VAD, vitamin A deficiency.
REFERENCES
- 1. Tanumihardjo SA, Russell RM, Stephensen CB, Gannon BM, Craft NE, Haskell MJ, Lietz G, Schulze K, Raiten DJ. Biomarkers of Nutrition for Development (BOND)—vitamin A review. J Nutr. 2016;146:1816S–48S. [DOI] [PMC free article] [PubMed] [Google Scholar]
- 2. WHO. Global prevalence of vitamin A deficiency in populations at risk 1995–2005. World Health Organization global database on vitamin A deficiency. Geneva (Switzerland): World Health Organization; 2009. [Google Scholar]
- 3. Penniston KL, Tanumihardjo SA. The acute and chronic toxic effects of vitamin A. Am J Clin Nutr. 2006;83:191–201. [DOI] [PubMed] [Google Scholar]
- 4. Hathcock JN, Hattan DG, Jenkins MY, McDonald JT, Sundaresan PR, Wilkening VL. Evaluation of vitamin A toxicity. Am J Clin Nutr. 1990;52:183–202. [DOI] [PubMed] [Google Scholar]
- 5. Dietary Guidelines Advisory Committee. Scientific report of the 2015 Dietary Guidelines Advisory Committee. 2015[cited 2017 Feb 6]. Available from: https://health.gov/dietaryguidelines/2015-BINDER/meeting2/docs/refMaterials/Usual_Intake_072013.pdf. [Google Scholar]
- 6. Duitsman PK, Cook LR, Tanumihardjo SA, Olson JA. Vitamin A inadequacy in socioeconomically disadvantaged pregnant Iowan women as assessed by the modified relative dose response (MRDR) test. Nutr Res. 1995;15:1263–76. [Google Scholar]
- 7. Newcomer C, Murphy S. Guideline for vitamin A & D fortification of fluid milk. Bulletin 53 Keyport (NJ): The Dairy Practices Council; 2001. [Google Scholar]
- 8. Penniston K, Tanumihardjo SA. Vitamin A in dietary supplements and fortified foods: too much of a good thing?. J Am Diet Assoc. 2003;103:1185–7. [DOI] [PubMed] [Google Scholar]
- 9. Bailey RL, Gahche JJ, Lentino CV, Dwyer JT, Engel JS, Thomas PR, Betz JM, Sempos CT, Picciano MF. Dietary supplement use in the United States, 2003–2006. J Nutr. 2011;141:261–6. [DOI] [PMC free article] [PubMed] [Google Scholar]
- 10. Radimer K, Bindewald B, Hughes J, Ervin B, Swanson C, Picciano MF. Dietary supplement use by US adults: data from the National Health and Nutrition Examination Survey, 1999–2000. Am J Epidemiol. 2004;160:339–49. [DOI] [PubMed] [Google Scholar]
- 11. Gahche J, Bailey R, Burt V, Hughes J, Yetley E, Dwyer JT, Picciano MF, McDowell M, Sempos C. Dietary supplement use among US adults has increased since NHANES III (1988–1994). NCHS Data Brief. 2011;61:1–8. [PubMed] [Google Scholar]
- 12. Tanumihardjo SA. Vitamin A and bone health: the balancing act. J Clin Densitom. 2013;16:414–19. [DOI] [PubMed] [Google Scholar]
- 13. World Health Organization. Serum retinol concentrations for determining the prevalence of vitamin A deficiency in populations. [cited 2017 Feb 6]. Geneva (Switzerland): World Health Organization; 2011. Available from: http://www.who.int/vmnis/indicators/retinol.pdf. [Google Scholar]
- 14. Thurnham DI, McCabe GP, Northrop-Clewes CA, Nestel P. Effects of subclinical infection on plasma retinol concentrations and assessment of prevalence of vitamin A deficiency: meta-analysis. Lancet. 2003;362:2052–8. [DOI] [PubMed] [Google Scholar]
- 15. Suri DJ, Tanumihardjo JP, Gannon BM, Pinkaew S, Kaliwile C, Chileshe J, Tanumihardjo SA. Serum retinol concentrations demonstrate high specificity after correcting for infection but questionable sensitivity compared with liver stores calculated from isotope dilution in determining vitamin A deficiency in Thai and Zambian children. Am J Clin Nutr. 2015;102:1259–65. [DOI] [PMC free article] [PubMed] [Google Scholar]
- 16. Valentine AR, Davis CR, Tanumihardjo SA. Vitamin A isotope dilution predicts liver stores in line with long-term vitamin A intake above the current Recommended Dietary Allowance for young adult women. Am J Clin Nutr. 2013;98:1192–9. [DOI] [PMC free article] [PubMed] [Google Scholar]
- 17. Smith FR, Goodman DS. Vitamin A transport in human vitamin A toxicity. N Engl J Med. 1976;294:805–8. [DOI] [PubMed] [Google Scholar]
- 18. Krasinski SD, Russell RM, Otradovec C, Sadowski J, Hartz S, Jacob R, McGandy R. Relationship of vitamin A and vitamin E intake to fasting plasma retinol, retinol-binding protein, retinyl esters, carotene, alpha-tocopherol, and cholesterol among elderly people and young adults: increased plasma retinyl esters among vitamin A-supplement users. Am J Clin Nutr. 1989;49:112–20. [DOI] [PubMed] [Google Scholar]
- 19. Mondloch S, Gannon BM, Davis CR, Chileshe J, Kaliwile C, Masi C, Rios-Avila L, Gregory JF III, Tanumihardjo SA. High provitamin A carotenoid serum concentrations, elevated retinyl esters, and saturated retinol-binding protein in Zambian preschool children are consistent with the presence of high liver vitamin A stores. Am J Clin Nutr. 2015;102:497–504. [DOI] [PMC free article] [PubMed] [Google Scholar]
- 20. Penniston KL, Thayer JC, Tanumihardjo SA. Serum vitamin A esters are high in captive rhesus (Macaca mulatta) and marmoset (Callithrix jacchus) monkeys. J Nutr. 2003;133: 4202–6. [DOI] [PubMed] [Google Scholar]
- 21. Penniston KL, Tanumihardjo SA. Subtoxic hepatic vitamin A concentrations in captive Rhesus monkeys (Macaca mulatta). J Nutr. 2001;131:2904–9. [DOI] [PubMed] [Google Scholar]
- 22. Drammeh BS, Schleicher RL, Pfeiffer CM, Jain RB, Zhang M, Nguyen PH. Effects of delayed sample processing and freezing on serum concentrations of selected nutritional indicators. Clin Chem. 2008;54:1833–91. [DOI] [PubMed] [Google Scholar]
- 23. Suthutvoravoot S, Olson JA. Plasma and liver concentrations of vitamin A in a normal population of urban Thai. Am J Clin Nutr. 1974;27:883–91. [DOI] [PubMed] [Google Scholar]
- 24. Tanumihardjo SA, Howe JA. Twice the amount of α-carotene isolated from carrots is as effective as β-carotene in maintaining the vitamin A status of Mongolian gerbils. J Nutr. 2005;135:2622–6. [DOI] [PubMed] [Google Scholar]
- 25. Davis C, Jing H, Howe JA, Rocheford T, Tanumihardjo SA. β-Cryptoxanthin from supplements or carotenoid-enhanced maize maintains liver vitamin A in Mongolian gerbils (Meriones unguiculatus) better than or equal to β-carotene supplements. Br J Nutr. 2008;100:786–93. [DOI] [PubMed] [Google Scholar]
- 26. Thurnham DI, McCabe GP. Influence of infection and inflammation on biomarkers of nutritional status with an emphasis on vitamin A and iron. In: World Health Organization report: priorities in the assessment of vitamin A and iron status in populations, Panama City, Panama, 15–17 September 2010. Geneva (Switzerland): World Health Organization; 2012. p. 63–80. [Google Scholar]
- 27. Ross AC, Zolfaghari R. Regulation of hepatic retinol metabolism: perspectives from studies on vitamin A status. J Nutr. 2004;134:269S–75S. [DOI] [PubMed] [Google Scholar]
- 28. Yoshizumi T, Gondolesi GE, Bodian CA, Jeon H, Schwartz ME, Fishbein TM, Miller CM, Emre S. A simple new formula to assess liver weight. Transplant Proc. 2003;35:1415–20. [DOI] [PubMed] [Google Scholar]
- 29. Wake K. Development of vitamin A-rich lipid droplets in multivesicular bodies of rat liver stellate cells. J Cell Biol. 1974;63:683–91. [DOI] [PMC free article] [PubMed] [Google Scholar]
- 30. Riabroy N, Tanumihardjo SA. Oral doses of α-retinyl ester track chylomicron uptake and distribution of vitamin A in a male piglet model for newborn infants. J Nutr. 2014;144:1188–95. [DOI] [PubMed] [Google Scholar]
- 31. Riabroy N, Dever J, Tanumihardjo SA. α-Retinol and 3,4-didehydroretinol support growth in rats when fed at equimolar amounts and α-retinol is not toxic after repeated administration of large doses. Br J Nutr. 2014;111:1373–81. [DOI] [PMC free article] [PubMed] [Google Scholar]
- 32. Muhilal H, Glover J. The affinity of retinol and its analogues for retinol-binding protein. Biochem Soc Trans. 1975;3;744–6. [DOI] [PubMed] [Google Scholar]
- 33. WHO. Indicators for assessing vitamin A deficiency and their application in monitoring and evaluating intervention programmes. WHO/NUT/96.10 Geneva, Switzerland: World Health Organization; 1996. [Google Scholar]
- 34. Fujita MQ, Zhu B-L, Ishida K, Quan L, Oritani S, Maeda H. Serum C-reactive protein levels in postmortem blood—an analysis with special reference to the cause of death and survival time. Forensic Sci Int. 2002;130:160–6. [DOI] [PubMed] [Google Scholar]
- 35. Olson JA. Serum levels of vitamin A and carotenoids as reflectors of nutritional status. J Natl Cancer Inst. 1984;73:1439–44. [PubMed] [Google Scholar]
- 36. Larson LM, Namaste SM, Williams AM, Engle-Stone R, Addo OY, Suchdev PS, Wirth JP, Temple V, Serdula M, Northrop-Clewes CA. Adjusting retinol-binding protein concentrations for inflammation: Biomarkers Reflecting Inflammation and Nutritional Determinants of Anemia (BRINDA) project. Am J Clin Nutr. 2017;106(Suppl 1):390S–401S. [DOI] [PMC free article] [PubMed] [Google Scholar]
- 37. WHO. Guideline: vitamin A supplementation in infants and children 6–59 months of age. Geneva (Switzerland): World Health Organization; 2011. [PubMed] [Google Scholar]
- 38. Dary O, Mora JO. Food fortification to reduce vitamin A deficiency: International Vitamin A Consultative Group recommendations. J Nutr. 2002;132:2927S–33S. [DOI] [PubMed] [Google Scholar]
- 39. Gannon B, Kaliwile C, Arscott SA, Schmaelzle S, Chileshe J, Kalungwana N, Mosonda M, Pixley K, Masi C, Tanumihardjo SA. Biofortified orange maize is as efficacious as a vitamin A supplement in Zambian children even on the background of high liver reserves of vitamin A: a community-based, randomized placebo-controlled trial. Am J Clin Nutr. 2014;100:1541–50. [DOI] [PMC free article] [PubMed] [Google Scholar]
- 40. Tanumihardjo SA. Vitamin A fortification efforts require accurate monitoring of population vitamin A status to prevent excessive intakes. Procedia Chem. 2015;14:398–407. [Google Scholar]
- 41. Penniston KL, Tanumihardjo SA. Elevated serum concentrations of β-glucuronide metabolites and 4-oxoretinol in lactating sows after treatment with vitamin A: a model for evaluating supplementation in lactating women. Am J Clin Nutr. 2005;81:851–8. [DOI] [PubMed] [Google Scholar]
- 42. Penniston KL, Weng N, Binkley N, Tanumihardjo SA. Serum retinyl esters are not elevated in postmenopausal women with and without osteoporosis whose preformed vitamin A intakes are high. Am J Clin Nutr. 2006;84:1350–6. [DOI] [PubMed] [Google Scholar]
- 43. Olson JA, Gunning D, Tilton R. The distribution of vitamin A in human liver. Am J Clin Nutr. 1979;32:2500–7. [DOI] [PubMed] [Google Scholar]
- 44. Tanumihardjo SA, Furr HC, Stewart JW, Oakland MJ, Garcia PA. Plasma concentrations of retinol, tocopherols, and carotenoids and platelet fatty acids in a group of female Iowa centenarians. J Aging Res Clin Pr. 2012;1:23–8. [Google Scholar]
- 45. Li C, Ford ES, Zhao G, Balluz LS, Giles WH, Liu S. Serum α-carotene concentrations and risk of death among US adults: the Third National Health and Nutrition Examination Survey follow-up study. Arch Intern Med. 2011;171:507–15. [DOI] [PubMed] [Google Scholar]
- 46. Ross AC. Vitamin A. In: Coates PM, Betz JM, Blackman MR, Cragg GM, Levine M, Moss J, White JD, Encyclopedia of dietary supplements. 2nd ed London and New York: Informa Healthcare; 2010. p. 778–91. [Google Scholar]
- 47. Hui D, Dev R, Bruera E. The last days of life: symptom burden and impact on nutrition and hydration in cancer patients. Curr Opin Support Palliat Care. 2015;9:346–54. [DOI] [PMC free article] [PubMed] [Google Scholar]
- 48. Rubin LP, Ross AC, Stephensen CB, Bohn T, Tanumihardjo SA. Metabolic effects of inflammation on vitamin A and carotenoids in humans and animal models. Adv Nutr. 2017;8:197–212. [DOI] [PMC free article] [PubMed] [Google Scholar]
- 49. Chow CC, Mieler WF. Vitamin A deficiency and xerophthalmic fundus in autoimmune hepatitis and cirrhosis. Retin Cases Br Rep. 2014;8:164–6. [DOI] [PubMed] [Google Scholar]
- 50. Ballew C, Galuska D, Gillespie C. High serum retinyl esters are not associated with reduced bone mineral density in the Third National Health and Nutrition Examination Survey, 1988–1994. J Bone Miner Res. 2001;16:2306–12. [DOI] [PubMed] [Google Scholar]
Associated Data
This section collects any data citations, data availability statements, or supplementary materials included in this article.