

Key words: Familial hypercholesterolaemia, Fat quality, Gene expression, LDL receptor, Postprandial responses
Abbreviations: CT, cycle threshold; FH, familial hypercholesterolaemia; LDL-C, LDL-cholesterol; LDLR, LDL receptor; PBMC, peripheral blood mononuclear cells; SREBP, sterol regulatory element binding protein
The long-term cholesterol-lowering effect of replacing intake of SFA with PUFA is well established, but has not been fully explained mechanistically. We examined the postprandial response of meals with different fat quality on expression of lipid genes in peripheral blood mononuclear cells (PBMC) in subjects with and without familial hypercholesterolaemia (FH). Thirteen subjects with FH (who had discontinued lipid-lowering treatment ≥4 weeks prior to both test days) and fourteen normolipidaemic controls were included in a randomised controlled double-blind crossover study with two meals, each with 60 g of fat either mainly SFA (about 40% energy) or n-6 PUFA (about 40% energy). PBMC were isolated in fasting, and 4 and 6 h postprandial blood samples. Expression of thirty-three lipid genes was analysed by reverse transcription quantitative PCR. A linear mixed model was used to assess postprandial effects between meals and groups. There was a significant interaction between meal and group for MSR1 (P = 0·03), where intake of SFA compared with n-6 PUFA induced a larger reduction in gene expression in controls only (P = 0·01). Intake of SFA compared with n-6 PUFA induced larger reductions in gene expression levels of LDLR and FADS1/2, smaller increases of INSIG1 and FASN, and larger increases of ABCA1 and ABCG1 (P = 0·01 for all, no group interaction). Intake of SFA compared with n-6 PUFA induced changes in gene expression of cholesterol influx and efflux mediators in PBMC including lower LDLR and higher ABCA1/G1, potentially explaining the long-term cholesterol-raising effect of a high SFA intake.
Elevated total cholesterol and LDL-cholesterol (LDL-C) concentrations are established risk factors for CVD(1). In a meta-analysis of sixty controlled trials, Mensink et al.(2) showed a significant decrease in serum LDL-C when SFA were replaced with unsaturated fatty acids. We previously showed that by exchanging only a few regularly consumed food items with less SFA and more PUFA for 8 weeks, serum total cholesterol and LDL-C significantly decreased in hypercholesterolaemic subjects(3). For every energy percentage of SFA that is replaced with PUFA, a 2–3 % risk reduction is seen in CHD(4), providing strong evidence for the role of fat quality in CVD development(5,6).
Patients with familial hypercholesterolaemia (FH) are characterised by genetically elevated cholesterol levels, mainly due to a mutation in the gene coding for the LDL receptor (LDLR)(7). Thus, these patients have increased CVD mortality(8). It has also been suggested that subjects with FH may have an altered metabolism of TAG-rich lipoproteins(9,10). We recently showed that the postprandial TAG response did not differ between young FH subjects and healthy controls after intake of high-fat meals rich in SFA or PUFA. However, the TAG peaked later after intake of SFA compared with PUFA(11).
Peripheral blood mononuclear cells (PBMC) are circulating cells playing an important role in CVD development and are exposed to environmental factors such as dietary components(12). Studies have shown that PBMC reflect hepatic regulation of cholesterol metabolism(13–15). Thus, since tissue availability in human studies is very limited, PBMC may serve as a model system to investigate cholesterol metabolism.
The exact mechanisms behind the LDL-C-lowering effect of replacing SFA with PUFA are not fully explained, but may potentially be through regulation of the LDLR(16). This should be further clarified in humans to strengthen the evidence for current dietary recommendations. If SFA induce a cholesterol-increasing effect through modulation of the LDLR, it may be hypothesised that intake of SFA may be particularly unfavourable for patients with FH and LDLR deficiency(17). The aim of the present study was to explore the expression of lipid-related genes in PBMC after a single meal with high SFA v. high n-6 PUFA content in subjects with and without FH.
Subjects and methods
Subjects
The subjects and study design including inclusion and exclusion criteria have been described in detail previously(11). Briefly, in this randomised controlled double-blind crossover study we included two groups, one with genetically verified heterozygous FH subjects and one with normolipidaemic controls, both aged 18–30 years. The subjects were included if they had BMI 18·5–30·0 kg/m2, C-reactive protein levels ≤10 mg/l, TAG ≤4 mmol/l and no metabolic co-morbidities. An additional inclusion criterion for the FH subjects was the presence of a FH mutation in the gene encoding the LDLR. All FH subjects were treated with lipid-lowering medications, but discontinued the treatment during the last 4 weeks prior to the first test day and during the whole period between the first and second test day.
Study design
The FH subjects and normolipidaemic controls ingested two meals with different fat quality in a randomised order with a wash-out period of 3–5 weeks between the meals. The two meals (150 g) were high in fat (60 g; 70 % energy) and with either mainly SFA (about 40 % energy) or n-6 PUFA (about 40 % energy), and were blinded to the participants and care providers. The two meals contained the same amount of energy, MUFA, carbohydrates and proteins. Fat originated from palm oil and coconut oil in the SFA meal, and from sunflower-seed oil and rapeseed oil in the n-6 PUFA meal. The fatty acid composition of the meals is illustrated in Fig. 1. Venous blood samples were taken after 12 h of fasting (baseline, 0 h) and 4 and 6 h after meal consumption. The study visits were performed at the University of Oslo, Norway between March and May 2016. This study was conducted according to the guidelines laid down in the Declaration of Helsinki and all procedures involving human subjects were approved by the Regional Committees for Medical and Health Research Ethics (REK 2015/2392/REK sør-øst B). Written informed consent was obtained from all subjects. The study was registered at http://www.ClinicalTrials.gov (registration no. NCT02729857). The main results from the study have been published previously(11). This paper presents pre-specified secondary outcomes from the study.
Fig. 1.

Fatty acid composition of the test meals.  , SFA meal;
  , PUFA meal.
Routine measures
Serum was collected from silica gel tubes (Becton Dickenson Vacutainer Systems) and stored at room temperature for 30–60 min until centrifugation (1500 g; 15 min). Whole blood samples in EDTA tubes (Becton Dickenson Vacutainer Systems) were kept at room temperature until analysed. Standard blood chemistry was measured in serum and whole blood using routine laboratory methods at an accredited medical laboratory (Fürst Medical Laboratory).
Gene expression analysis in peripheral blood mononuclear cells
PBMC were isolated from blood using BD Vacutainer Cell Preparation tubes with sodium heparin according to the manufacturer (Becton Dickinson) and stored as pellets at −80°C until further RNA isolation. Total RNA was isolated using an RNeasy mini kit (Qiagen), and treated with DNase I (Qiagen) according to the manufacturer's instructions and stored at −80°C. The quantity and quality of RNA were measured using an ND 1000 Spectrophotometer (Saveen Werner Carlson Circle) and an Agilent Bioanalyser (Agilent Technology), respectively. A high-capacity RNA-to-cDNA kit (catalogue no. 4387406; Applied Biosystems) was used to reverse transcribe 500 ng of RNA from all samples. Quantitative real-time PCR was performed on an ABI PRISM 7900HT Sequence Detector System (Applied Biosystems) using custom TaqMan array cards (Life Technologies). Acyl-CoA synthetase long-chain family member (ACSL) 3 and ACSL4 were chosen as reference genes based on the lowest between-sample variation as recommended by the manufacturer's protocol. For this purpose and to calculate the relative mRNA expression level for each transcript, the software ExpressionSuite v1.1 (ThermoFisher Scientific) was used. Further, the ΔΔ cycle threshold (CT) method(18) was used. Briefly, the CT values of each target gene were normalised to the CT values of the two reference genes (=ΔCT). ΔΔCT was then calculated as ΔCT, 4 or 6 h minus ΔCT, baseline (0 h). The fold change in mRNA expression was calculated as  .
.
An overview of the lipid-related genes, respective metabolic pathway and assay identification number of the inventoried TaqMan probe and primer sets used is provided in Table 1.
Table 1.
Overview of the lipid-related genes examined by quantitative real-time PCR
| Gene symbol | Full name | Function | ThermoFisher Scientific's assay no. |
|---|---|---|---|
| ACAT1 | Acetyl-CoA acetyltransferase 1 | Cholesterol biosynthesis | Hs01011096_m1 |
| DHCR24 | 24-Dehydrocholesterol reductase | Cholesterol biosynthesis | Hs00207388_m1 |
| DHCR7 | 7-Dehydrocholesterol reductase | Cholesterol biosynthesis | Hs01023087_m1 |
| FDFT1 | Squalene synthase | Cholesterol biosynthesis | Hs00926054_m1 |
| FDPS | Farnesyl diphosphate synthase | Cholesterol biosynthesis | Hs01578769_g1 |
| HMGCR | 3-Hydroxy-3methylglutaryl-CoA reductase | Cholesterol biosynthesis | Hs00168352_m1 |
| HMGCS1 | 3-Hydroxy-3-methylglutaryl-CoA synthase 1 | Cholesterol biosynthesis | Hs00940429_m1 |
| INSIG1 | Insulin-induced gene 1 | Cholesterol biosynthesis | Hs01650979_m1 |
| LSS | Lanosterol synthase | Cholesterol biosynthesis | Hs01552331_m1 |
| SCAP | Sterol regulatory element binding cleavage activating protein | Cholesterol biosynthesis | Hs00378725_m1 |
| CPT1A | Carnitine palmitoyltransferase 1A | Fatty acid metabolism: β-oxidation | Hs00912671_m1 |
| CPT2 | Carnitine palmitoyltransferase 2 | Fatty acid metabolism: β-oxidation | Hs04188816_m1 |
| ECI1 | Enoyl-CoA delta isomerase 1 | Fatty acid metabolism: β-oxidation | Hs00157239_m1 |
| SLC25A20 | Solute carrier family 25 member 20 | Fatty acid metabolism: β-oxidation | Hs00386383_m1 |
| ACSL1 | Acyl-CoA synthetase long-chain family member 1 | Fatty acid metabolism: intracellular transport | Hs00960561_m1 |
| FADS1 | Fatty acid desaturase 1 | Fatty acid metabolism: long-chain PUFA pathway | Hs00203685_m1 |
| FADS2 | Fatty acid desaturase 2 | Fatty acid metabolism: long-chain PUFA pathway | Hs00927433_m1 |
| ACACA | Acetyl-CoA carboxylase α | Fatty acid metabolism: synthesis | Hs01046047_m1 |
| FASN | Fatty acid synthase | Fatty acid metabolism: synthesis | Hs01005622_m1 |
| SCD | Stearoyl-CoA desaturase | Fatty acid metabolism: synthesis | Hs01682761_m1 |
| SORL1 | Sortilin related receptor 1 | Lipoprotein metabolism | Hs00268342_m1 |
| LDLR | LDL receptor | Lipoprotein metabolism | Hs01092524_m1 |
| MYLIP | Myosin regulatory light chain interacting protein | Lipoprotein metabolism | Hs00203131_m1 |
| SORT1 | Sortilin-1 | Lipoprotein metabolism | Hs00361760_m1 |
| VLDLR | Very low-density lipoprotein receptor | Lipoprotein metabolism | Hs01045922_m1 |
| ABCA1 | ATP-binding cassette, sub family A, member 1 | Reverse cholesterol transport | Hs01059118_m1 |
| ABCG1 | ATP-binding cassette, sub family G, member 1 | Reverse cholesterol transport | Hs00245154_m1 |
| SCARB1 | Scavenger receptor class B member 1 | Reverse cholesterol transport | Hs00969821_m1 |
| CD36 | CD 36 molecule | Scavenger receptor | Hs00169627_m1 |
| MSR1 | Macrophage scavenger receptor 1 | Scavenger receptor | Hs00234007_m1 |
| NR1H3 | Nuclear receptor subfamily 1 group H member 3 | Transcription factor targeting lipid genes | Hs00172885_m1 |
| SREBF1 | Sterol regulatory element binding transcription factor 1 | Transcription factor targeting lipid genes | Hs01088691_m1 |
| SREBF2 | Sterol regulatory element binding transcription factor 2 | Transcription factor targeting lipid genes | Hs01081778_m1 |
Statistics
Subject characteristics are presented as medians and 25th–75th percentiles, or as frequencies and percentages. The Mann−Whitney test and χ2 test were used to compare subject characteristics and baseline (0 h) gene expression levels ( ) between FH and control subjects. We performed a linear mixed-model analysis on the changes from baseline (0 h) to 4 and 6 h (
 for time 4 and 6 h, respectively). Meal (i.e. change after the SFA v. PUFA meal), group (i.e. change in FH v. control subjects), time (i.e. change at 4 h v. 6 h from 0 h) and period (order of the meals) were included in the model. We tested for the following two-way interactions between the variables, one at a time: time–meal (i.e. difference in change from 4 to 6 h between the SFA and the PUFA meal), time–group (i.e. difference in change from 4 to 6 h in FH v. control subjects) and meal–group (i.e. difference in change from 0 h after the SFA and PUFA meal between FH and control subjects). Non-significant period or interaction effects were not included in the final models. Data were stratified by group and meal when there was a significant interaction effect. Normality, outliers and systematic trends of the residuals were examined in histograms and Q−Q plots to assess the adequacy of the fitted models. The maximum number of observations (indicated by n in the tables) included in the analysis was 108 (27 subjects × 2 meals × 2 times (4 and 6 h)). The postprandial effects are presented as means and standard errors of
  values. The Benjamini−Hochberg procedure (false discovery rate correction) was used to correct for the number of genes tested (n 33) for all variables in the linear mixed-model analysis, and Benjamini−Hochberg adjusted P values are presented. For genes that were differentially expressed between the meals, Spearman's rank-correlation coefficient (r) was estimated for change in gene expression and circulating lipids from 0 to 4 h with both groups combined. P values <0·05 were considered significant. Statistical analyses were conducted with SPSS version 24.0 and Benjamini−Hochberg adjustment was performed in Excel.
Results
Subject characteristics
Characteristics of the thirteen subjects with FH and the fourteen control subjects are presented in Table 2. There was no significant difference in age, sex and BMI between the groups(11). Subjects with FH had significantly higher total cholesterol and LDL-C levels compared with controls(11). There was no significant difference in the postprandial response (incremental AUC) of TAG, total cholesterol or LDL-C between meals or groups as previously shown(11). At baseline (0 h), FH compared with control subjects had significantly lower expression of genes involved in fatty acid metabolism (ACACA, CPT1A and FADS1), cholesterol biosynthesis (FDPS), the gene coding for the scavenger receptor MSR1 and genes involved in the transcription of lipid genes (NR1H3 and SREBF2) (0·001 ≤ P ≤ 0·02) (Supplementary Table S1). There was no significant difference in the postprandial response of percentage distribution of plasma total SFA, MUFA, n-6 PUFA and n-3 PUFA between meals or groups (0·10 ≤ P ≤ 0·76; data not shown).
Table 2.
Subject characteristics
(Medians and 25th–75th percentiles; percentages)
| FH (n 13) | Controls (n 14) | ||||||||
|---|---|---|---|---|---|---|---|---|---|
| SFA meal | PUFA meal | SFA meal | PUFA meal | ||||||
| Median | 25th–75th percentiles | Median | 25th–75th percentiles | Median | 25th–75th percentiles | Median | 25th–75th percentiles | P* | |
| Age (years) | 0·76 | ||||||||
| Median | 25·0 | 24·5 | |||||||
| 25th–75th percentiles | 21·0–28·5 | 23·0–28·0 | |||||||
| Female (%) | 61·5 | 64·3 | 1·0 | ||||||
| BMI (kg/m2) | 0·24 | ||||||||
| Median | 22·9 | 22·1 | |||||||
| 25th–75th percentiles | 21·5–25·3 | 20·5–23·8 | |||||||
| TAG (mmol/l) | 1·3 | 0·8–1·7 | 0·9 | 0·7–1·3 | 0·8 | 0·7–1·0 | 0·8 | 0·6–1·2 | 0·08 |
| Total cholesterol (mmol/l) | 7·2 | 6·5–8·7 | 7·9 | 6·5–9·0 | 4·1 | 3·9–4·4 | 4·1 | 3·6–4·5 | <0·001 |
| LDL-cholesterol (mmol/l) | 5·7 | 5·3–7·4 | 6·3 | 5·4–7·5 | 2·4 | 1·8–2·9 | 2·3 | 1·8–2·8 | <0·001 |
| Neutrophils (%) | 44 | 41–55 | 49 | 41–56 | 47 | 43–52 | 47 | 43–58 | 0·98 |
| Lymphocytes (%) | 40 | 34–46 | 37 | 33–43 | 40 | 35–43 | 38 | 27–44 | 0·87 |
| Monocytes (%) | 9 | 7–11 | 10 | 8–12 | 10 | 8–12 | 9 | 7–11 | 0·46 |
| Eosinophils (%) | 2 | 2–3 | 3 | 2–5 | 3 | 2–6 | 2 | 2–5 | 0·62 |
| Basophils (%) | 0 | 0–1 | 2 | 0–2 | 0 | 0–2 | 0 | 0–2 | 0·26 |
FH, familial hypercholesterolaemia.
* P values for group differences (mean of the two visits) from the Mann−Whitney test or χ2 test.
Postprandial responses in peripheral blood mononuclear cell gene expression levels
We found no significant effect of period (order of the meals; 0·10 ≤ P ≤ 0·95) and no significant interaction between time and meal (0·73 ≤ P ≤ 0·92) and between time and group (0·98 ≤ P ≤ 0·99), thus these are not included in the final model. There were no significant interactions between meal and group (0·19 ≤ P ≤ 0·95), except for the scavenger receptor MSR1 (P = 0·03), where intake of SFA compared with n-6 PUFA induced a larger reduction in gene expression in controls only (P = 0·01, Table 3). Significant differences between meals were found for seven out of thirty-three genes, independent of group. Intake of SFA compared with n-6 PUFA induced larger reductions in expression levels of LDLR (Table 3) and genes involved in fatty acid desaturation (FADS1, FADS2; Table 3), and smaller increases in expression levels of genes involved in cholesterol biosynthesis (INSIG1; Table 3) and fatty acid synthesis (FASN; Table 3) (P = 0·01 for all). Moreover, intake of SFA compared with n-6 PUFA induced larger increases in expression levels of genes involved in reverse cholesterol transport (ABCA1, ABCG1; P = 0·01 for both; Table 3).
Table 3.
Postprandial changes in gene expression in peripheral blood mononuclear cells that were significantly different between meals or groups*
(Mean values with their standard errors)
| SFA | PUFA | ||||||||||
|---|---|---|---|---|---|---|---|---|---|---|---|
| 4 h (2−ΔΔCT) | 6 h (2−ΔΔCT) | 4 h (2−ΔΔCT) | 6 h (2−ΔΔCT) | ||||||||
| Target gene | n | Mean | se | Mean | se | Mean | se | Mean | se | Pmeal | Pgroup |
| ABCA1 | 98 | 0·01† | 0·44 | ||||||||
| FH | 1·75 | 0·18 | 1·62 | 0·19 | 1·45 | 0·16 | 1·29 | 0·13 | |||
| C | 1·57 | 0·13 | 1·29 | 0·08 | 1·20 | 0·09 | 1·25 | 0·17 | |||
| ABCG1 | 98 | 0·01† | 0·73 | ||||||||
| FH | 1·47 | 0·13 | 1·42 | 0·14 | 1·27 | 0·04 | 1·22 | 0·11 | |||
| C | 1·57 | 0·14 | 1·37 | 0·11 | 1·30 | 0·13 | 0·92 | 0·10 | |||
| CPT1A | 95 | 0·42 | 0·01§ | ||||||||
| FH | 1·32 | 0·15 | 2·11 | 0·25 | 1·24 | 0·09 | 1·67 | 0·11 | |||
| C | 0·89 | 0·12 | 1·32 | 0·10 | 1·03 | 0·08 | 1·30 | 0·07 | |||
| FADS1 | 104 | 0·01‡ | 0·12 | ||||||||
| FH | 0·93 | 0·05 | 0·90 | 0·06 | 1·01 | 0·10 | 1·02 | 0·09 | |||
| C | 0·71 | 0·04 | 0·70 | 0·04 | 1·02 | 0·10 | 0·89 | 0·07 | |||
| FADS2 | 104 | 0·01‡ | 0·01§ | ||||||||
| FH | 1·06 | 0·08 | 1·13 | 0·11 | 1·30 | 0·13 | 1·13 | 0·08 | |||
| C | 0·72 | 0·08 | 0·80 | 0·07 | 1·03 | 0·10 | 1·00 | 0·07 | |||
| FASN | 96 | 0·01‡ | 0·15 | ||||||||
| FH | 1·13 | 0·10 | 1·26 | 0·14 | 1·34 | 0·11 | 1·30 | 0·09 | |||
| C | 0·95 | 0·06 | 1·07 | 0·06 | 1·16 | 0·09 | 1·17 | 0·06 | |||
| HMGCS1 | 100 | 0·23 | 0·01§ | ||||||||
| FH | 1·30 | 0·10 | 1·14 | 0·10 | 1·14 | 0·08 | 1·20 | 0·12 | |||
| C | 0·81 | 0·03 | 0·81 | 0·07 | 1·09 | 0·09 | 0·97 | 0·05 | |||
| INSIG1 | 94 | 0·01‡ | 0·55 | ||||||||
| FH | 1·19 | 0·06 | 1·01 | 0·07 | 1·26 | 0·11 | 1·26 | 0·11 | |||
| C | 1·11 | 0·08 | 0·96 | 0·07 | 1·15 | 0·07 | 1·13 | 0·07 | |||
| LDLR | 95 | 0·01‡ | 0·44 | ||||||||
| FH | 0·78 | 0·05 | 0·84 | 0·11 | 0·99 | 0·08 | 0·89 | 0·06 | |||
| C | 0·76 | 0·07 | 0·74 | 0·08 | 1·21 | 0·09 | 1·05 | 0·08 | |||
| MSR1 | 104 | C 0·01‡, FH 0·26 | SFA 0·15, PUFA 0·37 | ||||||||
| FH | 1·06 | 0·11 | 1·03 | 0·10 | 0·90 | 0·07 | 0·85 | 0·06 | |||
| C | 0·81 | 0·04 | 0·87 | 0·06 | 1·09 | 0·10 | 1·07 | 0·10 | |||
| SREBF2 | 98 | 0·22 | 0·02§ | ||||||||
| FH | 1·10 | 0·11 | 1·03 | 0·11 | 1·06 | 0·08 | 1·10 | 0·09 | |||
| C | 0·80 | 0·07 | 0·67 | 0·04 | 0·89 | 0·04 | 0·80 | 0·04 | |||
CT, cycle threshold; n, number of subjects × 2 meals × 2 times (4 and 6 h); Pmeal, P value for change after the SFA v. PUFA meal; Pgroup, P value for change in FH v. control subjects; ABCA1, ATP-binding cassette, subfamily A, member 1; FH, familial hypercholesterolaemia; C, control; ABCG1, ATP-binding cassette, subfamily G, member 1; CPT1A, carnitine palmitoyltransferase 1A; FADS1, fatty acid desaturase 1; FADS2, fatty acid desaturase 2; FASN, fatty acid synthase; HMGCS1, 3-hydroxy-3-methylglutaryl-CoA synthase 1; INSIG1, insulin-induced gene 1; LDLR, LDL receptor; MSR1, macrophage scavenger receptor 1; SREBF2, sterol regulatory element binding transcription factor 2.
Data are presented as fold change from baseline (0 h) and reference genes (ACSL3 and ACSL4) (2−ΔΔCT). P values are Benjamini−Hochberg adjusted P values from a linear mixed model. There was a significant interaction between meal and group for MSR1 (P = 0·03); thus, P values are presented stratified by group and meal.
SFA > PUFA.
SFA < PUFA.
FH > control.
FH compared with control subjects had significantly larger postprandial increases in expression levels of genes involved in β-oxidation (CPT1A), fatty acid desaturation (FADS2), cholesterol biosynthesis (HMGCS1) and transcription of lipid genes (SREBF2), independent of meal (0·01 ≤ P ≤ 0·02; Table 3). Postprandial expression of genes that did not change significantly different between meals or groups is presented in Supplementary Table S2.
Furthermore, we correlated the change from 0 to 4 h ( ) in expression of the genes that were significantly different between meals (ABCA1, ABCG1, FADS1, FADS2, FASN, INSIG1, LDLR and MSR1) with the change from 0 to 4 h in circulating LDL-C and TAG levels. However, there were no significant correlations between the changes in gene expression of the selected genes and circulating LDL-C and TAG levels after any of the two meals (−0·26 ≤ r ≤ 0·39; 0·05 ≤ P ≤ 0·96; data not shown).
Discussion
In the present study, we found that intake of SFA compared with n-6 PUFA modulated the expression of several key genes in lipid metabolism including a larger reduction of LDLR, smaller increase of INSIG1 and larger increases of ABCA1 and ABCG1 in PBMC. These effects may contribute to the explanation of some of the unfavourable effects induced by SFA compared with n-6 PUFA intake on circulating cholesterol levels.
Intake of SFA has consistently been shown to increase circulating cholesterol levels in dietary intervention studies(2,3,6). However, the molecular mechanisms remain to be completely understood. Few studies have investigated the impact of fat quality on LDLR gene expression in humans. In the present study, a larger reduction in postprandial gene expression level of LDLR in PBMC was found after intake of SFA compared with n-6 PUFA. Decreased LDLR gene expression has also been shown in a previous postprandial study after SFA v. MUFA intake(19). Long-term human studies exploring gene expression in PBMC have shown increased LDLR expression after replacing intake of SFA with PUFA(20), increased LDLR expression after decreasing intake of SFA(16) and decreased LDLR expression after increasing intake of SFA(21). Recently, also a tendency towards lower PBMC gene expression of LDLR was observed after 3 weeks of a low-carbohydrate/high-fat diet (P = 0·06)(22). Moreover, previous results in animals show that PUFA up-regulate LDLR protein and mRNA levels, and that SFA decrease LDLR activity, protein and mRNA abundance and alter LDL composition and size(17,23–25). Collectively, these studies suggest that high intake of SFA affect the gene expression of LDLR, which may, at least partly, explain the established long-term cholesterol-raising effect of an SFA-rich diet.
Since a significant down-regulation of LDLR was seen already 4–6 h after a single meal rich in SFA compared with n-6 PUFA, this unfavourable effect may potentially be even larger if meals rich in SFA are ingested several times daily for a longer period of time. The short duration of the study may explain why we did not observe any postprandial change in LDL-C levels after any of the meals in either the FH or control group(11). Thus, the impact on LDLR gene expression should be investigated in larger long-term studies where SFA are replaced with n-6 PUFA in order to elucidate mechanisms supporting the current nutritional recommendations of replacing intake of SFA with PUFA(26). Furthermore, many FH subjects are characterised by a reduced number of functional LDLR. Thus, if intake of meals rich in SFA further reduces LDLR expression, dietary fat quality could in the long run have an even greater impact on circulating LDL-C levels in persons with FH than in normolipidaemic individuals.
The effect of SFA compared with PUFA on LDLR was accompanied by a smaller increase in gene expression of INSIG1, an important factor in the sterol regulatory element binding cleavage activating protein–sterol regulatory element binding protein (SCAP–SREBP) regulation of cholesterol homeostasis. The INSIG–SCAP–SREBP complex serves as an intracellular sterol sensor, where SREBP is a transcription factor targeting genes involved in intracellular cholesterol homeostasis(27,28). In an intracellular cholesterol-deprived state, e.g. when LDLR is reduced, the SCAP–SREBP complex dissociates from INSIG1, and SREBP is transferred to the nucleus for transcription of its target genes. Thus, the combination of low gene expression of LDLR and INSIG1 may lead to increased intracellular cholesterol production.
In line with others, we found a significantly larger increase in the gene expression of ABCA1 and ABCG1 after intake of SFA compared with PUFA(29). This has been found by others after intake of SFA compared with MUFA(19). ABCA1 and ABCG1 are known to play an important role in the cholesterol efflux from macrophages to HDL(30,31). Thus, our results may indicate an increased cholesterol efflux possibly due to INSIG-induced intracellular cholesterol production, which may lead to increased HDL levels. The physiological explanations behind these changes in gene expressions are not understood. However, since cholesterol is an important membrane component(32) and the fatty acid content of phospholipids is prone to dietary changes(33), the present changes in gene expression may play a role in membrane stability.
As expected, we found larger reduction in expression levels of genes involved in fatty acid desaturation (FADS1, FADS2) and smaller increase in expression level of a gene involved in fatty acid synthesis (FASN) after the SFA-rich compared with the n-6 PUFA-rich meal. This finding is in line with previous studies(34–36). Furthermore, intake of SFA compared with n-6 PUFA induced a larger reduction in the gene expression of MSR1 in controls only. MSR1 encodes the scavenger receptor protein SR-A1 which has been shown to have a role in atherosclerosis by mediating uptake of modified LDL (primarily acetylated LDL); however, the underlying mechanisms are not yet fully elucidated. Recent evidence also points to important roles for SR-A1 in inflammation and innate immunity(37). Thus SR-A1 has been suggested to have either anti-atherogenic or pro-atherogenic effects(37). The expression of MSR1 has been suggested to be differently modulated under different genetic backgrounds and during macrophage differentiation(37). The expression of the scavenger receptors CD36 and SR-A1 are regulated by the nuclear receptor PPARγ. PUFA are known ligands of PPARγ; thus, one may speculate that PUFA might regulate SR-A1 through a PPAR mechanism, potentially explaining the larger reduction in expression after intake of SFA compared with n-6 PUFA in healthy controls(38).
Post-transcriptional alterations in LDLR may potentially explain the lower number of functional LDLR and hence the higher circulating level of LDL-C in FH patients(7), and may also explain the similar baseline gene expression level of LDLR observed among subjects with and without FH in this study. Furthermore, we found lower baseline expression levels of genes involved in cholesterol biosynthesis (FDPS) and transcription of lipid genes (NR1H3 and SREBF2) in FH subjects compared with controls. However, there was a larger postprandial increase in the expression of genes involved in cholesterol biosynthesis (HMGCS1) and transcription of lipid genes (SREBF2) in FH subjects compared with controls. Thus, the postprandial changes in HMGCS1 and SREBF2 may result in increased cholesterol biosynthesis in FH subjects compared with controls.
This is a double-blind, randomised and controlled crossover study, presenting secondary outcomes defined prior to study initiation. A major limitation of the study is the relatively low number of subjects, albeit in line with previous similar studies(19,29,39). The clinical relevance of the findings is at present not clear due to the explorative nature of the study, thus larger studies are needed. Another limitation of this study, and most human studies, is that liver biopsies are not readily available and we therefore have to extrapolate results obtained from PBMC. However, PBMC have been shown to be a good model system reflecting hepatic regulation of cholesterol metabolism(13–15).
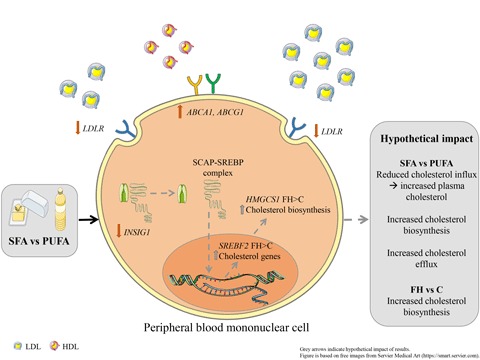
Intake of SFA compared with n-6 PUFA induced changes in gene expression of cholesterol influx and efflux mediators in PBMC including a larger reduction of LDLR and larger increases of ABCA1/G1, possibly, at least partly, explaining some of the cholesterol-raising effects of a high SFA intake (for a graphical summary, see Fig. 2). These data support the current dietary guidelines of replacing SFA with n-6 PUFA and underscore the importance of recommending reduced SFA intake in FH patients with less functional LDLR.
Fig. 2.

Graphical summary. Hypothetical impact of postprandial gene expression in cholesterol homeostasis after SFA v. n-6 PUFA intake. Intake of SFA v. n-6 PUFA induces a larger reduction in the gene expression of LDL receptor (LDLR) and a lower increase of insulin-induced gene 1 (INSIG1) which in combination may potentially result in decreased cholesterol influx, increased circulating cholesterol and increased cholesterol biosynthesis. Furthermore, intake of SFA v. n-6 PUFA induces larger increases in the gene expression of ATP-binding cassette, subfamily A, member 1 (ABCA1) and ATP-binding cassette, subfamily G, member 1 (ABCG1) which may potentially result in increased cholesterol efflux. Grey arrows indicate hypothetical impact of results. SCAP, sterol regulatory element binding cleavage activating protein; SREBP, sterol regulatory element binding protein; HMGCS1, 3-hydroxy-3-methylglutaryl-CoA synthase 1; FH, familial hypercholesterolaemia; C, control; SREBF2, sterol regulatory element binding transcription factor 2. The figure is based on free images from ServierMedical Art (https://smart.servier.com).
Acknowledgements
We would like to thank all the subjects participating in this study. We also thank Anne Randi Enget, Ingunn Jermstad, Anne Marte Wetting Johansen and Navida Akhter Sheikh for excellent technical assistance.
This study was supported by the University of Oslo, Oslo, Norway, the Norwegian National Advisory Unit on Familial Hypercholesterolemia, Oslo University Hospital, Oslo, Norway, the Throne-Holst Foundation for Nutrition Research, Oslo, Norway, the South-Eastern Regional Health Authority, Oslo, Norway and Mills AS (PO Box 4644, Sofienberg, 0506 Oslo, Norway). Mills AS was involved in the design of the study, but K. B. H. and S. M. U. had the final responsibility of the design. Mills AS was involved in conducting the trial and provided oils for the trial. None of the employees at Mills AS was involved in the statistical analysis.
The present study was designed by L. K. L. Ø., M. P. B., S. M. U. and K. B. H.; the research was conducted by L. K. L. Ø., I. N. and P. H.; L. K. L. Ø., M. T. and M. B. V. performed the data analysis. All authors contributed to the interpretation of the data. The paper was drafted by L. K. L. Ø., I. N., M. P. B., S. M. U., K. B. H. and all authors critically reviewed the paper. K. B. H., L. K. L. Ø. and I. N. hold primary responsibility for the content.
S. M. U. has received research grants and/or personal fees from Mills AS, Tine DA and Olympic Seafood, none of which is related to the content of this paper. M. P. B. has received research grants and/or personal fees from Amgen, Sanofi, MSD and Aegerion, none of which is related to the content of this paper. K. B. H. has received research grants and/or personal fees from Tine DA, Mills AS, Olympic Seafood, Amgen, Sanofi, Kaneka and Pronova, none of which is related to the content of this paper. The other authors have no conflicts of interest to disclose.
Supplementary material
For supplementary material accompanying this paper visit https://doi.org/10.1017/jns.2019.25.
click here to view supplementary material
References
- 1.Ference BA, Ginsberg HN, Graham I, et al. (2017) Low-density lipoproteins cause atherosclerotic cardiovascular disease. 1. Evidence from genetic, epidemiologic, and clinical studies. A consensus statement from the European Atherosclerosis Society Consensus Panel. Eur Heart J 38, 2459–2472. [DOI] [PMC free article] [PubMed] [Google Scholar]
- 2.Mensink RP, Zock PL, Kester AD, et al. (2003) Effects of dietary fatty acids and carbohydrates on the ratio of serum total to HDL cholesterol and on serum lipids and apolipoproteins: a meta-analysis of 60 controlled trials. Am J Clin Nutr 77, 1146–1155. [DOI] [PubMed] [Google Scholar]
- 3.Ulven SM, Leder L, Elind E, et al. (2016) Exchanging a few commercial, regularly consumed food items with improved fat quality reduces total cholesterol and LDL-cholesterol: a double-blind, randomised controlled trial. Br J Nutr 116, 1383–1393. [DOI] [PubMed] [Google Scholar]
- 4.Mozaffarian D, Micha R & Wallace S (2010) Effects on coronary heart disease of increasing polyunsaturated fat in place of saturated fat: a systematic review and meta-analysis of randomized controlled trials. PLoS Med 7, e1000252. [DOI] [PMC free article] [PubMed] [Google Scholar]
- 5.Piepoli MF, Hoes AW, Agewall S, et al. (2016) 2016 European guidelines on cardiovascular disease prevention in clinical practice: The Sixth Joint Task Force of the European Society of Cardiology and Other Societies on cardiovascular disease prevention in clinical practice (constituted by representatives of 10 societies and by invited experts) developed with the special contribution of the European Association for Cardiovascular Prevention and Rehabilitation (EACPR). Eur Heart J 37, 2315–2381. [DOI] [PMC free article] [PubMed] [Google Scholar]
- 6.Schwab U, Lauritzen L, Tholstrup T, et al. (2014) Effect of the amount and type of dietary fat on cardiometabolic risk factors and risk of developing type 2 diabetes, cardiovascular diseases, and cancer: a systematic review. Food Nutr Res 58, 25145. [DOI] [PMC free article] [PubMed] [Google Scholar]
- 7.Brautbar A, Leary E, Rasmussen K, et al. (2015) Genetics of familial hypercholesterolemia. Curr Atheroscler Rep 17, 491. [DOI] [PubMed] [Google Scholar]
- 8.Mundal L, Sarancic M, Ose L, et al. (2014) Mortality among patients with familial hypercholesterolemia: a registry-based study in Norway, 1992–2010. J Am Heart Assoc 3, e001236. [DOI] [PMC free article] [PubMed] [Google Scholar]
- 9.Kolovou GD, Kostakou PM & Anagnostopoulou KK (2011) Familial hypercholesterolemia and triglyceride metabolism. Int J Cardiol 147, 349–358. [DOI] [PubMed] [Google Scholar]
- 10.Chan DC & Watts GF (2012) Postprandial lipoprotein metabolism in familial hypercholesterolemia: thinking outside the box. Metabolism 61, 3–11. [DOI] [PubMed] [Google Scholar]
- 11.Oyri LKL, Hansson P, Bogsrud MP, et al. (2018) Delayed postprandial TAG peak after intake of SFA compared with PUFA in subjects with and without familial hypercholesterolaemia: a randomised controlled trial. Br J Nutr 119, 1142–1150. [DOI] [PubMed] [Google Scholar]
- 12.Caimari A, Oliver P, Keijer J, et al. (2010) Peripheral blood mononuclear cells as a model to study the response of energy homeostasis-related genes to acute changes in feeding conditions. OMICS 14, 129–141. [DOI] [PubMed] [Google Scholar]
- 13.Powell EE & Kroon PA (1994) Low density lipoprotein receptor and 3-hydroxy-3-methylglutaryl coenzyme A reductase gene expression in human mononuclear leukocytes is regulated coordinately and parallels gene expression in human liver. J Clin Invest 93, 2168–2174. [DOI] [PMC free article] [PubMed] [Google Scholar]
- 14.Aggarwal D, Freake HC, Soliman GA, et al. (2006) Validation of using gene expression in mononuclear cells as a marker for hepatic cholesterol metabolism. Lipids Health Dis 5, 22. [DOI] [PMC free article] [PubMed] [Google Scholar]
- 15.Liew CC, Ma J, Tang HC, et al. (2006) The peripheral blood transcriptome dynamically reflects system wide biology: a potential diagnostic tool. J Lab Clin Med 147, 126–132. [DOI] [PubMed] [Google Scholar]
- 16.Mustad VA, Etherton TD, Cooper AD, et al. (1997) Reducing saturated fat intake is associated with increased levels of LDL receptors on mononuclear cells in healthy men and women. J Lipid Res 38, 459–468. [PubMed] [Google Scholar]
- 17.Fernandez ML, Lin EC & McNamara DJ (1992) Regulation of guinea pig plasma low density lipoprotein kinetics by dietary fat saturation. J Lipid Res 33, 97–109. [PubMed] [Google Scholar]
- 18.Livak KJ & Schmittgen TD (2001) Analysis of relative gene expression data using real-time quantitative PCR and the 2–ΔΔ CT method. Methods 25, 402–408. [DOI] [PubMed] [Google Scholar]
- 19.Esser D, van Dijk SJ, Oosterink E, et al. (2015) High fat challenges with different fatty acids affect distinct atherogenic gene expression pathways in immune cells from lean and obese subjects. Mol Nutr Food Res 59, 1563–1572. [DOI] [PubMed] [Google Scholar]
- 20.Ulven SM, Christensen JJ, Nygard O, et al. (2019) Using metabolic profiling and gene expression analyses to explore molecular effects of replacing saturated fat with polyunsaturated fat – a randomized controlled dietary intervention study. Am J Clin Nutr 109, 1239–1250. [DOI] [PMC free article] [PubMed] [Google Scholar]
- 21.Choi SH, Gharahmany G, Walzem RL, et al. (2018) Ground beef high in total fat and saturated fatty acids decreases X receptor signaling targets in peripheral blood mononuclear cells of men and women. Lipids 53, 279–290. [DOI] [PubMed] [Google Scholar]
- 22.Retterstøl K, Svendsen M, Narverud I, et al. (2018) Effect of low carbohydrate high fat diet on LDL cholesterol and gene expression in normal-weight, young adults: a randomized controlled study. Atherosclerosis 279, 52–61. [DOI] [PubMed] [Google Scholar]
- 23.Fernandez ML & West KL (2005) Mechanisms by which dietary fatty acids modulate plasma lipids. J Nutr 135, 2075–2078. [DOI] [PubMed] [Google Scholar]
- 24.Horton JD, Cuthbert JA & Spady DK (1993) Dietary fatty acids regulate hepatic low density lipoprotein (LDL) transport by altering LDL receptor protein and mRNA levels. J Clin Invest 92, 743–749. [DOI] [PMC free article] [PubMed] [Google Scholar]
- 25.Mustad VA, Ellsworth JL, Cooper AD, et al. (1996) Dietary linoleic acid increases and palmitic acid decreases hepatic LDL receptor protein and mRNA abundance in young pigs. J Lipid Res 37, 2310–2323. [PubMed] [Google Scholar]
- 26.Sacks FM, Lichtenstein AH, Wu JHY, et al. (2017) Dietary fats and cardiovascular disease: a presidential advisory from the American Heart Association. Circulation 136, e1–e23. [DOI] [PubMed] [Google Scholar]
- 27.Raghow R, Yellaturu C, Deng X, et al. (2008) SREBPs: the crossroads of physiological and pathological lipid homeostasis. Trends Endocrinol Metab 19, 65–73. [DOI] [PubMed] [Google Scholar]
- 28.Engelking LJ, Liang G, Hammer RE, et al. (2005) Schoenheimer effect explained – feedback regulation of cholesterol synthesis in mice mediated by Insig proteins. J Clin Invest 115, 2489–2498. [DOI] [PMC free article] [PubMed] [Google Scholar]
- 29.Bouwens M, Grootte Bromhaar M, Jansen J, et al. (2010) Postprandial dietary lipid-specific effects on human peripheral blood mononuclear cell gene expression profiles. Am J Clin Nutr 91, 208–217. [DOI] [PubMed] [Google Scholar]
- 30.Kennedy MA, Barrera GC, Nakamura K, et al. (2005) ABCG1 has a critical role in mediating cholesterol efflux to HDL and preventing cellular lipid accumulation. Cell Metab 1, 121–131. [DOI] [PubMed] [Google Scholar]
- 31.Wang N, Lan D, Chen W, et al. (2004) ATP-binding cassette transporters G1 and G4 mediate cellular cholesterol efflux to high-density lipoproteins. Proc Natl Acad Sci U S A 101, 9774–9779. [DOI] [PMC free article] [PubMed] [Google Scholar]
- 32.van Meer G, Voelker DR & Feigenson GW (2008) Membrane lipids: where they are and how they behave. Nat Rev Mol Cell Biol 9, 112–124. [DOI] [PMC free article] [PubMed] [Google Scholar]
- 33.de Carvalho C & Caramujo MJ (2018) The various roles of fatty acids. Molecules 23, E2583. [DOI] [PMC free article] [PubMed] [Google Scholar]
- 34.Matsuzaka T, Shimano H, Yahagi N, et al. (2002) Dual regulation of mouse Δ5- and Δ6-desaturase gene expression by SREBP-1 and PPARα. J Lipid Res 43, 107–114. [PubMed] [Google Scholar]
- 35.Ntambi JM (1999) Regulation of stearoyl-CoA desaturase by polyunsaturated fatty acids and cholesterol. J Lipid Res 40, 1549–1558. [PubMed] [Google Scholar]
- 36.Reardon HT, Hsieh AT, Park WJ, et al. (2013) Dietary long-chain polyunsaturated fatty acids upregulate expression of FADS3 transcripts. Prostaglandins Leukot Essent Fatty Acids 88, 15–19. [DOI] [PMC free article] [PubMed] [Google Scholar]
- 37.Kelley JL, Ozment TR, Li C, et al. (2014) Scavenger receptor-A (CD204): a two-edged sword in health and disease. Crit Rev Immunol 34, 241–261. [DOI] [PMC free article] [PubMed] [Google Scholar]
- 38.Oh J, Riek AE, Weng S, et al. (2012) Endoplasmic reticulum stress controls M2 macrophage differentiation and foam cell formation. J Biol Chem 287, 11629–11641. [DOI] [PMC free article] [PubMed] [Google Scholar]
- 39.Dolores Mayas M, Isabel Queipo-Ortuno M, Clemente-Postigo M, et al. (2011) Influence of a fat overload on lipogenic regulators in metabolic syndrome patients. Br J Nutr 105, 895–901. [DOI] [PubMed] [Google Scholar]
Associated Data
This section collects any data citations, data availability statements, or supplementary materials included in this article.
Supplementary Materials
For supplementary material accompanying this paper visit https://doi.org/10.1017/jns.2019.25.
click here to view supplementary material