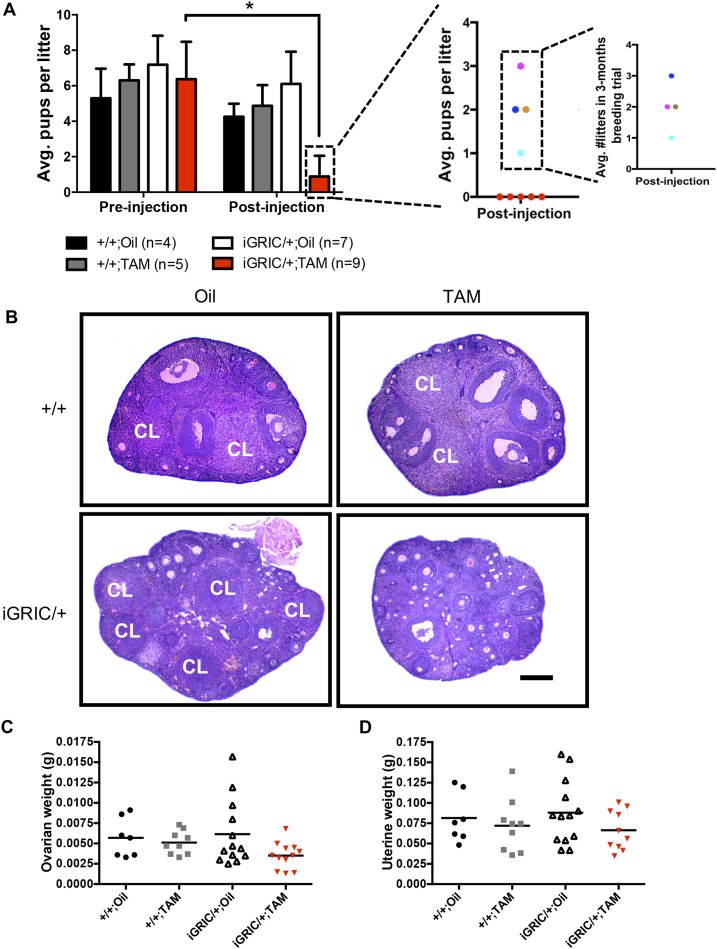
Figure 2.
Impaired fertility and ovarian follicular development in induced F2S4 cKO females. (A) Fertility assessment before and after oil or tamoxifen injections in control and induced F2S4 cKO females. The panels at the right indicate individual fertility data (litter size) for sterile (red dots) and subfertile females (cyan, royal blue, brown, and pink dots). The number of litters produced by subfertile mice is also shown. (B) Representative ovarian tissue sections in control and induced F2S4 cKO mice. Scale bar, 200 μm. (C) Ovarian and (D) uterine weights of control and induced F2S4 cKO females 1 month after oil or tamoxifen injections. Horizontal lines reflect group means (+SEM). Each data point represents one animal. Fertility of each group before injection was analyzed by one-way ANOVA. Fertility before and after treatment in iGRIC/+;TAM group was analyzed by Student t test. *P < 0.05. Avg., average; CL, corpus luteum; TAM, tamoxifen.

