

Abstract
Background:
Prediction of HIV transmission cluster growth may help guide public health action. We developed a predictive model for cluster growth in North Carolina (NC) using routine HIV surveillance data.
Methods:
We identified putative transmission clusters with ≥2 members via pairwise genetic distances ≤1.5% from HIV-1 pol sequences sampled 11/2010–12/2017 in NC. Clusters established by a baseline of 01/2015 with any sequences sampled within two years before baseline were assessed for growth (new diagnoses) over 18 months. We developed a predictive model for cluster growth incorporating demographic, clinical, temporal, and contact tracing characteristics of baseline cluster members. We internally and temporally externally validated the final model in the periods 01/2015–06/2016 and 07/2016–12/2017.
Results:
Cluster growth was predicted by larger baseline cluster size, shorter time between diagnosis and HIV care entry, younger age, shorter time since the most recent HIV diagnosis, higher proportion with no named contacts, and higher proportion with HIV viremia. The model showed areas under the receiver operating characteristic curves of 0.82 and 0.83 in the internal and temporal external validation samples.
Conclusion:
The predictive model developed and validated here is a novel means of identifying HIV transmission clusters that may benefit from targeted HIV control resources.
Keywords: HIV transmission cluster, HIV genetic cluster, predictive model, cluster growth
INTRODUCTION
Despite major advances in HIV treatment and prevention, flat or rising HIV incidence remains a major public health problem in numerous settings [1]. Globally, only very gradual declines in incidence have been observed in most regions since 2010, while large increases have occurred in eastern Europe and central Asia [1]. In the United States, young, Black or Hispanic men who have sex with men (MSM) have shown static or increasing incidence in recent years [2]. Novel approaches to reducing HIV transmission across a range of highly affected populations have been proposed, including investigation of HIV transmission clusters [3, 4].
HIV transmission clusters are groups of persons living with HIV (PLWH) with closely related viral sequences, signifying a network of local HIV transmission [4–8]. Identification of and response to HIV transmission clusters that are likely to grow holds promise in guiding interventions to interrupt transmission and improve HIV care engagement. However, accurate forecasting of future cluster growth is needed to implement this strategy. Although multiple factors – including large baseline size [9, 10], presence of acute HIV infections [10], and geographic diversity [9, 11] – have been individually associated with future cluster growth, no tool synthesizing predictor information for use by public health agencies has been developed.
We developed and validated a predictive model to forecast cluster growth using cluster-level demographic, clinical, temporal, and contact tracing characteristics contained in routinely collected HIV surveillance data in North Carolina (NC), a setting with a high relative HIV burden [2, 12]. By identifying clusters that are likely to grow, the model is intended to guide cluster selection for enhanced interventions to diagnose additional cluster members, bridge viremic cluster members to expedited treatment, and link HIV-negative contacts with pre-exposure prophylaxis (PrEP).
METHODS
Study Design
We conducted a combined analysis of HIV sequence and surveillance data from diagnosed PLWH in NC who had at least one sequence available. We obtained partial pol (protease and reverse transcriptase) HIV-1 sequences generated from routine genotypic resistance testing at Laboratory Corporation of America, the largest reference laboratory in NC, from 11/2010 through 12/2017. Sequence data were linked to the NC Division of Public Health’s (DPH) Electronic Disease Surveillance System (NC EDSS), which includes demographic, clinical, and contact tracing data for all persons diagnosed with HIV and reported in NC. We evaluated predictors of cluster growth using two 18-month observation periods. First, we developed a model to predict cluster growth from 01/2015 to 06/2016. Next, we temporally externally validated the model in the subsequent 18 months, 07/2016–12/2017, using data that became available after the initial model development phase. The Biomedical Institutional Review Board at the University of North Carolina at Chapel Hill approved this study.
Transmission Cluster Identification and Growth Assessment
Putative clusters were identified based on the first available full-length protease and partial reverse transcriptase sequence for each individual. Sequences were aligned with Clustal Omega and manually edited to strip gapped positions [13]. Final sequence length was 1,497 bases. Clusters were generated in HIV TRACE [14] by linking sequences with pairwise distance ≤0.015 (1.5%) substitutions per site divergent (see Supplemental Figure 1, http://links.lww.com/QAI/B238foranexplanationofthiscutoff) based on the Tamura-Nei-93 substitution model [15]. We defined transmission clusters as links composed of ≥2 members, where each cluster member was linked to at least one other member with distance ≤1.5%.
For each 18-month observation period (01/2015–06/2016 and 07/2016–12/2017), we first identified clusters that were both established and recently active at the start of that observation period (baseline). “Established” was defined as having ≥2 sequences sampled prior to baseline, and “recently active” was defined as having any sequences sampled in the two years prior to baseline. Receipt of new sequences in the two years prior was chosen as a signifier of recent transmission potential because viremia is a necessary condition for viral sequencing. Cluster members were categorized as: (1) baseline: person with an HIV diagnosis and sequence prior to baseline; (2) new: person newly diagnosed with HIV and sequenced during the observation period; (3) hidden: person diagnosed prior to baseline, but whose first available sequence was sampled during the observation period. Clusters and relevant members were identified independently for each observation period and could be included as “established” in the internal, temporal external, or both validation populations.
Among clusters that were established and recently active at baseline, growth was defined as the diagnosis of at least one new member in the relevant 18-month observation period [Figure 1A]. Non-growing clusters were composed only of sequences sampled from persons diagnosed prior to baseline (baseline or hidden persons) [Figure 1B]. Although hidden members would have been identified as baseline members had a sequence been available prior to baseline, they were not treated as baseline cluster members because they would not be observable in the cluster for real-time public health application of the predictive model. Hidden cluster members were also not counted toward cluster growth because they were diagnosed prior to baseline.
Figure 1.
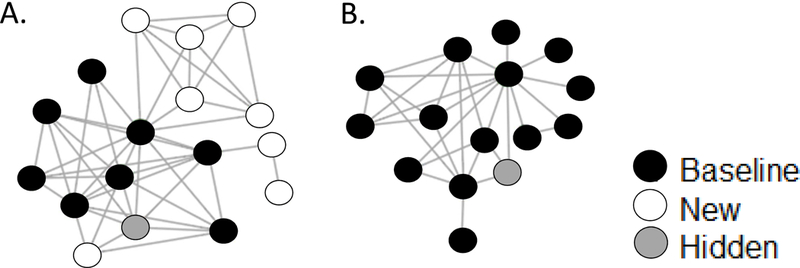
A. Network diagram for an example “growing cluster.” Black circles indicate sequences sampled prior to baseline (baseline cluster members), white circles indicate sequences sampled following baseline from new diagnoses (new cluster members), and gray circles indicate sequences sampled following baseline from prior diagnoses (hidden cluster members). Lines indicate ≤1.5% TN-93 genetic distance between individuals. B. Network diagram for an example “non-growing cluster.”
Predictive Model Development
We completed model development and validation in five main steps [Supplemental Figure 2, http://links.lww.com/QAI/B238]. First, we identified 18 cluster-level variables as candidate predictors of cluster growth over time (step 1), choosing variables that could be reliably assessed using NC EDSS data and that had known or plausible associations with HIV transmission or case detection [Supplemental Table 1, http://links.lww.com/QAI/B238]. One of these 18 variables was cluster size at baseline, and the remaining 17 were calculated from baseline members’ characteristics and categorized in one of four domains: temporal, demographic, clinical, or contact tracing. Temporal variables were based on diagnosis and sequence dates relative to baseline and demographic variables were based on surveillance data recorded at the time of diagnosis or first recognition as a case in NC. Clinical variables were largely based on laboratory data (CD4 counts and viral load measurements), which are required by NC law to be reported to the DPH for surveillance purposes. As is common in surveillance-based analyses [16], we treated these laboratory reports as proxies for HIV care visits. Recency of infection was determined as previously described as acute or recent infection at diagnosis, or chronic infection at diagnosis [8]. Contact tracing variables were based on documented encounters with disease intervention specialists (DIS), DPH employees who attempt contact with all newly HIV-diagnosed persons within approximately one week of diagnosis to link them to HIV medical care and perform partner counseling and referral services.
Of the 18 candidate predictors specified a priori, two were excluded from further consideration because of substantial missingness (>64% of cluster members with missing data): the percentage of cluster members who reported meeting sex partners online and the percentage who reported a prior or prevalent sexually transmitted infection. Of the remaining 16 predictors, one was cluster size at baseline, and the other 15 (grouped by domain) were as follows: (1) temporal: years since the most recent diagnosis, years since the earliest diagnosis, and years since the earliest sequence; (2) demographic: median age at baseline, percentage persons who inject drugs (PWID), percentage MSM, percentage male, percentage Black, non-Hispanic, and percentage residing in a single NC region; (3) clinical: percentage with HIV viral loads ≥1,000 copies/mL at the most recent care visit or no viral load in the year prior to baseline (assumed out of care and detectable), percentage diagnosed during acute or recent infection in the two years prior to baseline, median time to HIV care entry following diagnosis, percentage in HIV care during the year prior to baseline; and (4) contact tracing: percentage interviewed by DIS at diagnosis and percentage with no named, identifiable contacts.
We assessed the crude associations between each of these 16 candidate predictors and cluster growth to select variables for retention in a full multivariable model (step 2). To preserve the original sample for use in internal model validation (see step 4 below), we conducted these analyses in a sample drawn from the original set of established, recently active clusters. To create a sample of equal size to the original set of N observed clusters, we conducted N individual draws (with replacement) of clusters in the original sample. We then used logistic regression to estimate the unadjusted associations between each predictor and binary cluster growth, testing continuous, binomial, and categorical coding to identify the strongest predictive form for each variable. Predictors with Wald Chi-square p-values > 0.25 in the logistic regression model, along with collinear variables (Pearson correlation coefficient of ≥0.7), were excluded from further consideration. Of the original 16 candidate predictors, all but percentage male (which we removed due to collinearity with percentage MSM) survived this process and were eligible for inclusion in a full multivariable model in their strongest predictive forms.
To determine whether reduced models could predict cluster growth with similar accuracy but greater parsimony than the full model, we applied a bootstrap method [17–19] for model selection (step 3) due to the small available sample of established clusters. This method leverages random samples of the same underlying population during model development and forces documentation and visibility of the volatility of predictor selection [17–19]. We first drew 100 bootstrapped samples of size N, including the prior sample drawn in step 2 for preliminary predictor assessments, forming each sample through N draws (with replacement) of individual clusters from the original set of N established, recently active clusters. We then constructed reduced logistic regression models in each of the bootstrapped samples through backward elimination, sequentially removing predictors with the largest Wald Chi-square p-value and retaining predictors if a reduced model showed a Wald Chi-square p-value ≤ 0.10 compared to the previous model. The frequency of retention in the final model after complete backward elimination in each of the bootstrapped samples was assessed for each predictor [Supplemental Table 2, http://links.lww.com/QAI/B238]. Retained predictors did not change substantially with additional (200 or 500) bootstrapped samples. Five candidate reduced models were then generated by including predictors retained in ≥20%, ≥30%, ≥40%, ≥50%, and ≥70% of the bootstrapped final models [Supplemental Table 3, http://links.lww.com/QAI/B238].
The five candidate reduced models and the full model were then applied to the original sample for final model selection (step 4) [17–19]. Models were considered sufficiently fit with Chi-square p-values ≥0.10 using the Hosmer-Lemeshow test [20]. The area under the receiver operating characteristic curve (ROC-AUC) was calculated for each reduced model in the original sample, and changes of ≤0.01 in ROC-AUC compared to the full model were deemed acceptable losses of predictive power [20]. We also calculated the Akaike Information Criterion (AIC) and Bayesian Information Criterion (BIC) to evaluate comparative model fit. A final model was selected considering ROC-AUC, AIC, BIC, and model complexity. Optimism and the optimism-corrected ROC-AUC were calculated for the final model to account for potential overestimation of predictive power after fitting and internally validating the model on the same source dataset, despite bootstrapping [21]. This model was then applied to the temporal external validation population of clusters to test for reproducibility over time via ROC-AUC (step 5).
Predictive Model Application
Using the final model, we estimated predicted probabilities of cluster growth for each established, recently active cluster, and we calculated the sensitivities and specificities of predicted probability cutoffs (≥0.1 to ≥0.9 by 0.1 increments) in identifying growing clusters for potential intervention. We also calculated for each cutoff the proportion of clusters that would require additional public health investigation and the proportion of new members who belonged to a cluster that would be selected for investigation. We then repeated these calculations for the temporal external validation sample.
All analyses were conducted in SAS 9.4 (SAS Institute Inc., Cary, NC) and visualizations were produced in R 3.5.0. Sequence and participant data may not be shared under the term- of the Data Use Agreement governing this analysis. De-identified data may be available through a data request process requiring a Data Use Agreement. request process requiring a Data Use Agreement.
RESULTS
Study Population & HIV Transmission Clusters
Sequences were available for 10,084 persons diagnosed with HIV 1982–2017. Approximately 35,000 persons were living with diagnosed HIV in NC in 2017, giving overall sequence coverage of ~29% [22]. Sequence coverage has increased in recent years and sequences were available for 49%, 52%, and 51% of persons newly diagnosed in 2014, 2015, and 2016, respectively [12]. Compared to all persons diagnosed with HIV and living in NC in 2017, persons with sequences were younger (32.6% vs. 20.3% <35 as of 12/31/2017), less likely to self-identify as MSM (47.1% vs. 72.0%) and PWID (7.3% vs. 11.0%), and more likely to be African American (69.2% vs. 58.4%).
For initial model development and internal validation (baseline of 01/2015), sequence data were available for 8,202 persons. One-third of these persons (2,750/8,202; 33.5%) were identified in 730 putative clusters and half of all clusters (352/730; 48.2%) were recently active and established prior to baseline (1,835 sequences) [Figure 2A]. The median established cluster size was three baseline members (range 2 – 34); 163 clusters (46.3%) were dyads at baseline, 126 (35.8%) contained 3–5 members, 46 (13.1%) contained 6–10 members, and 17 (4.8%) contained >10 members at baseline [Supplemental Figure 3, http://links.lww.com/QAI/B238].
Figure 2.
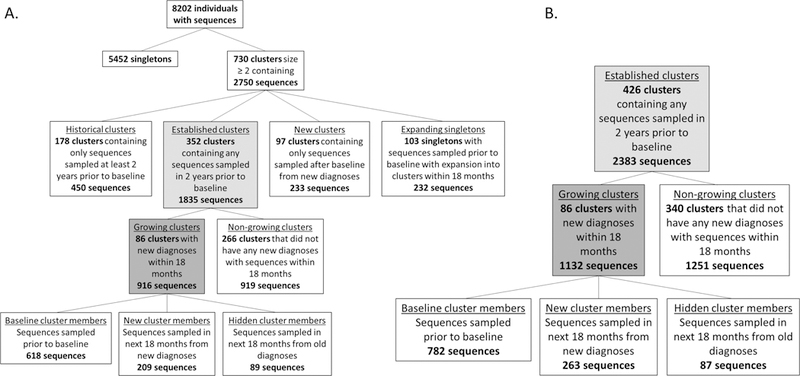
A. Study population identification for model development and internal validation. B. Targeted study population identification for temporal external validation.
Characteristics of Growing & Non-growing Clusters
One-quarter of established, recently active clusters (24.4%; 86/352) grew during the initial observation period, adding 209 new cluster members [Figure 2A]. In growing clusters, 89/916 cluster members (9.7%) were hidden, compared with 47/919 (5.1%) in non-growing clusters. Growing clusters were larger at baseline than non-growing clusters (median size: five vs. two baseline members) and had more recently experienced a new diagnosis (median 0.4 vs. 1.8 years between the most recent diagnosis and baseline).
Baseline members of growing clusters were younger at baseline (median age: 29 vs. 35 years), more likely to be male (88.8% vs. 76.3%), and more likely to identify as Black, non-Hispanic (75.7% vs. 71.9%) and MSM (70.7% vs. 52.2%) than baseline members of non-growing clusters [Table 1]. Baseline members of growing clusters also had a shorter median time to HIV care entry following diagnosis than those in non-growing clusters (46 vs. 78 days), but were more likely to have HIV viremia at the most recent care visit (≥1000 copies/mL) or no available viral load in the year prior to baseline (49.4% vs. 43.5%).
Table 1.
Selected characteristics of individuals in recently active, established clusters, including baseline members of both growing and non-growing clusters and new members of growing clusters in the internal and temporal external validation samples.
| Characteristic | Internal Validation | Temporal External Validation | ||||
|---|---|---|---|---|---|---|
| Non-growing clusters | Growing clusters | Non-growing clusters | Growing clusters | |||
| Baseline members, N (%) |
Baseline members, N (%) |
New members, N (%) |
Baseline members, N (%) |
Baseline members, N (%) |
New members, N (%) |
|
| Total | 872 | 618 | 209 | 1204 | 782 | 263 |
| Age at baseline | ||||||
| <25 years | 125 (14.3) | 153 (24.8) | 90 (43.1) | 149 (12.4) | 204 (26.1) | 119 (45.3) |
| 25–34 years | 318 (36.5) | 263 (42.6) | 62 (29.7) | 470 (39.0) | 360 (46.0) | 89 (33.8) |
| 35–44 years | 176 (20.2) | 95 (15.4) | 30 (14.4) | 261 (21.7) | 114 (14.6) | 17 (6.5) |
| > 45 years | 253 (29.0) | 107 (17.3) | 27 (12.9) | 324 (26.9) | 104 (13.3) | 38 (14.5) |
| Birth sex | ||||||
| Male | 665 (76.3) | 549 (88.8) | 188 (90.0) | 984 (81.7) | 697 (89.1) | 242 (92.0) |
| Female | 207 (23.7) | 69 (11.2) | 21 (10.1) | 220 (18.3) | 85 (10.9) | 21 (8.0) |
| Race/Ethnicity | ||||||
| White, non-Hispanic | 163 (18.7) | 96 (15.5) | 38 (18.2) | 231 (19.2) | 111 (14.2) | 59 (22.4) |
| Black, non-Hispanic | 627 (71.9) | 468 (75.7) | 150 (71.8) | 8533 (70.9) | 592 (75.7) | 177 (67.3) |
| Hispanic | 44 (5.1) | 18 (2.9) | 16 (7.7) | 73 (6.1) | 41 (5.2) | 18 (6.8) |
| Other | 38 (4.4) | 36 (5.8) | 5 (2.4) | 47 (3.9) | 38 (4.9) | 9 (3.4) |
| Men who have sex with men (MSM) | 455 (52.2) | 437 (70.7) | 154 (73.7) | 715 (59.4) | 571 (73.0) | 198 (75.3) |
| Persons who inject drugs (PWID) | 47 (5.4) | 15 (2.4) | 8 (3.8) | 60 (5.0) | 25 (3.2) | 9 (3.4) |
| Acute or recent HIV diagnosis | 28 (3.2) | 34 (5.5) | 21 (10.1) | 53 (4.4) | 67 (8.6) | 21 (8.0) |
| Time to care entry after diagnosis | ||||||
| <30 days | 315 (36.1) | 262 (42.4) | 144 (68.9) | 497 (41.3) | 366 (46.8) | 197 (74.9) |
| 30–90 days | 133 (15.3) | 116 (18.8) | 55 (26.3) | 209 (17.4) | 157 (20.1) | 57 (21.7) |
| 90 days-1 year | 74 (8.5) | 57 (9.2) | 9 (4.3) | 93 (7.7) | 74 (9.5) | 8 (3.0) |
| >1 year | 350 (40.1) | 183 (29.6) | 1 (0.5) | 405 (33.6) | 185 (23.7) | 1 (0.4) |
| In care during 1 year priora | 686 (78.7) | 490 (79.3) | --- | 978 (81.2) | 631 (80.7) | --- |
| HIV viremia (≥1000 copies/mL)b | 379 (43.5) | 305 (49.4) | --- | 469 (39.0) | 365 (46.7) | --- |
| ≥ 1 named contacts | 376 (43.1) | 266 (43.0) | 96 (45.9) | 519 (43.1) | 365 (46.7) | 118 (44.9) |
| Reached by DIS | 583 (66.9) | 451 (73.0) | 161 (77.0) | 813 (67.5) | 588 (75.2) | 224 (85.2) |
Disease Intervention Services (DIS)
Attended at least one care visit during the one year prior to baseline, as measured by the presence of a viral load, CD4 count, or sequence from that period in surveillance data. Excluded those who died prior to baseline and those who were not yet diagnosed from calculation
Showed HIV viremia (≥1000 copies/mL) at the most recent care visit or had no viral load in the one year prior to baseline. Excluded those who died prior to baseline and those who were not yet diagnosed from calculation.
New members of growing clusters were younger (median age: 26 years) than baseline members of both growing and non-growing clusters and were predominantly self-identifying MSM (73.7%). They were also more likely to have been diagnosed during acute or recent infection (10.1%) than baseline members of both growing (5.5%) and non-growing clusters (3.2%).
Predictive Model Internal & Temporal External Validation
As the ROC-AUC values and ROC curves were nearly identical for all candidate reduced models [Supplemental Figure 4, http://links.lww.com/QAI/B238], and because the Hosmer-Lemeshow test showed acceptable goodness of fit, we selected the model with the lowest BIC (344.47) [Supplemental Table 3, http://links.lww.com/QAI/B238] and thus the best comparative fit as our final model. This model was also considerably simpler (6 predictors retained following complete elimination in ≥50/100 bootstrapped samples) than the full model, and had <0.01 loss of ROC-AUC compared to the full model.
In this final model, cluster growth was predicted by larger baseline cluster size (adjusted odds ratio [aOR] = 1.17 per one-person increase), shorter median time to HIV care entry after diagnosis (aOR = 0.85 per one-year increase), and younger median age at baseline (aOR = 0.67 per ten-year increase). Cluster growth was also predicted by >50% baseline cluster members with no named contacts (aOR = 2.13), ≤1 year since the most recent diagnosis in the cluster (aOR = 2.69), and higher percentage with HIV viremia (RNA ≥1,000 copies/mL) or no available viral load during the year prior to baseline (0% < x ≤ 25%: aOR = 2.03; 25% < x ≤ 50%: aOR = 4.31; and >50%: aOR = 2.74) [Figure 3]. The final model had an ROC-AUC of 0.83 and optimism-corrected ROC-AUC of 0.82 in the internal validation sample, indicating excellent predictive ability [23].
Figure 3.
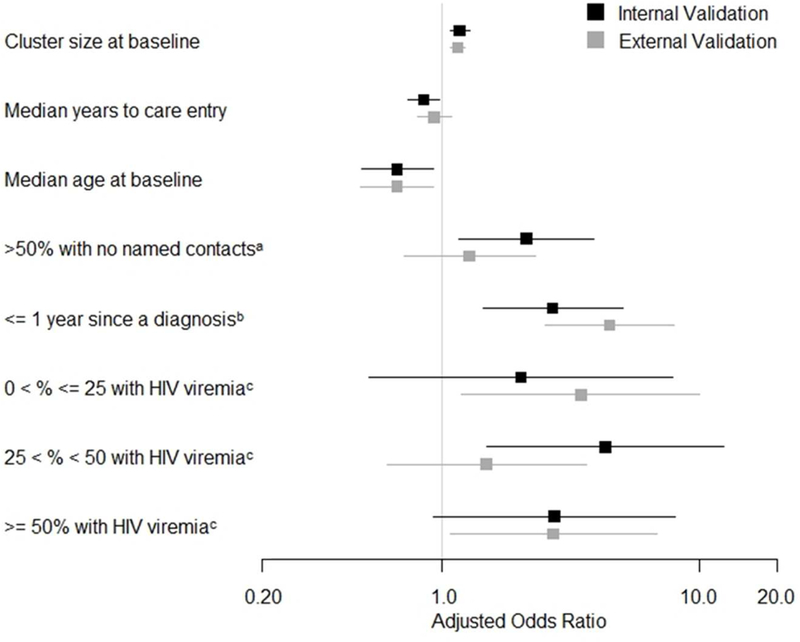
Predictor adjusted odds ratios (aORs) with application of the final model to the internal and temporal external validation samples. 95% confidence intervals are shown with horizontal bars. aORs for cluster size at baseline and median years to care entry represent a one-unit increase in cluster members and years, respectively. aOR for median age at baseline represents a ten-year increase in median age. aaOR is in comparison to ≤50% of cluster members with no named contacts. baOR is in comparison to >1 year since a diagnosis in the cluster. caOR is in comparison to 0% of cluster members with HIV viremia.
The temporal external validation population was composed of 426 established clusters identified from all sequences sampled through 12/2017 [Figure 2B]. The final model had an ROC-AUC of 0.83 in this population.
A low predicted probability cutoff, ≥0.1, would identify clusters accounting for 92% of all new cluster members identified during 18 months of observation, but would require investigation of only 55% of established clusters in the temporal external validation population [Figure 4B]. Intervention upon these clusters could potentially allow for earlier diagnosis of or prevention of transmission to these 92% of new cluster members. Conversely, a high cutoff, ≥0.9, would require investigation of only 2% of established clusters but would identify clusters containing 18% of these new cluster members.
Figure 4.
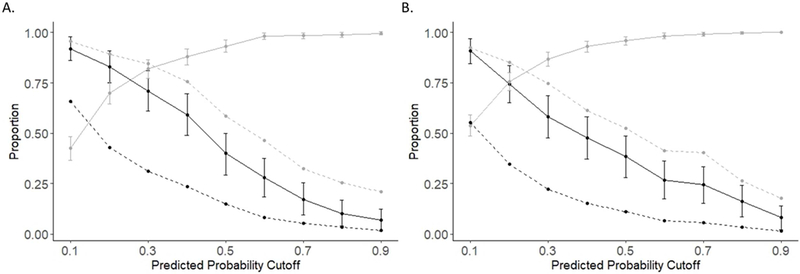
A. Evaluation of sensitivity, specificity, and coverage of predicted probability cutoffs in the internal validation cluster population. The solid black line indicates sensitivity and the solid gray line indicates specificity. 95% confidence intervals for sensitivity and specificity are shown with vertical bars. The dashed black line indicates the proportion of clusters with predicted probabilities equal to or greater than the predicted probability cutoff. The dashed gray line indicates the proportion of new cluster members that are included in investigated clusters with each cutoff. B. Evaluation of sensitivity, specificity, and coverage of predicted probability cutoffs in the temporal external validation cluster population.
Sensitivity Analyses
We performed a sensitivity analysis with a maximum pairwise genetic distance of ≤0.005 for cluster detection to evaluate how a tighter genetic distance threshold would impact the model’s predictive ability. However, too few growing clusters were observed under this cutoff to achieve model convergence with our data in either population of clusters. In a second sensitivity analysis excluding dyads, we observed an optimism-adjusted ROC-AUC of 0.746 in the internal validation sample and an ROC-AUC of 0.812 in the temporal external validation sample with the final model. Predictor adjusted odds ratios are presented in Supplemental Table 4, http://links.lww.com/QAI/B238. This smaller population of clusters showed generally similarly trending aORs with lower precision than the main analyses.
DISCUSSION
Identification of HIV transmission clusters that are likely to grow in the near future has the potential to guide prioritization of public health interventions to cluster members and their known contacts in an era of ongoing HIV incidence [3]. Limited resources within public health departments necessitate novel approaches to improving efficiency, particularly given current uncertainties around funding for HIV prevention, care, and treatment [24]. To our knowledge, we have developed and validated the first public health tool for forecasting cluster growth with multiple cluster-level characteristics obtainable from routine HIV surveillance data. Our model showed excellent ability to predict HIV transmission cluster growth over 18 months.
The predictors identified in our final model likely correspond with several different mechanisms for observed cluster growth, as new cluster members (i.e., persons signifying growth) could represent new transmissions, newly diagnosed cases reached as a result of contact tracing for baseline cluster members, or newly diagnosed cases identified via other routes. Two of the final predictors – specifically, more recent diagnoses and a higher prevalence of viremia among baseline cluster members – may be predictive of observed cluster growth via new transmissions. Viremia is a necessary condition for viral transmission, and recent diagnoses within a cluster may signal members who were unaware of their infections and/or not in care in the recent past. On the other hand, shorter median time between diagnosis and care entry may reflect strong care-seeking behaviors or access that may also be common to baseline members’ partners. As such, the association between this predictor and cluster growth may be related more strongly to infection detection in a cluster rather than transmission. Use of both predictors of new transmissions and predictors of detection of new cluster members – several of which have been individually identified in prior analyses [9–11, 25–29] - allows the model described here to forecast cluster growth as observed in real-world public health scenarios.
The influence of multiple growth mechanisms suggests a variety of intervention strategies, and selection of an appropriate intervention may be guided by individual predictors within the model. Clusters with large proportions of virally unsuppressed PLWH may benefit from enhanced support for care engagement and immediate ART [30] allocated to cluster members and their named contacts who are newly diagnosed or currently unsuppressed. Clusters with a majority of members who do not report any sexual or injecting contacts to DIS may be ideal recipients of non-traditional network recruitment methods, including internet partner notification or social network HIV screening [31]. Finally, clusters with recent diagnoses and young members may especially benefit from enhanced support for PrEP linkage and uptake among HIV-negative named contacts of cluster members to interrupt future transmissions.
Selection of predicted probability cutoffs for prioritization of cluster investigation can be based on resource availability and intervention priorities in a given setting. Higher predicted probability cutoffs have lower sensitivity (and will thus miss some growing clusters), but allow for concentration of limited resources and identify clusters responsible for disproportionate percentages of new cluster members. Public health officials may prefer a low cutoff if the algorithm is applied only to identify clusters warranting further digital oversight, or a high cutoff if the algorithm is used to identify potential clusters for heightened, resource-intensive interventions.
Temporal external validation in a second time period demonstrated that the combination of identified predictors maintained excellent predictive ability over the subsequent 18-month interval in NC, but future changes in epidemic dynamics and public health practice could affect algorithm performance. More specifically, a new mandate for sequence reporting in NC [32] will likely increase the proportion of newly diagnosed cases with sequences available beyond the 40%−50% reserved here. The time between diagnosis and sequencing is also shortening and a larger proportion of diagnosed cluster members thus have sequences available for analysis, can be recognized as cluster members, and contribute to the calculation of predictors year-over-year. Increasing completeness and rapidity of sequencing is likely to shrink the numbers of “hidden” cluster members, which we found to be more prevalent in growing vs. non-growing clusters. Interventions spurred by model results may also alter cluster characteristics, potentially limiting future predictability for some clusters. As these changes occur, updates to the model may be required.
Although we limited our analysis to cluster-level predictors of cluster growth, we did observe expansion of singletons into clusters [Figure 2A]. Further evaluation of individual-level predictors of this process may provide additional insights for targeted public health efforts. STI diagnoses prior to and following an HIV diagnosis are strong indicators of sexual risk behavior that allow for HIV transmission [33]. We were unable to assess STI diagnosis as a potential predictor here due to substantial missing self-reported data, but linkage of HIV and STI surveillance data may allow for inclusion of this predictor in the future.
HIV transmission clusters are derived from available data and should not be interpreted as the full underlying transmission network. MSM and PWID are underrepresented in current sequence data, possibly reducing our ability to detect cluster growth due to new diagnoses in these risk groups. We are unable to determine directionality from these data and we note that genetic linkages may not signify direct transmission events. We also note that cluster growth may in some cases reflect strong case finding via existing mechanisms. A high likelihood of cluster growth should be treated as a signal for further evaluation and potential tailored intervention, not necessarily a sign of rapid transmission. However, an elevated prevalence of acute/recent HIV infections among new members of growing clusters relative to all new diagnoses with sequences in NC over the same time frame indicates potential to disproportionately impact ongoing transmission with cluster-based interventions.
CONCLUSIONS
The predictive model developed and validated here leveraged existing HIV surveillance data and showed excellent predictive ability to forecast transmission cluster growth in NC. Identification of HIV transmission clusters that are likely to grow over time with this type of predictive tool may help guide prioritization of public health interventions to maximize HIV incidence reductions.
Supplementary Material
ACKNOWLEDGEMENTS
All data used in this study were provided by the NC Department of Health and Human Services, Division of Public Health (DPH). The content is solely the responsibility of the authors and does not necessarily represent the official views of the National Institutes of Health or the NC DPH.
Sources of Funding
This work was supported by awards from the National Institute of Allergy and Infectious Disease at the National Institutes of Health [grant numbers K08-AI112432, R01-AI135970, 5T32AI070114-12].
Footnotes
prior presentation
Presented in part: 25th Conference on Retroviruses and Opportunistic Infections, Boston, Massachusetts
Conflicts of Interest
The authors declare that they have no commercial or other associations that may pose conflicts of interest.
REFERENCES
- 1.UNAIDS. Global AIDS Update. Available at: http://www.unaids.org/sites/default/files/media_asset/global-AIDS-update-2016_en.pdf.
- 2.Singh S, Song R, Johnson AS, et al. HIV Incidence, HIV Prevalence, and Undiagnosed HIV Infections in Men Who Have Sex With Men, United States. Ann Intern Med. 2018; 168: 685–694. [DOI] [PubMed] [Google Scholar]
- 3.Oster AM, France AM, Mermin J. Molecular Epidemiology and the Transformation of HIV Prevention. JAMA. 2018; 319: 1657–1658. [DOI] [PMC free article] [PubMed] [Google Scholar]
- 4.Paraskevis D, Nikolopoulos GK, Magiorkinis G, et al. The Application of HIV Molecular Epidemiology to Public Health. Infect Genet Evol. 2016; 46: 159–68. [DOI] [PubMed] [Google Scholar]
- 5.Leigh Brown AJ, Lycett SJ, Weinert L, et al. Transmission Network Parameters Estimated From HIV Sequences for a Nationwide Epidemic. J Infect Dis. 2011; 204: 1463–469. [DOI] [PMC free article] [PubMed] [Google Scholar]
- 6.Chaillon A, Essat A, Frange P, et al. Spatiotemporal Dynamics of HIV-1 Transmission in France (1999–2014) and Impact of Targeted Prevention Strategies. Retrovirology. 2017; 14. [DOI] [PMC free article] [PubMed] [Google Scholar]
- 7.Wertheim JO, Leigh Brown AJ, Hepler NL, et al. The Global Transmission Network of HIV-1. J Infect Dis. 2013; 209: 304–13. [DOI] [PMC free article] [PubMed] [Google Scholar]
- 8.Dennis AM, Pasquale DK, Billock R, et al. Integration of Contact Tracing and Phylogenetics in an Investigation of Acute HIV Infection. Sex Transm Dis. 2018; 45: 222–228. [DOI] [PMC free article] [PubMed] [Google Scholar]
- 9.Brenner BG, Roger M, Stephens D, et al. Transmission Clustering Drives the Onward Spread of the HIV Epidemic Among Men Who Have Sex With Men in Quebec. J Infect Dis. 2011; 204: 1115–1119. [DOI] [PMC free article] [PubMed] [Google Scholar]
- 10.Ragonnet-Cronin M, Ofner-Agostini M, Merks H, et al. Longitudinal Phylogenetic Surveillance Identifies Distinct Patterns of Cluster Dynamics. J Acquir Immune Defic Syndr. 2010; 55: 102–108. [DOI] [PubMed] [Google Scholar]
- 11.Ragonnet-Cronin M, Hodcroft E, Hue S, et al. Automated Analysis of Phylogenetic Clusters. BMC Bioinformatics. 2013; 14: 317. [DOI] [PMC free article] [PubMed] [Google Scholar]
- 12.North Carolina HIV/STD Surveillance Unit. 2016. North Carolina HIV/STD/Hepatitis Surveillance Report. Available at: http://epi.publichealth.nc.gov/cd/stds/figures/std16rpt_rev3.pdf.
- 13.Sievers F, Wilm A, Dineen DG, et al. Fast, scalable generation of high-quality protein multiple sequence alignments using Clustal Omega. Mol Syst Biol. 2011; 7. [DOI] [PMC free article] [PubMed] [Google Scholar]
- 14.Kosakovsky Pond SL, Weaver S, Leigh Brown AJ, et al. HIV-TRACE (TRAnsmission Cluster Engine): a Tool for Large Scale Molecular Epidemiology of HIV-1 and Other Rapidly Evolving Pathogens. Mol Biol Evol. 2018; 35: 1812–1819. [DOI] [PMC free article] [PubMed] [Google Scholar]
- 15.Rose R, Lamers SL, Dollar JJ, et al. Identifying Transmission Clusters with Cluster Picker and HIV-TRACE. AIDS Res Hum Retroviruses. 2017; 33: 211–218. [DOI] [PMC free article] [PubMed] [Google Scholar]
- 16.Lesko CR, Sampson LA, Miller WC, et al. Measuring the HIV Care Continuum Using Public Health Surveillance Data in the United States. J Acquir Immune Defic Syndr. 2015; 70: 489–494. [DOI] [PMC free article] [PubMed] [Google Scholar]
- 17.Austin PC and Tu JV. Bootstrap Methods for Developing Predictive Models. Am Stat. 2004; 58: 131–137. [Google Scholar]
- 18.Harrell FE and Slaughter JC. Biostatistics for Biomedical Research. Available at: http://www.fharrell.com/doc/bbr.pdf.
- 19.Steyerberg EW and Harrell FE. Prediction Models Need Appropriate Internal, Internal-external, and External Validation. J Clin Epidemiol. 2015; 69: 245–247. [DOI] [PMC free article] [PubMed] [Google Scholar]
- 20.Steyerberg EW, Vickers AJ, Cook NR, et al. Assessing the Performance of Prediction Models: a Framework for Some Traditional and Novel Measures. Epidemiology. 2013; 21: 128–138. [DOI] [PMC free article] [PubMed] [Google Scholar]
- 21.Smith GCS, Seaman SR, Wood AM, et al. Correcting for Optimistic Prediction in Small Data Sets. Am J Epidemiol. 2014; 180: 318–324. [DOI] [PMC free article] [PubMed] [Google Scholar]
- 22.North Carolina HIV/STD Surveillance Unit. 2017. North Carolina HIV/STD/Hepatitis Surveillance Report. Available at: https://epi.publichealth.nc.gov/cd/stds/figures/std17rpt_rev2.pdf.
- 23.Hosmer DW and Lemeshow S. Assessing the Fit of the Model In: Applied Logistic Regression. 2nd ed Hoboken, NJ: John Wiley & Sons, Inc., 2000. [Google Scholar]
- 24.Kaiser Family Foundation. U.S. Federal Funding for HIV/AIDS: Trends over Time. Available at: https://www.kff.org/global-health-policy/fact-sheet/u-s-federal-funding-for-hivaids-trends-over-time/.
- 25.Ragonnet-Cronin M, Wertheim JO, Hayford CS, et al. HIV transmission cluster dynamics that inform public health intervention in Illinois [abstract 957]. In: Abstract ebook of the 25th Conference on Retroviruses and Opportunistic Infections (Boston) International Antiviral Society; - USA, 2018. [Google Scholar]
- 26.Raggonet-Cronin M, Hu YW, Wertheim JO. Predicting HIV cluster growth using phylodynamic reconstruction in Los Angeles County [abstract 949]. Presented at: 25th Conference on Retroviruses and Opportunistic Infections; 2018; Boston. [Google Scholar]
- 27.Bachmann N, Kadelka C, Turk T, et al. Cluster analysis reveals important shift of drivers of the HIV in Swiss men [abstract 41]. Presented at: 25th Conference on Retroviruses and Opportunistic Infections; 2018; Boston. [Google Scholar]
- 28.Panneer N, Oster AM, Ocfemia CB, et al. Association between viral suppression and molecular cluster growth, United States [abstract 955]. Presented at: 25th Conference on Retroviruses and Opportunistic Infections; 2018; Boston. [Google Scholar]
- 29.McVea D, Liang R, Joy J, et al. A Framework for Predicting Phylogenetic Clusters of HIV at High Risk for Growth [abstract 848]. Presented at: 24th Conference on Retroviruses and Opportunistic Infections; 2017; Seattle. [Google Scholar]
- 30.Pilcher CD, Ospina-Norvell C, Dasgupta A, et al. The Effect of Same-Day Observed Initiation of Antiretroviral Therapy on HIV Viral Load and Treatment Outcomes in a U.S. Public Health Setting. J Acquir Immune Defic Syndr. 2017; 74: 44–51. [DOI] [PMC free article] [PubMed] [Google Scholar]
- 31.Dailey Garnes NJM, Moore ZS, Cadwell BL, et al. Previously Undiagnosed HIV Infections Identified Through Cluster Investigation, North Carolina, 2002–2007. AIDS Behav. 2015; 19: 723–731. [DOI] [PMC free article] [PubMed] [Google Scholar]
- 32.North Carolina Division of Health and Human Services. Rule 10A NCAC 41A.0202. [Google Scholar]
- 33.Pasquale D Epidemiological Analysis of Sociosexual HIV Networks in Central North Carolina. Doctoral Dissertation. 2018. [Google Scholar]
Associated Data
This section collects any data citations, data availability statements, or supplementary materials included in this article.