

Abstract
Lamisil (terbinafine) is an effective, widely prescribed antifungal drug that causes rare idiosyncratic hepatotoxicity. The proposed toxic mechanism involves a reactive metabolite, 6,6-dimethyl-2-hepten-4-ynal (TBF-A), formed through three N-dealkylation pathways. We were the first to characterize them using in vitro studies with human liver microsomes and modeling approaches, yet knowledge of the individual enzymes catalyzing reactions remained unknown. Herein, we employed experimental and computational tools to assess terbinafine metabolism by specific cytochrome P450 isozymes. In vitro inhibitor phenotyping studies revealed six isozymes were involved in one or more N-dealkylation pathways. CYP2C19 and 3A4 contributed to all pathways, and so, we targeted them for steady-state analyses with recombinant isozymes. N-Dealkylation yielding TBF-A directly was catalyzed by CYP2C19 and 3A4 similarly. Nevertheless, CYP2C19 was more efficient than CYP3A4 at N-demethylation and other steps leading to TBF-A. Unlike microsomal reactions, N-denaphthylation was surprisingly efficient for CYP2C19 and 3A4, which was validated by controls. CYP2C19 was the most efficient among all reactions. Nonetheless, CYP3A4 was more selective at steps leading to TBF-A, making it more effective in terbinafine bioactivation based on metabolic split ratios for competing pathways. Model predictions did not extrapolate to quantitative kinetic constants, yet some results for CYP3A4 and CYP2C19 agreed qualitatively with preferred reaction steps and pathways. Clinical data on drug interactions support the CYP3A4 role in terbinafine metabolism, while CYP2C19 remains understudied. Taken together, knowledge of P450s responsible for terbinafine metabolism and TBF-A formation provides a foundation for investigating and mitigating the impact of P450 variations in toxic risks posed to patients.
Graphical Abstract
INTRODUCTION
Lamisil (terbinafine) is an allylamine antifungal agent used for the treatment of onychomycosis.1 Patient dosing leads to drug accumulation in adipose tissue and keratin-containing tissues such as dermis, epidermis, and nails in humans.2 Terbinafine action occurs via inhibition of squalene epoxidase to disrupt cell membrane function and cell wall synthesis, leading to eventual death of the fungus.1,3 Terbinafine side effects are often minor and include mild gastrointestinal, skin, and taste disturbances.4–6 Terbinafine has been found to interact with cyclosporine, cimetidine, terfenadine, and caffeine, yet drug− drug interactions are typically minor and often asymptomatic with the exception of exceedingly rare cases of major interactions with perphenazine, amitriptyline, and theophylline often in already medically compromised patients.2,7 Given these qualities, terbinafine has proven to be much safer and more effective than other drugs prescribed for nail fungal infections such as itraconazole, fluconazole, and griseofulvin.8 In 2010, 1.5 million prescriptions for terbinafine were written in the United States, indicating its wide prevalence in use.9
Despite favorable pharmacological traits, terbinafine use can compromise hepatobiliary function, leading to idiosyncratic liver toxicity. This side effect is often asymptomatic and reversible. However, 1 in every 45,000 patients taking terbinafine develop severe symptomatic cholestatic injury that requires liver transplant or causes death.10 Periodic blood tests must be administered to patients prescribed terbinafine to ensure proper liver function and to reduce the number of severe drug reactions. Even after a compromised patient ceases therapy, terbinafine can remain at therapeutic levels in the body for up to a month due to bioaccumulation.11 This intervention strategy only minimizes liver damage severity.12
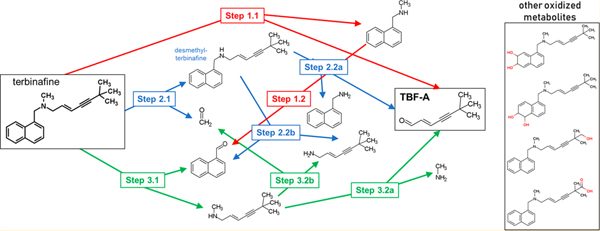
Insights on the possible cause for toxicity by formation of a reactive metabolite, TBF-A, were proposed by Iverson and Uetrecht.10,12 We identified metabolic pathways leading to and competing with TBF-A formation through a combination of computational and experimental modeling of in vitro hepatic N-dealkylation of terbinafine.13 As a tertiary amine, three N-dealkylation pathways for terbinafine lead to TBF-A formation (Figure 1). Pathway 1 (red) is a direct formation of N-methyl-1-naphthyl-methylamine and TBF-A from terbinafine. Pathway 2 (blue) involves N-demethylation of terbinafine to desmethyl-terbinafine and subsequent metabolism to TBF-A. Pathway 3 (green) involves metabolism of terbinafine to 1-naphthaldehyde and N-methyl-6,6-dimethyl-2-hepten-4-yn-1-amine and consecutive metabolism to TBF-A.13
Figure 1.
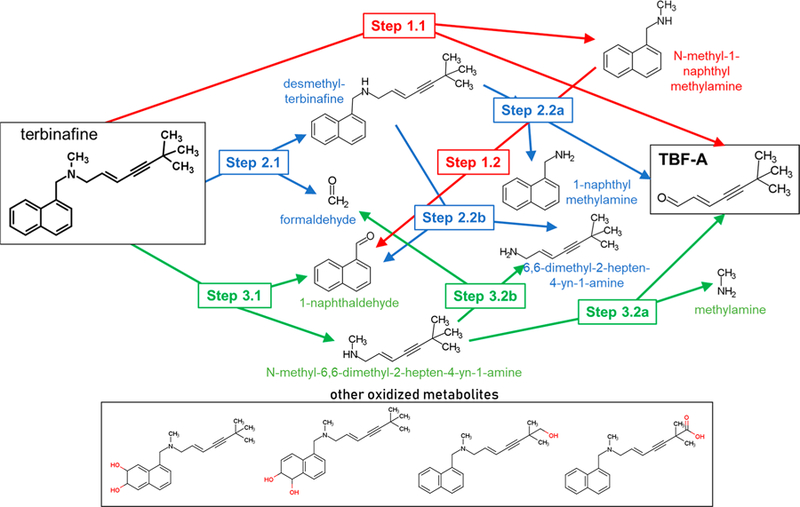
N-Dealkylation of terbinafine pathways leading to formation of reactive TBF-A. Three N-dealkylation pathways for terbinafine yield TBF-A (m/z 384, dansyl labeled). Pathway 1 (red) is a single-step pathway directly yielding TBF-A and N-methyl-1-naphthyl methylamine (m/z 405, dansyl labeled) as a co-metabolite (Step 1.1). Pathway 2 (blue) is a two-step pathway first yielding desmethyl-terbinafine (m/z 511, dansyl labeled) and formaldehyde via N-demethylation (Step 2.1), followed by the generation of 1-naphthyl methylamine (m/z 391, dansyl labeled) and TBF-A from desmethyl-terbinafine (Step 2.2a). Pathway 3 (green) is a two-step pathway first yielding 1-naphthaldehyde (m/z 404, dansyl labeled) and N-methyl-6,6-dimethyl-2-hepten-4-yn-1-amine (Step 3.1), which undergoes N-dealkylation to yield TBF-A (Step 3.2a). There are three non-N-dealkylation primary metabolites of terbinafine from alternate pathways. Hydroxyterbinafine (m/z 308) and two isomers of terbinafine dihydrodiol (m/z 326) were also observed in this study (shown in the box). Carboxyterbinafine has been reported by others, but was not observed under our steady-state conditions.15,35
In our study, we combined computational modeling and experimental in vitro studies to assess competing N-dealkylation pathways of terbinafine, leading to formation of TBF-A. First, a deep learning model of N-dealkylation predicted a high probability for N-demethylation (Pathway 2) to yield desmethyl-terbinafine, followed by N-dealkylation to TBF-A and marginal contributions from other possible pathways. Second, we carried out steady-state kinetic experiments with pooled human liver microsomes that relied on the development of labeling methods to expand metabolite characterization. Those efforts revealed high levels of TBF-A formation and first-order decay during metabolic reactions. Actual TBF-A levels would then reflect the balance between those processes as well as reflect the impact of stabilizing adduction with glutathione and other biological molecules. Modeling predictions and experimental studies agreed on the significance of N-demethylation (Pathway 2) and insignificance of N-denaphthylation (Pathway 3) in terbinafine metabolism, yet differed on importance of direct TBF-A formation (Pathway 1). Based on experimental steady-state conditions, the directpathway (Pathway 1) was the most important source of the reactive metabolite. In the clinic, therapeutic dosing leads to accumulation of desmethyl-terbinafine due to poor clearance, so likely sources for TBF-A would draw from the metabolism of both the major metabolite and parent drug based on our modeling and experimental studies.14 Vickers et al. reported that several cytochromes P450 were responsible for those pathways, yet their roles on individual pathways remain unknown.15
In this study, we assessed the metabolic kinetics for the most dominant P450 isozymes in the metabolic clearance and bioactivation of terbinafine. Initially, we carried out inhibitor phenotyping of terbinafine metabolism by pooled human liver microsomes to reveal the possible relative significance of nine P450 isozymes generating metabolites from all three N-dealkylation pathways. Those efforts revealed CYP2C19 and 3A4 were critical determinants in terbinafine metabolism, and thus we measured their steady-state kinetic mechanisms and constants for N-dealkylation pathways using recombinant P450 Supersomes. The interpretation of those results required further study to account for deviations from the expected 1:1 ratio of co-metabolites N-methyl-1-naphthyl-methylamine and TBF-A and to explain unexpectedly efficient formation of naphthaldehyde by the recombinant enzymes relative to human liver microsomes. Given this complexity, computational models may provide a more rapid approach to assessing the relative importance of P450 isozymes in terbinafine metabolism. As a complement to our experimental studies, we investigated the ability of our individual P450 isozyme models to predict the probability of competing pathways involved in metabolic clearance and bioactivation of terbinafine.16 We then compared the findings from both approaches and discussed their meaning in the context of terbinafine metabolism and bioactivation.
EXPERIMENTAL PROCEDURES
Materials.
All chemical solvents were purchased from Thermo Fisher Scientific (Waltham, MA). The substrate terbinafine hydrochloride and metabolites N-desmethyl-terbinafine hydrochloride, N-methyl-1-naphthyl methylamine hydrochloride, 1-naphthyl methylamine, naphthoic acid, and 1-napthaldehyde were purchased from Millipore-Sigma (Burlington, MA), while N-desmethyl-terbinafine hydrochloride and E-6,6-dimethylhept-2-ene-4-ynal (TBF-A) were obtained from Toronto Research Chemicals (Toronto, ON, Canada). Labeling agents dansyl chloride and dansyl hydrazine and internal standards fluoxetine hydrochloride and dimethyl benzaldehyde were purchased from Millipore-Sigma. Isozyme inhibitors α-naphthoflavone, (+)-N-3-benzylnirvanol, ketoconazole, 4-methylpyrazole hydrochloride, montelukast sodium, quinidine, sulfaphenazole, ticlopidine hydrochloride, and tranylcypromine sulfate were also purchased from Millipore-Sigma. Lastly, recombinant Supersomes CYP2C19 and 3A4 were purchased from Corning (Woburn, MA).
P450 Isozyme Inhibitor Phenotyping Assays.
We carried out inhibitor phenotyping experiments to qualitatively identify probable P450 isozymes catalyzing terbinafine metabolic pathways present in our original pooled human liver microsomes studies.13 Reactions contained 0.1 mg/mL protein (HLM150), 200 μM terbinafine or desmethyl-terbinafine, specific P450 inhibitors, and 2.5% (final) methanol co-solvent due to solubility limits of the substrate in 50 mM potassium phosphate buffer, pH 7.4. The choice and concentration of inhibitors were based on existing literature demonstrating selective bias, if not exclusivity, in inhibiting specific P450 isozymes. For each experiment, we included the following as final concentrations: 16 μM α-naphthoflavone (ANF) for CYP1A2,17 2 μM tranylcypromine (TCP) for CYP2A6, 3 μM ticlopidine (TIC) for CYP2B6,18,19 16 μM montelukast (MTK) for CYP2C8,20 10 μM sulfaphenazole (SPA) for CYP2C9, 16 μM (+)-N-3-benzylnirvanol (BZV) for CYP2C19, 2 μM quinidine (QND) for CYP2D6, 30 μM 4-methylpyrazole (4MP) for CYP2E1, and 1 μM ketoconazole (KCZ) for CYP3A4.18,19,21 Each inhibitor solution was prepared in potassium phosphate buffer pH 7.4 with 1% methanol (final) as a co-solvent, so that the contribution of methanol from the inhibitor solution was insignificant (<0.1%).
After 15 min pre-incubation with shaking at 37 °C, reactions were initiated by addition of an NADPH regenerating system (2 μU/μL 1-glucose-6 phosphate dehydrogenase, 10 mM glucose 6-phosphate, 2 mM MgCl2, 500 μM NADP+) and shaken at 37 °C. Reactions lacking the NADPH regenerating system served as negative controls for metabolite background signals. After 20 min, the reactions were quenched with an 8-fold volume of an ice-cold acetonitrile solution containing 200 μM fluoxetine and 0.5 μM dimethyl benzaldehyde (internal amine and aldehyde standards) and incubated on ice for 5 min to promote protein and phosphate buffer precipitation.22 Quenched reactions were centrifuged for 15 min at 4 °C and 2500 rpm (2800G) using a Beckman GPR centrifuge. The supernatant was transferred to a microplate and labeled with dansyl hydrazine or dansyl chloride to improve the metabolite stability and detectability, as described previously by our group.13 Once complete, labeling reactions were evaporated to dryness and resuspended in a mobile phase for UHPLC-MS analysis.
Each set of reactions was conducted in triplicate and repeated two to four times. After correcting for the background, the resultant values were normalized to reaction rates observed in absence of inhibitors to yield a percent inhibition value. Statistically different normalized rates due to the presence of P450-specific inhibitors were determined by the Mann−Whitney test (p-value = 0.05) using GraphPad Prism 7.0 from GraphPad Software, Inc. (San Diego, CA).
Steady-State Terbinafine Kinetics by Recombinant CYP2C19 and 3A4.
Based on inhibitor phenotyping results, CYP2C19 and 3A4 were likely important contributors to the generation of reactive metabolites and overall clearance in all three N-dealkylation pathways, we determined the kinetic mechanisms and constants for recombinant forms of the isozymes. The experimental design for the recombinant enzyme reactions was similar to that used for HLM studies. Reactions initially contained 100 nM P450 Supersomes, terbinafine ranging from 3.125 to 500 μM, and 2.5% methanol (final) co-solvent due to solubility limits of terbinafine in 50 mM potassium phosphate buffer, pH 7.4. After 15 min pre-incubation with shaking, the reactions were initiated upon addition of an NADPH regenerating system and shaken. After 30 min, the reactions were quenched, processed, and analyzed by UHPLC-MS, as previously described. The reactions lacking the NADPH regenerating system were prepared and used as negative controls. All steady-state reactions were performed in triplicate, and each set was replicated two to four times. After correcting for the background, initial rates were calculated and plotted against substrate concentration. The data in the resultant kinetic profiles were then fit to the Michaelis−Menten and Hill equations and the most statistically probable mechanism determined by the extra sum-of-squares F test to yield the best-fit kinetic constants using GraphPad Prism 7.0 from GraphPad Software, Inc. (San Diego, CA). Similar steady-state studies were carried out for the secondary metabolites N-methyl-1-naphthyl methylamine and desmethyl-terbinafine to aid in the interpretation of the results for terbinafine metabolism by CYP2C19 and 3A4.
UHPLC-MS Analysis of Metabolic Reactions.
For reaction analyses, we compared and relied on the co-elution with authentic standards, fragmentation patterns, and mass spectral response for LC-MS analysis to identify, resolve, and quantitate analytes based on a mass to charge ratio (m/z) as described previously by our group.13 Reaction metabolites were separated using a Cortecs C-18 2.7 μm column (4.6 × 50 mm) on a Waters Acquity Arc UHPLC system connected to a Waters Acquity QDa single quadrupole MS system with a 20 V cone voltage setting to detect masses from 150 to 650 in positive ion mode (Milford, MA). The total flow rate was 0.5 mL/min, and the run time was 15 min. The mobile phase comprised of two solvents: ultrapure water with 0.01% formic acid (solvent A) and acetonitrile with 0.01% formic acid (solvent B). The gradient method began at 65% solvent A for 1 min, decreased to 20% over 5 min, and then maintained at 20% for 2 min. Solvent A was increased back to 65% over 1 min and was maintained for the remainder of run. Peak areas of analytes were normalized to internal standards and when available, quantitated relative to authentic metabolite standards after correction with negative control reactions lacking NADPH. Serial dilution standard curves were used for quantitation of analytes.
A second set of 500 μM terbinafine reactions by CYP2C19 and CYP3A4 were conducted to confirm the identity of TBF-A by LC-MS/MS. Samples were prepared as previously described and injected into an Agilent Technologies 1290 Infinity UHPLC. Analytes were then resolved with an InfinityLab Poroshell 120 EC-C18 2.7 μm column (2.1 × 150 mm). The mobile phase (solvents A and B) was the same from the previously described UHPLC-MS method, but at a flow of 0.35 mL/min and using a different gradient. The gradient began at 40% solvent B for 1 min, increased to 100% solvent B over 9 min, and was then held at 100% B for 1 min before returning to 40% solvent B over a 1 min period. Analytes were scanned with an Agilent Technologic 6490 Triple Quad MS. The ESI source was in positive ion mode, and ion spectra were acquired in full ion mode monitoring an m/z range of 50−1000 Da. Product ion spectra were produced by collision-induced dissociation at 20 eV from the theoretical precursor m/z 384 Da.
Assessment of Competing N-Dealkylation Reactions during Terbinafine Metabolism.
We previously developed studies and further elaborate here a novel strategy to qualitatively determine preferences for specific metabolic pathways relative to one another based on either experimental kinetic studies or modeling outputs for CYP2C19 and 3A4.13 Like metabolic flux studies,23–25 we calculated a metabolic split ratio using the reaction rates at each nodal point of a metabolic pathway to describe the partitioning of metabolites. For the experimental data, the Michaelis−Menten equation describes the observed turnover rate for the reaction. In our case, we limited conditions to a low substrate concentration, so that the observed rate simplifies to Vmax[S]/Km, wherein S denotes substrate. This condition is reasonable for terbinafine given its reported low plasma levels (1 mg/L) and high (>99%) protein binding.26,27 We then calculated metabolic split ratios by dividing the rate of the reaction by the sum of all rates at that nodal point in the pathway. The substrate concentration is the same for the reactions and thus factors out of the equation, making it independent of concentration. The metabolic split ratio is then a ratio of the catalytic efficiency of each reaction over the sum of catalytic efficiencies for all reactions. This calculation holds true as long as the substrate concentration is low enough to make the observed rates linearly dependent on the substrate concentration. By contrast, the model predictions are not rates, and there is no evidence that they correlate with the reaction rates. The model outputs reflect the likelihood for a reaction to occur and so we used the values to calculate analogous model split ratios for competing reactions. In this case, the ratio for a reaction is the corresponding prediction divided by the sum of all reaction predictions for the substrate of interest. We then multiplied the metabolic split ratios from the experimental data or the model split ratios from the modeling data for each pathway to yield the fraction of the parent drug, leading to formation of a specific metabolite like TBF-A. This fractional yield for a common metabolite through different pathways will not sum to 1.0 due to pathway branches and will only reflect pathways of interest, such as N-dealkylations. Nevertheless, through this approach, we were able to directly compare the relative significance of single and multistep pathways toward formation of a common metabolite as well as the performance of the model predictions against experimental studies.
RESULTS
CYP2C19 and 3A4 Catalyzed All N-Dealkylation Pathways Based on Microsomal Inhibitor Phenotyping.
Inhibitor phenotyping experiments suggested that multiple P450 isozymes catalyzed N-dealkylation in all three pathways, though metabolism was seemingly less specific in Pathway 3, as evidenced by lower degrees of inhibition following the introduction of single P450-specific inhibitors (Figure 1). TBF-A and N-methyl-1-naphthyl methylamine are co-metabolites in Pathway 1, and their formation generally yielded similar inhibition patterns via possible major catalysts CYP1A2, 2C9, 2C19, 2D6, and 3A4 (Figure 2A,B, respectively). N-Demethylation of terbinafine in Pathway 2 was likely catalyzed by CYP1A2, 2C8, 2C9, 2C19, 2D6, and 3A4 with minor contributions from 2B6 (Figure 2, Panel C). Pathway 3 was the least affected by the inhibitors with only CYP2A6, 2C19, and 3A4 implicated in the formation of 1-naphthaldehyde during terbinafine metabolism (Figure 2D). Given the weak inhibition, we combined inhibitors for CYP2C19 and 3A4 to demonstrate additivity and thus confirm their collective contribution to this reaction step. Formation of terbinafine dihydrodiols is a multistep process that relied on contributions from several enzymes including CYP1A2, 2A6, 2B6, 2C9, 2C19, 2D6, 2E1, and 3A4, although their roles in specific metabolic steps remain unclear (Figure S1A). Comparatively, fewer enzymes, namely CYP2A6, 2B6, 2C19, and 2E1, generated hydroxyterbinafine (Figure S2B). As a major in vivo metabolite, we extended phenotyping studies to desmethyl-terbinafine metabolism and revealed that a loss of the methyl group decreased the number of P450 isozymes involved in metabolism. CYP2A6, 2B6, 2C8, 2C19, and 3A4 catalyzed the TBF-A formation from desmethyl-terbinafine in Step 2.2a, while CYP1A2, 2C9, 2D6, and 2E1 did not (Figure S2A). N-denaphthylation (Pathway 3) was again carried out only by CYP2C19 and 3A4 (Figure S2B).
Figure 2.
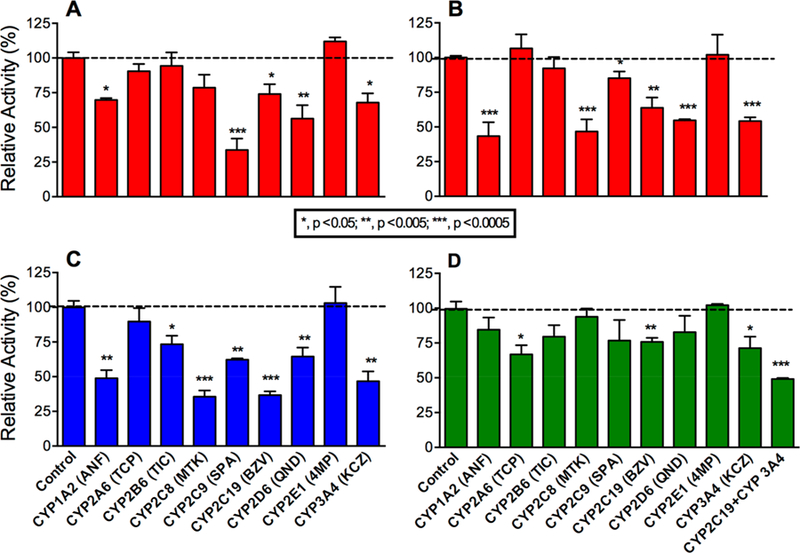
Inhibitor phenotyping of terbinafine metabolism by human liver microsomes. As described in Experimental Procedures, terbinafine (200 μM) metabolism to TBF-A (A) and the co-metabolite N-methyl-1-naphthyl methylamine (B) from Pathway 1.1, desmethyl-terbinafine (C) from Pathway 2.1, and 1-naphthaldehyde (D) from Pathway 3.1 was blocked by P450-specific inhibitors. All other potential metabolites for these reactions were not detected consistently or at all. Error bars denote standard deviations. Inhibitors used are as follows: 16 μM α-naphthoflavone (ANF) for CYP1A2, 2 μM tranylcypromine (TCP) for CYP2A6, 3 μM ticlopidine (TIC) for CYP2B6, 16 μM montelukast (MTK) for CYP2C8, 10 μM sulfaphenazole (SPA) for CYP2C9, 16 μM (+)-N-3-benzylnirvanol (BZV) for CYP2C19, 2 μM quinidine (QND) for CYP2D6, 30 μM 4-methylpyrazole (4MP) for CYP2E1, and 1 μM ketoconazole (KCZ) for CYP3A4 as well as a combined 16 μM (+)-N-3-benzylnirvanol and 1 μM ketoconazole for the 1-naphthaldehyde reaction. A total of 9−15 experimental reactions were carried out for these studies.
Though not the primary focus of this work, formation of desmethyl-terbinafine dihydrodiols and hydroxydesmethyl-terbinafine was also measured (Figure S2). Although effects were limited to <25% inhibition, studies demonstrated CYP1A2, 2B6, 2C8, 2C9, 2C19, 2D6, and 3A4 generated desmethyl-terbinafine dihydrodiols. The production of hydrox-ydesmethyl-terbinafine was catalyzed by CYP1A2, 2A6, 2B6, 2C8, 2C19, and 3A4. Compared to terbinafine phenotyping results, loss of the N-methyl group decreased enzymatic specificity in the formation of both hydroxy- and dihydrodiol oxidative products (Figure S2C,D). Based on inhibitor phenotyping, CYP2C19 and 3A4 contributed to all three N-dealkylation pathways and thus likely play important roles in the formation of TBF-A as well as the overall clearance of terbinafine.
N-Dealkylation in Pathway 1 Was Similarly Catalyzed by CYP2C19 and 3A4 Supersomal Systems.
To further assess the responsible P450s in terbinafine metabolism to TBF-A, we utilized recombinant P450 Supersomes to conduct steady-state kinetic studies and elucidate individual P450 catalytic efficiencies. For Pathway 1, TBF-A and N-methyl-1-naphthyl methylamine are formed at a 1:1 ratio, yet the decay of TBF-A during the course of the reaction makes the results for N-methyl-1-naphthyl methylamine a more reliable reflection of the kinetics for this pathway.13 CYP2C19 and CYP3A4 shared similar Vmax and Km values for N-methyl-1-naphthyl methylamine; however, slight differences led to CYP3A4 catalyzing the reaction with an almost 2-fold higher efficiency (Vmax/Km) (Figure 3A; Tables 1 and 2). Secondarily, reactions were conducted similarly for N-methyl-1-naphthyl methylamine metabolism to 1-naphthaldehyde as a measure of Pathway 1.2. CYP3A4 was found to be 4-fold more catalytically efficient than CYP2C19 (Figure 3B).
Figure 3.
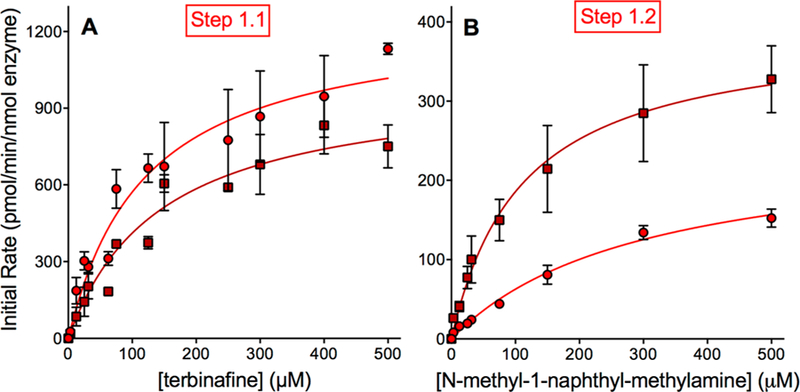
Steady-state kinetic profiles for terbinafine N-dealkylation in Pathway 1. CYP2C19 (○) and 3A4 (□) metabolism of terbinafine yielded kinetics for N-methyl-1-naphthyl methylamine (A) and TBF-A (not shown, see Results) in Pathway 1, as shown in Figure 1. The subsequent N-denaphthylation of N-methyl-1-naphthyl methylamine yielded kinetic profiles in (B). The sets of data were fit best to the Michaelis−Menten equation (p < 0.05), and the corresponding constants reported in Tables 1 and 2. A total of 12 experimental reactions were carried out for these studies. Error bars denote the standard deviations. Reaction conditions and data analyses were carried out as described in Experimental Procedures.
Table 1.
Michaelis–Menten Kinetic Constants for Terbinafine N-Dealkylation Pathways by CYP2C19a
| Steady-state kinetic constants for individual metabolitesc | |||||
|---|---|---|---|---|---|
| pathway | step | substrate | Vmax b | Km (μM) | V/K |
| pathway 1 | 1.1 | terbinafine | N-methyl-1-naphthyl-methylamine | ||
| 1300 ± 83 | 120 ± 22 | 11 | |||
| 1.2 | N-methyl-1-naphthyl methylamine | 1-napthaldehyde | |||
| 250 ± 17 | 300 ± 41 | 0.83 | |||
| pathway 2 | 2.1 | terbinafine | desmethyl-terbinafine | ||
| 4300 ± 190 | 37 ± 6.7 | 120 | |||
| 2.2a | desmethyl-terbinafine | 1-naphthyl-methylamine | |||
| 810 ± 92 | 220 ± 55 | 3.7 | |||
| 2.2b | desmethyl-terbinafine | 1-naphthaldehyde | |||
| 1300 ± 59 | 150 ± 58 | 8.7 | |||
| pathway 3d,e | 3.1 | terbinafine | 1-naphthaldehyde | ||
| 410 ± 14 | 3.0 ± 0.83 | 140 | |||
Data fit best to the Michaelis–Menten equation over the Hill equation (P < 0.05) shown in Figures 3, 4, and 5. Values shown with standard deviations.
Units are pmol/min/nmol of protein.
Quantitation of TBF-A catalytic efficiency was not possible due to variable Vmax values, while Km values were consistent.
Pathway Step 3.2 was not studied due to the absence of authentic standards and low efficiency of the previous step in a human liver microsomal enzymatic system that obviates the significance of this pathway for TBF-A.
Limit of quantitation was calculated as the standard deviation of response divided by the slope of the standard curve.
Table 2.
Michaelis–Menten Kinetic Constants for Terbinafine N-Dealkylation Pathways by CYP3A4a
| steady-state kinetic constants for individual metabolitesc | |||||
|---|---|---|---|---|---|
| pathway | step | substrate | Vmax b | Km (μM) | V/K |
| pathway 1 | 1.1 | terbinafine | N-methyl-1-naphthyl-methylamine | ||
| 1000 ± 65 | 150 ± 25 | 6.7 | |||
| 1.2 | N-methyl-1-naphthyl methylamine | 1-napthaldehyde | |||
| 390 ± 28 | 110 ± 22 | 3.5 | |||
| pathway 2 | 2.1 | terbinafine | desmethyl-terbinafine | ||
| 1300 ± 63 | 86 ± 13 | 15 | |||
| 2.2a | desmethyl-terbinafine | 1-naphthyl-methylamine | |||
| 570 ± 44 | 410 ± 54 | 1.4 | |||
| 2.2b | desmethyl-terbinafine | 1-naphthaldehyde | |||
| 5900 ± 430 | 520 ± 63 | 11 | |||
| pathway 3d,e | 3.1 | terbinafine | 1-naphthaldehyde | ||
| 5700 ± 190 | 110 ± 11 | 52 | |||
Data fit best to the Michaelis–Menten equation over the Hill equation (P < 0.05) shown in Figures 3, 4, and 5. Values shown with standard deviations.
Units are pmol/min/nmol of protein.
Quantitation of TBF-A catalytic efficiency was not possible due to variable Vmax values, while the Km values were consistent.
Pathway Step 3.2 was not studied due to the absence of authentic standards and low efficiency of the previous step in a human liver microsomal enzymatic system that obviates the significance of this pathway for TBF-A.
Limit of quantitation was calculated as the standard deviation of response divided by the slope of the standard curve.
Unlike N-methyl-1-naphthyl methylamine, the TBF-A co-metabolite kinetics yielded similar Km but not Vmax values among data sets for each P450 isozyme, which implied further unreliability of direct TBF-A quantification as evidenced previously.13 This problem was only observed for Supersomes and not human liver microsomes, and so we investigated the impact of enzyme source on the observed TBF-A levels. We conducted time-course decay experiments for 50 μM TBF-A in HLM, control Supersomes, and isozyme Supersomes. When compared to controls, the TBF-A decay was 13% and 55% faster in HLM when normalized per mg/protein and compared to CYP2C19 and CYP3A4 Supersomes, respectively. The end-point plateau of CYP2C19 was roughly 2-fold higher than the end-point plateaus for both HLM and control Supersomes (Figure S3A,B). The end-point plateau for CYP3A4 was nearly 4-fold higher than that of HLM but was not statistically different to the control Supersomes. These differences were statistically analyzed and confirmed as significant via a comparison of plateau and half-life 95% confidence intervals for each enzymatic environment. The findings suggest higher TBF-A apparent rates of formation during the reaction would be more likely observed with Supersomes versus microsomes.
Alternatively, parent m/z may not directly correlate with actual co-metabolite levels. As a test, we carried out an activity assay for each isozyme using 500 μM terbinafine and assessed the observed initial rates based on either parent m/z or characteristic mass transition for loss of the dansyl group (236 Da) by UHPLC-MS/MS. The observed rates for both isozyme reactions showed significant variability in responses for TBF-A from different LC-MS instruments and choice of spectral responses (fragment m/z versus the parent m/z) (Figure S4A,B). The UHPLC-MS instrument yielded 4-fold lower responses when compared to the UHPLC-MS/MS. In the latter case, the parent to fragment response was 14-fold higher for the CYP2C19 reaction while only 11-fold higher for the CYP3A4 reaction. By contrast, the instrument choice or spectral response did not impact observed rates for N-methyl-1-naphthyl methylamine. Moreover, there was little to no background signal for N-methyl-1-naphthyl methylamine in all reactions based on similarity in signal responses (Figure S4C,D). Though the decay of TBF-A and instrument choice seemed to play a role in detection of the metabolite, we were unable to resolve why its quantitation was highly variable compared to its co-metabolite. Taken together, kinetic data based on N-methyl-1-naphthyl methylamine would be a more accurate indicator of kinetics for Pathway 1.
CYP2C19 Was More Efficient Than CYP3A4 at All Reaction Steps in Pathway 2.
TBF-A formation through Pathway 2 involves a two-step process whereby CYP2C19 predominated over CYP3A4. CYP2C19 was 8-fold more efficient than CYP3A4 at N-demethylation of terbinafine due to a combination of a higher Vmax and lower Km. (Figure 4A; Tables 1 and 2). Loss of the parent drug N-methyl group significantly impacted the relative kinetics of the reactions for each P450 isozyme and between them (Figure 4B,C; Tables 1 and 2). N-Denaphthylation of desmethyl-terbinafine by CYP2C19 demonstrated a nearly 3-fold higher rate of turnover (Vmax) than for the parent drug. For CYP3A4, the desmethyl-terbinafine Vmax was about 2-fold less than the reaction for terbinafine. The CYP2C19 Km for desmethyl-terbinafine was relatively low but still about 5-fold higher than the value observed for terbinafine N-denaphthylation (Pathway 3). The loss of the N-methyl group led to a lower affinity for desmethyl-terbinafine based on a 3-fold higher Km than that for terbinafine. Collectively, desmethyl-terbinafine kinetics yielding 1-napthaldehyde showed that CYP2C19 and CYP3A4 were similarly efficient as determined by catalytic efficiency ratios (Vmax/Km). As previously shown in terbinafine reactions, TBFA kinetic profiles were not reliable when compared to formation of its co-metabolite, that is, 1-naphthyl methylamine. The efficiency of 1-naphthyl methylamine formation in Pathway 2.2a by CYP2C19 was about 3-fold higher than that for 3A4, while CYP3A4 and CYP2C19 efficiencies for 1-naphthaldehyde generation via Pathway 2.2b were comparable. Taken together, CYP2C19 more efficiently catalyzes the first step in the pathway, while CYP2C19 and 3A4 compete almost equally for the generation of TBF-A, as measured by 1-naphthyl methylamine kinetics or 1-naphthaldehyde generation by CYP3A4.
Figure 4.
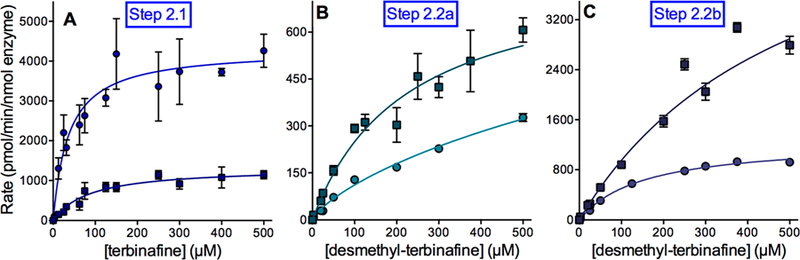
Steady state kinetic profiles for terbinafine N-dealkylation in Pathway 2. CYP2C19 (○) and 3A4 (□) metabolism of terbinafine yielded kinetics for desmethyl-terbinafine (A) for the Step 2.1 in Pathway 2 (Figure 1). This metabolite was then used as a substrate to measure the kinetics for naphthyl methylamine (B) and TBF-A (not shown, see Results) for Step 2.2a and 1-naphthaldehyde for Step 2.2b (C), as shown in Figure 1. The sets of data were fit best to the Michaelis−Menten equation (p < 0.05), and the corresponding constants are reported in Tables 1 and 2. A total of 12 experimental reactions were carried out with terbinafine or desmethyl-terbinafine as the substrate. Error bars denote standard deviations. Reaction conditions and data analyses were carried out as described in Experimental Procedures.
N-Denaphthylation for Pathway 3 Was Surprisingly Efficient for CYP2C19 and 3A4.
Unlike microsomal metabolism of terbinafine,13 1-naphthaldehyde was a major metabolite generated by both P450 isozymes in Pathway 3 (Figure 5). CYP2C19 demonstrated a moderate Vmax for this N-dealkylation (Pathway 1) step, but the lowest Km in this study, resulting in the most efficient reaction. By comparison, CYP3A4 catalyzed N-denaphthylation (Pathway 3) with a >10-fold rate of turnover. Nevertheless, when combined with a higher Km value, the efficiency (Vmax/Km) was 3-fold less than that observed for CYP2C19. The kinetics indicate Pathway 3 as one of the most efficient pathways catalyzed by these P450 isozymes. The resulting metabolite N-methyl-6,6-dimethyl-hept-2-ene-4-ynal is not commercially available, and thus we were not able to determine kinetics for the secondary reaction steps in Pathway 3 yielding TBF-A. In fact, CYP2C19 and 3A4 efficiencies for N-denaphthylation were much higher than that observed for human liver microsomes in which Pathway 3 was the least efficient among the three metabolic pathways.13
Figure 5.
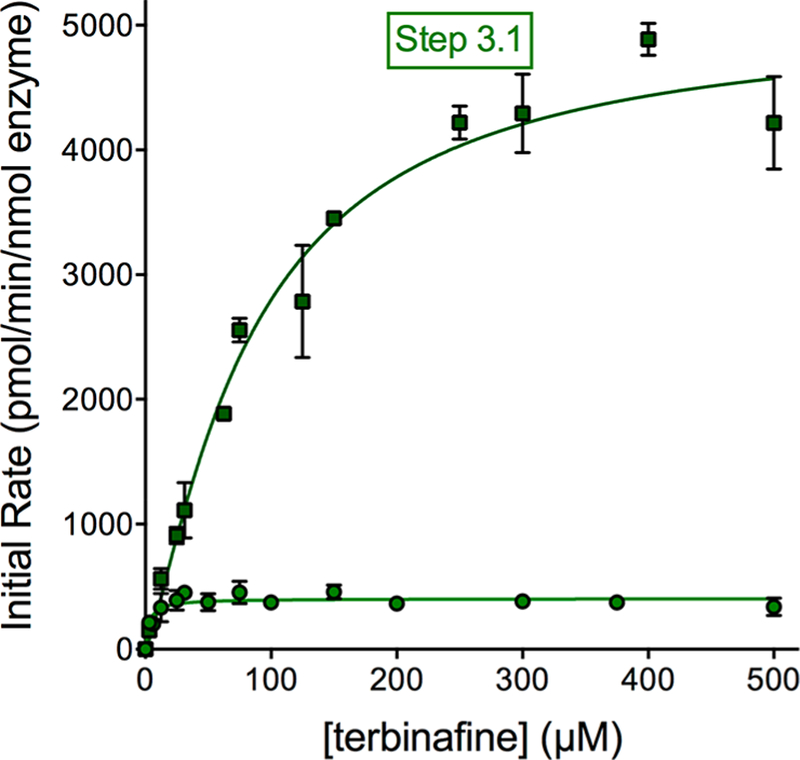
Steady-state kinetic profiles for terbinafine N-dealkylation in Pathway 3. CYP2C19 (○) and 3A4 (□) metabolism of terbinafine yielded kinetics for 1-naphthaldehyde in Pathway 3, as shown in Figure 1. The sets of data were fit best to the Michaelis−Menten equation (p < 0.05), and the corresponding constants reported in Tables 1 and 2. A total of 12 experimental reactions were carried out with terbinafine as substrate. Error bars denote the standard deviations. Reaction conditions and data analyses were carried out as described in Experimental Procedures.
We then carried out further studies to validate that the high efficiencies for 1-naphthaldehyde formation were not a reflection of the secondary metabolic processes despite the use of steady-state conditions. Human liver microsomes may selectively metabolize 1-naphthaldehyde to decrease its apparent kinetics so that they are underestimated relative to those for Supersomes. The incubation of 50 μM 1-naphthaldehyde under reaction conditions lead to a steady rate decay or disappearance, but it was not significantly affected by active or heat-inactivated human liver microsomes or the presence or absence of NADPH, suggesting a possible limited evaporative loss for the microsomal reactions (Figure S5). We then compared depletion of 10 and 50 μM 1-naphthaldehyde in the presence of NADPH with either human liver microsomes or Supersomes for CYP2C19 and 3A4 and found that Supersome reactions led to a more significant decrease in 1-naphthaldehyde after 30 min (Figure S6). Supersome-mediated decay of 1-naphthaldehyde could be inhibited by terbinafine (Figure S7) and required NADPH as well as active (not heat-treated) enzyme preparations (Figure S8). Despite evidence for 1-naphthaldehyde metabolism, the analysis of all reactions by HPLC-MS in positive and negative ion modes did not yield detectable levels of 1-naphthol, 1-naphthoic acid, or the dihydrodiol of 1-naphthaldehyde as possible reaction metabolites. Rather than human liver microsomes, Supersomes were more prone to inducing 1-naphthaldehyde decay, which likely involved an NADPH-dependent enzyme. This observation is apparently due to preparatory differences between the two enzymatic systems, but could not be resolved in this study. For steady-state studies, 1-naphthaldehyde decay would have minimal effect due to reaction inefficiency and ability of terbinafine to outcompete the aldehyde during metabolism. Moreover, results gained from microsomal studies are more relevant in apparent formation rates of 1-naphthaldehyde, given that microsomal systems are more reflective of liver metabolism.
In addition, we explored whether alternate secondary metabolic pathways yielding 1-naphthaldehyde may contribute to the apparent kinetics of Supersomes but not microsomes, leading to overestimation of Pathway 3 kinetics. We determined the N-denaphthylation steady-state kinetics for N-methyl-1-naphthyl methylamine in Pathway 1 and desmeth-yl-terbinafine in Pathway 2 for CYP2C19 and 3A4 (Figures 3B and 4C; Tables 1 and 2), yet the reactions were too inefficient to contribute to the apparent kinetics for 1-naphthaldehyde from terbinafine metabolism. Taken together, the more efficient 1-naphthaldehyde kinetics for CYP2C19 and 3A4 versus human liver microsomes are not due to a loss of the metabolite in the microsomal reactions or formation from alternate pathways in Supersome reactions.
Deep Learning Models Predicted N-Dealkylations of Terbinafine by CYP2C19 and 3A4.
As an alternate, more rapid approach to gaining insights on metabolism, we explored the potential for our CYP2C19 and 3A4 models to predict N-dealkylation pathways (Figure 6). These models are freely available for use at http://swami.wustl.edu/xenosite/. For each P450 isozyme, the model predicts molecular sites-of-metabolism established with a test set of 680 known P450 substrates across nine isozymes and assigns each atom a score from 0 to 1.0. Based upon a cutoff score of 0.5, the model has an average correct compound bioactivation output of 87% across the incorporated P450 isozymes and human liver microsomes. This prediction is not a probability, but an unscaled likelihood for reaction occurrence.16 Generally, model bioactivation likelihoods were higher at less sterically hindered atoms and at atoms further from electron-withdrawing groups, which agrees with established trends of chemical reactivity (Figure 6). A statistical analysis of significant differences among values was then not possible; rather, variations in predictions provide a qualitative analysis of patterns favoring reaction steps relative to one another for the two P450 isozymes (Figure 7). For CYP2C19, the likelihood for direct TBF-A formation in Pathway 1 was very low compared to the first step in the other two pathways subsequently leading to the reactive metabolite. Despite relative ease in N-demethylation, there was no improvement in the possibility of TBF-A formation for Pathway 2. By contrast, the loss of 1-naphthaldehyde in Pathway 3 did increase the likelihood for generation of TBF-A during metabolism. This pattern for the metabolic pathway predictions was essentially identical for CYP3A4. Taken together, models for CYP2C19 and 3A4 predicted similar metabolic patterns for each reaction by the isozymes in contrast to the experimental data.
Figure 6.
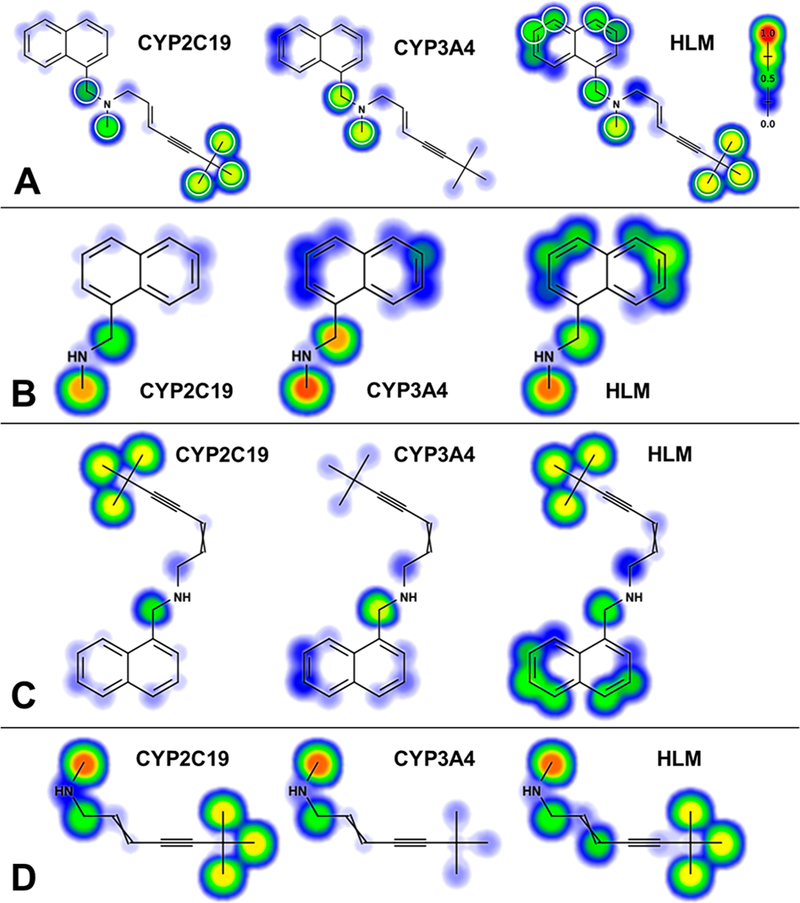
Representative model outputs for metabolism of terbinafine and its metabolites. Deep learning neural network models for CYP2C19 and 3A4 as well as human liver microsomes (HLM) predicted the likelihood for metabolism at each atom of terbinafine (A) and its downstream metabolites N-methyl-1-naphthyl methylamine (pathway 1, (B)), desmethyl-terbinafine (pathway 2, (C)), and N-methyl-6,6-dimethyl-2-hepten-4-yn-1-amine (pathway 3, (D)).16,36 Predictions were scaled from 0 to 1.0 and colored from blue (cold) to red (hot), respectively. Targeted sites for metabolism would lead to the formation of N-dealkylated metabolites such as aldehydes and amines, as well as oxidized, nondealkylated metabolites like terbinafine dihydrodiols and hydroxyterbinafine.
Figure 7.
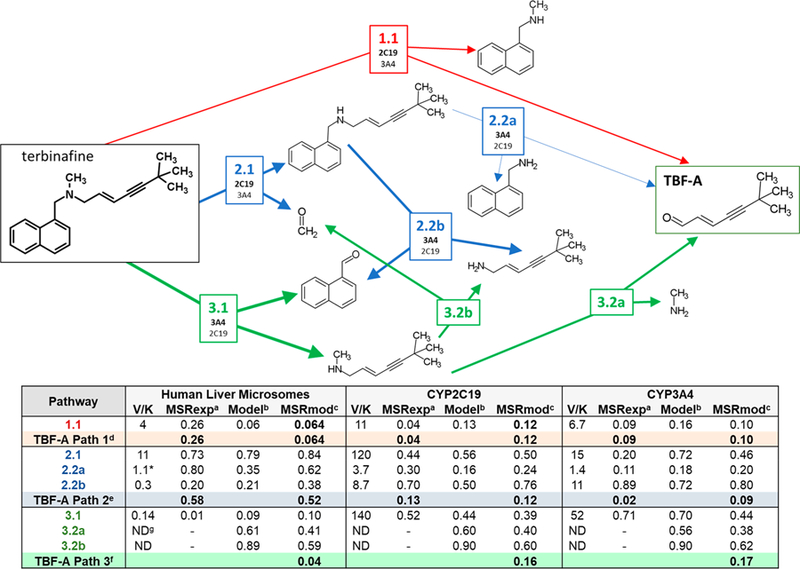
Relative significance of individual reaction steps and N-dealkylation pathways leading to TBF-A. Reaction steps are labeled by pathway number, reaction number, and branch designation, for example, 2.2a. The table lists information gained from experimental and computational modeling studies including experimentally measured catalytic efficiencies (Vmax/Km), modeled reaction predictions, and metabolic split ratios for each reaction step. As discussed in Experimental Procedures, ratios based on experimental Supersomal and human liver microsomal data13 were calculated using rates under conditions at low substrate concentrations so that they were defined by the catalytic efficiency of the reaction. The multiplication of the metabolic split ratios at each step of the pathway then reflected the quantitative fractional conversion of terbinafine into the reactive TBF-A metabolite. Although not rates, model predictions reflected the relative likelihood for the reaction to occur, and so, we applied a similar analysis to determine model split ratios for competing reactions and assess the qualitative preference for competing pathways. Table footnotes: (a) Metabolic split ratio derived from catalytic (experimental) efficiency values; (b) numerical score produced by computational model; (c) model split ratio derived from computational model scores; (d) denotes formation of TBF-A through pathway 1.1; (e) denotes formation of TBF-A through pathways 2.1 and 2.2a; (f) denotes formation of TBF-A through pathways 3.1 and 3.2a; (g) denotes “not determined”.
Catalytic Capacities of CYP2C19 and 3A4 Favored Different Pathways to TBF-A.
We calculated metabolic split ratios from experimental data and leveraged them to determine the fraction of the parent drug leading to the formation of TBF-A at low terbinafine levels (Figure 7). For the experimental studies, we were limited to determining the fractional yields of TBF-A through Pathways 1 and 2 due to the inability to measure kinetics for the second step in Pathway 3. For CYP2C19, direct formation of TBF-A in Pathway 1 was more than 2-fold more productive than Pathway 2 despite a highly efficient first step in that pathway. By contrast, CYP3A4 was 3-fold more effective at generating TBF-A from Pathway 2 than from Pathway 1. Moreover, CYP3A4 was less efficient at pathways competing with the formation of TBF-A such that the isozyme yielded higher fractional conversions of terbinafine to TBF-A than CYP2C19 for Pathways 1 and 2. A potential caveat for this outcome is the impact of the reaction conditions on CYP2C19 activity; the relatively high level of methanol necessary for solubilizing terbinafine (2.5% final) may have suppressed CYP2C19 activity relative to that for CYP3A4.28
Although not rates, the model predictions reflected the relative likelihood for the reaction to occur and thus may be amenable to a similar analysis using model split ratios to assess the relative preference for competing pathways. Unlike experimental studies, modeling studies were able to predict fractional TBF-A yields from terbinafine for all three N-dealkylation pathways. For CYP2C19, there was no difference in the TBF-A yield between Pathways 1 and 2, while Pathway 3 was 2-fold more favorable for TBF-A formation than the other pathways. The CYP3A4 model predicted similar amounts of TBF-A generated through Pathways 1 and 2, but a 6-fold higher preference for TBF-A from Pathway 3. Taken together, the models did not predict the isozyme-specific differences in TBF-A formation for Pathways 1 and 2 based on experimental data, yet they provided an intriguing, but experimentally untestable, prediction that Pathway 3 is the most productive route to the formation of the reactive metabolite.
Recombinant CYP2C19 and 3A4 Catalyze Oxidative Nondealkylation Reactions.
Although not the focus on this study, we were able to gain information on the role of CYP2C19 and 3A4 in other oxidation pathways, namely, the formation of hydroxyterbinafine and a pair of dihydrodiols (Figure 1) through experimental and computational studies. Nevertheless, the lack of standards for quantitation permitted only the identification of the metabolic mechanism, insights on binding interactions, and relative Vmax values and efficiencies for the reactions. CYP2C19 and 3A4 oxidation of the naphthyl group or alkyl terminus for terbinafine led to cooperative mechanisms (Figures S9A−D and S10 and Tables S2 and S3). CYP2C19 formation of the dihydrodiols involved negative cooperativity, while that of hydroxyterbinafine involved positive cooperativity. By contrast, CYP3A4 demonstrated positive cooperativity for both terbinafine reactions. For both isozymes, a loss of the methyl group on the substrate favored the Michaelis−Menten kinetic mechanism for all oxidative nondealkylations of desmethyl-terbinafine. The CYP2C19 and 3A4 affinities for the parent drug and major metabolite based on Km were relatively moderate (<∼100 μM). Formation of the dihydrodiols involves oxidation at two sites on the naphthyl moiety and based on the CYP2C19 and 3A4 models, the likelihood for those reactions was very low (mostly ≤0.1 with some ≤0.29). By contrast, the CYP2C19 model predicted a high likelihood for oxidation of one of the methyl groups (≥0.72), while the prediction of CYP3A4 was very low (≤0.08). Collectively, these data provided an opportunity to assess structure−function relationships for the two isozymes from experimental data and model performance for those findings.
Both isozymes oxidized the parent drug and major metabolite at the alkyl terminus and the naphthyl moiety, suggesting terbinafine and desmethyl-terbinafine bind in two opposing orientations relative to the active heme. The CYP2C19 Vmax was slightly lower in formation of the terbinafine dihydrodiols and S50 was greater than 5-fold higher when compared to that for CYP3A4. A loss of the methyl group led to an approximately 10-fold higher Vmax and slightly lower Km for CYP2C19 formation of the desmethyl-terbinafine dihydrodiols. The same trends for the relative kinetic constants between the isozymes were also observed for oxidation of the alkyl termini for the substrates. These findings indicate that (1) CYP2C19 was less efficient at oxidation of the naphthyl moiety than 3A4 and (2) CYP3A4 substrate binding was significantly reduced upon removal of the N-methyl group, which was not the case for CYP2C19. By contrast, the models did not predict either of these differences in metabolism between the isozymes.
DISCUSSION
Inference of TBF-A Kinetics Was Made through Its Amine Co-metabolites in Reactions.
Our dansyl hydrazine and dansyl chloride labeling methods for aldehyde and amine metabolites provided a powerful approach to identify and track the formation of the broadest array of terbinafine metabolites to date.13 TBF-A apparent rates were measurable but not reliable indicators of its actual formation during metabolism of terbinafine or desmethyl-terbinafine as reported previously.13 The reactive metabolite rapidly decays over time; however, we observed differences in the rate and end-point of decay among human liver microsomes and Supersomes. The type of enzyme preparation then impacted decay and suggested proteins present stabilize TBF-A, yielding a measurable, but relatively minor effect in these studies. By contrast, we showed that the co-metabolites of TBF-A reactions, that is, N-methyl-1-naphthyl-methylamine and 1-naphthyl-methylamine in Steps 1.1 and 2.2a, were stable, reproducibly measurable metabolites for those reactions. In fact, we are the first to report the kinetics for 1-naphthyl-methylamine, because low yields and high variability precluded its measurement in human liver microsomes.13 Consequently, we were able to infer TBF-A kinetics through the use of its amine co-metabolites formed in the same reaction and could make direct comparisons of alternate reaction steps leading to formation of the reactive metabolite.
P450 Isozymes Were Promiscuous in Reactions toward Terbinafine.
The potential importance of P450 isozymes in terbinafine metabolism was revealed through inhibitor phenotyping experiments with pooled human liver microsomes. Utilization of inhibitor phenotyping is limited to qualitative assessment and cannot accurately represent the importance of individual P450s in metabolism. These limitations are due in part to the capability of the individual P450 isozymes to compensate for the inactivation of other isozymes. Additionally, chemical inhibitors of individual isozymes were selected due to their relative specificity to a singular enzyme, but off-target effects can influence the activity of other isozymes in human liver microsomes. As indicated by others,15 nearly all P450 isozymes metabolize terbinafine; however, we report a breakdown of the specificity of each isozyme for individual pathways and their potential level of contribution to them. Six of the nine tested P450 isozymes could N-dealkylate terbinafine into TBF-A and N-methyl-1-naphthyl-methylamine in Pathway 1 and most of those catalyzed the N-demethylation of terbinafine in Pathway 2. These isozymes were similarly responsible for downstream generation of TBF-A from desmethyl-terbinafine in Pathway 2, indicating that loss of the methyl group does not impact specificity for the reaction among the isozymes. There was a higher selectivity for oxidative removal of the sterically larger N-naphthyl group, as evidenced by CYP2A6, 2C19, and 3A4 involvement in the reaction. For the oxidative nondealkylations, eight P450 isozymes likely participated in the formation of dihydrodiol metabolites, while hydroxylation of the heptanyl chain terminus involved only 1A2 and CYP2 family members. The metabolic promiscuity of P450 isozymes for these reactions is reasonable given the diversity of structural elements comprising terbinafine. The drug contains small and large alkyl groups, a large planar biphenyl moiety and a positive charge, all of which provide effective elements for the isozymes to bind and target for metabolism. Nevertheless, the capacity to drive these reactions ultimately determines their relevance in the generation of the reactive metabolite TBF-A and clearance of the parent drug in general.
CYP2C19 Was Most Efficient, but CYP3A4 Is More Effective at Pathways Leading to TBF-A.
Steady-state studies for CYP2C19 and 3A4 validated the qualitative inhibitor phenotyping results to quantitatively reveal their importance in all three N-dealkylation pathways. Between the two P450 isozymes, CYP2C19 was the most efficient in all N-dealkylation reactions for terbinafine, including direct formation of TBF-A in Pathway 1. The efficiencies of N-dealkylations in Pathways 2 and 3 were similar for CYP2C19, indicating a more accommodating active site to form catalytically competent substrate-bound complexes than CYP3A4, which preferentially catalyzed only N-denaphthylation in Pathway 3. The most significant difference in their catalytic capacities was CYP2C19 N-demethylation of terbinafine in Pathway 2 to yield desmethyl-terbinafine. The 10-fold higher efficiency in the reaction suggests that CYP2C19 may be important in the formation of this major plasma metabolite following multidosing for patients.14 Even for desmethyl-terbinafine, CYP2C19 remained more efficient at TBF-A formation in Pathway 2 based on 1-naphthyl-methylamine kinetics. For Pathway 3, both P450 isozymes efficiently catalyzed N-denaphthylation of terbinafine. The resulting N-methyl-6,6-dimethylhept-2-ene-4-ynal metabolite is not commercially available, which rendered us unable to determine the kinetics for its further metabolism to generate TBF-A. Interestingly, both P450 isozymes exhibited a significant (∼15-fold) decrease in N-denaphthylation catalytic efficiencies from terbinafine to desmethyl-terbinafine. This effect derived mainly from an increase in Km, suggesting the methyl group is important in the substrate binding for metabolism. Overall, CYP2C19 and 3A4 demonstrated similar patterns in efficiencies, yet CYP2C19 was consistently more efficient at reaction steps leading to TBF-A formation. Consequently, lower efficiencies for reactions competing with TBF-A formation led to a higher flux of terbinafine to the reactive metabolite by CYP3A4 when compared to CYP2C19.
CYP3A4 Model Performance Was Better than That for CYP2C19.
Unlike experimental approaches, metabolism models for CYP2C19 and 3A4 provided a rapid assessment of all possible reaction steps for N-dealkylation pathways. Their application yielded outputs scaled from 0 to 1.0, resembling a probability with three important caveats. First, the absence of a way to statistically analyze the significance of differences in model outputs limited the findings to a qualitative assessment of reaction possibilities. Second, model predictions are not scaled to kinetic constants (Vmax, Km, or Vmax/Km), and so a direct comparison of model performance relative to experimental data is not possible. As a solution, we calculated the model split ratios for estimating the preference for pathways leading to TBF-A. Third, predictions from one model are not scaled to other models and thus it is impossible to directly compare the likelihood for a reaction to be carried out by one isozyme relative to another. Rather, the magnitude of model prediction scales to the training set for reactions catalyzed and not catalyzed by that specific P450 isozyme. In other words, higher predictions for CYP3A4 do not necessarily mean the reaction is more likely to occur relative to CYP2C19 and vice versa. Nevertheless, the model outputs alone and in combination provided insights on the preference for reaction steps and subsequently the pathways to formation of TBF-A.
Although limited to reactions in this study, use of the CYP2C19 and 3A4 models provided an opportunity to assess their performance relative to experimental findings. Overall, the CYP3A4 model yielded higher likelihoods for individual reactions than those predicted by the CYP2C19 model. This outcome may reflect a sufficiently representative training set for CYP3A4 reactions and/or the known higher substrate promiscuity reported for the isozyme.29 The general patterns for CYP2C19 and 3A4 model outputs were similar, wherein N-demethylations (Pathway 2) and denaphthylations (Pathway were much more likely than N-dealkylations (Pathway 1) to yield TBF-A. This trend held true for the catalytic efficiencies for the isozymes; however, the experimental data showed that CYP2C19 was much more efficient at N-demethylation (Pathway 2) than CYP3A4 and the isozymes were comparable in N-denaphthylation. The models further predicted the loss of the bulky naphthyl group increased the likelihood for generation of TBF-A in Pathway 3. Unfortunately, we were not able to experimentally test the model prediction due to the lack of commercially available N-methyl-6,6-dimethylhept-2-ene-4-ynal substrate. Although not rates, the model predictions yielded the likelihood for all reactions to occur for the three N-dealkylation pathways leading to formation of TBF-A, and hence, we leveraged the predictions to calculate model split ratios. Analysis of the modeling results mirrored those for individual predictions in that there was no overall difference in preference between Pathways 1 and 2. This observation was true for CYP3A4 based on fractional contributions of the pathways using experimental data; however, that was not the case for CYP2C19 in which Pathway 1 was more important than Pathway 2. Interestingly, the models predicted an intriguing, but experimentally untestable prediction that Pathway 3 is the most productive route to formation of the reactive metabolite. Taken together, model predictions seemed more in line with experimental findings for CYP3A4 than that for 2C19. These differences may be due to (1) low model accuracy, (2) lack of model scaling to kinetic constants, and/or (3) scaling differences between the P450 isozyme models. Further application of the model to experimental data would likely lend insights into the weight of those possibilities in model predictions and guide future iterations for their improvement.
Highly Efficient N-Denaphthylation by CYP2C19 and 3A4 Was Not Observed with Microsomes.
The CYP2C19 and 3A4 kinetics for N-dealkylation pathways shared many similarities to those for human liver microsomes with a notable difference; the N-denaphthylation (Pathway 3) of terbinafine was a minor pathway for the microsomal reaction,13 but a major one for both P450 isozymes. This surprising finding led to a series of control studies to validate this observation. The high 1-naphthaldehyde formation rates for CYP2C19 and 3A4 Supersomes did not reflect contributions from secondary metabolism based on steady-state conditions for experiments and relatively inefficient alternate reactions, so that the observed kinetics were due to the first step in Pathway 3. Moreover, the low 1-naphthaldehyde rates for human liver microsomes were not due to subsequent metabolism of the metabolite, as levels were stable during the duration of the assay. Rather, 1-naphthaldehyde was only metabolized by enzymatic activity dependent on NADPH in Supersomes, although the rates were not significant enough to alter the observed formation rates during terbinafine metabolism. Taken together, these findings support an efficient generation to 1-naphthaldehyde from Pathway 1.2 that occurred with CYP2C19 and 3A4 Supersomes but not in human liver microsomes. Interestingly, the model for metabolism by human liver microsomes predicted a low likelihood for N-denaphthylation (Pathway 3), while CYP2C19 and 3A4 models predicted high likelihoods for the reaction (Figure 7). Replication of this general trend for the experimental data suggests that the training data for the models may contain information on the impact of enzyme source and subsequent likelihood for the reaction to occur. An explanation for higher N-denaphthylation efficiency for recombinant P450 isozymes relative to human liver microsomes containing them remains elusive and important to the differences in metabolite stability seen in this study.
Clinical Data Support CYP3A4 Role in Terbinafine Metabolism.
Results from in vitro kinetic studies with CYP2C19 and 3A4 reflected patterns observed for terbinafine metabolism by human liver microsomes and in a broader, more relevant context explain clinical observations. For N-dealkylations, the Km values for reaction steps for CYP2C19 and 3A4 were within 2-fold of those reported in human liver microsomal studies, indicating comparable substrate specificity and affinity. Moreover, the patterns of metabolic efficiencies for the reactions in Pathways 1 and 2 were similar among the enzyme preparations (Figure 7). Trends for the kinetic mechanisms and constants as well as the inhibitor phenotyping results support important roles for CYP2C19 and 3A4 in hepatic terbinafine metabolism, including formation of TBF-A. Nevertheless, hepatic CYP2C19 and 3A4 protein levels determine Vmax and thus will modulate their relative significance in metabolism. In the general population, there is wide variation in P450 isozyme expression due to factors such as age, sex, physiological status, genetic polymorphisms, and chemical inducers like drugs and pollutants.29–32 A recent meta-analysis of P450 isozyme expression data found hepatic CYP2C19 levels of 11 pmol/mg protein (89% CV, range 0− 67) and those for CYP3A4 of 93 pmol/mg (91% CV, range 0− 601).33 On average, the higher CYP3A4 levels would make it more likely the dominant enzyme for Pathway 1 and the first step of Pathway 3 despite their comparable metabolic efficiencies with CYP2C19. N-demethylation (Pathway 2) of terbinafine is far more efficiently carried out by CYP2C19, so that it would likely remain the most dominant isozyme responsible for generation of the major metabolite in plasma.14 Reported drug−drug interactions provide clinical evidence in support of CYP3A4 in the overall clearance of terbinafine. Co-administered drugs increase terbinafine metabolism through CYP3A4 induction or decrease its metabolism due to CYP3A4 inhibition.27,34 There is little evidence for clinical relevance for CYP2C19; however, studies have primarily focused on the overall terbinafine clearance and not individual pathways such as the potential importance of CYP2C19 in N-demethylation of the drug. Notably, no clinical studies have investigated the role of CYP2C19 and 3A4 (or other isozymes) in TBF-A formation and subsequent potential idiosyncratic adverse drug events. Our findings provide novel insights on those possibilities.
Concluding Remarks.
Our combination of experimental and computational approaches yielded novel insights on the importance of CYP2C19 and 3A4 on the metabolic clearance and activation of terbinafine as a foundation for understanding the impact of those processes on idiosyncratic adverse drug events. Based on kinetics, CYP2C19 is a dominating enzyme, but higher CYP3A4 protein levels compensate for lower efficiency and may render it more important when accounting for an average adult’s overall metabolic capacity. Their respective roles would ultimately depend on clinical factors impacting their protein expression levels. Moreover, other P450 isozymes were more selective in catalyzing specific N-dealkylation and deserve further study, given they may also be important in the generation of reactive TBF-A during terbinafine treatment. For the modeling studies, predictions provided insights on the likelihood for reactions to occur, yet did not extrapolate to quantitative measures of metabolism like kinetics. As a bridge between modeling and experimental studies, we expanded on our novel approach13 to use split ratios for competing reactions and in doing so, generate a readout on the preference for single and multistep pathways relative to one another. This strategy is useful for extending the potential value of modeling predictions as well as a tractable way to assess modeling and experimental results. In this study, the CYP3A4 model performance was more accurate than that for CYP2C19 for this small data set. The identification of model shortcomings provided insights on which aspects of the model require adjustment for improving prediction accuracy. Moreover, the models yielded hypotheses, such as the potential impact of loss of the naphthyl group on increasing metabolism, even though it was not possible to test in this case. Consequently, utilization of both approaches can lead to a more complete picture of compound metabolism. Taken together, knowledge of CYP2C19 and 3A4 roles in terbinafine metabolic kinetics provides important clues on their potential activities in the generation of reactive TBF-A. These activities may correlate with idiosyncratic adverse drug events during oral terbinafine treatment and will serve as a foundation for further study on their relevance in the clinic.
Supplementary Material
ACKNOWLEDGMENTS
Research reported in this publication was supported by the National Library of Medicine of the National Institutes of Health under grant numbers R01LM012222 and R01LM012482. M.D. is partially supported by the National Institute of General Medical Sciences under grant number T32GM106999. Computations were performed using the facilities of the Washington University Center for High Performance Computing that was partially funded by National Institutes of Health (NIH) under grant numbers 1S10RR022984–01A1 and 1S10OD018091–01. The content is solely the responsibility of the authors and does not necessarily represent the official views of the National Institutes of Health.
ABBREVIATIONS
- HLM
human liver microsomes
- TBF
terbinafine
- TBF-A
6,6-dimethyl-2-hepten-4-ynal
- MNMA
N-methyl-1-naphthyl methylamine
- NMA
1-naphthyl methylamine
- dTBF
des-methyl-terbinafine
- NAL
1-naphthaldehyde
- DHD
terbinafine dihydrodiol
- OL
hydroxyterbinafine
Footnotes
ASSOCIATED CONTENT
Supporting Information
The Supporting Information is available free of charge on the ACS Publications website at DOI: 10.1021/acs.chemrestox.9b00006.
Tables S1−S3 and Figures S1−S10 (PDF)
Notes
The authors declare no competing financial interest.
REFERENCES
- (1).Ryder NS (1992) Terbinafine: Mode of Action and Properties of the Squalene Epoxidase Inhibition. Br. J. Dermatol 126 (s39), 2–7. [DOI] [PubMed] [Google Scholar]
- (2).Park Y-M (2012) Prolonged Drug-Drug Interaction between Terbinafine and Perphenazine. Psychiatry Invest 9 (4), 422–424. [DOI] [PMC free article] [PubMed] [Google Scholar]
- (3).Nowosielski M, Hoffmann M, Wyrwicz LS, Stepniak P, Plewczynski DM, Lazniewski M, Ginalski K, and Rychlewski L (2011) Detailed Mechanism of Squalene Epoxidase Inhibition by Terbinafine. J. Chem. Inf. Model 51 (2), 455–462. [DOI] [PubMed] [Google Scholar]
- (4).Hall M, Monka C, Krupp P, and O’Sullivan D (1997) Safety of Oral Terbinafine: Results of a Postmarketing Surveillance Study in 25 884 Patients. Arch. Dermatol 133 (10), 1213–1219. [DOI] [PubMed] [Google Scholar]
- (5).Gupta AK, Sibbald RG, Knowles SR, Lynde CW, and Shear NH (1997) Terbinafine Therapy May Be Associated with the Development of Psoriasis de Novo or Its Exacerbation: Four Case Reports and a Review of Drug-Induced Psoriasis. J. Am. Acad. Dermatol 36 (5), 858–862. [DOI] [PubMed] [Google Scholar]
- (6).George A, Bhatia A, Kanish B, and Williams A (2015) Terbinafine Induced Pityriasis Rosea-like Eruption. Indian J. Pharmacol 47 (6), 680–681. [DOI] [PMC free article] [PubMed] [Google Scholar]
- (7).Trépanier EF, Nafziger AN, Kearns GL, Kashuba ADM, and Amsden GW (1998) Absence of Effect of Terbinafine on the Activity of CYP1A2, NAT-2, and Xanthine Oxidase. J. Clin. Pharmacol 38 (5), 424–428. [DOI] [PubMed] [Google Scholar]
- (8).Rodgers P, and Bassler M (2001) Treating Onychomycosis. AFP 63 (4), 663. [PubMed] [Google Scholar]
- (9).Napodano J Anacor Looks Right For A Long-Term Play https://seekingalpha.com/article/394671-anacor-looks-right-for-a-long-term-play (accessed May 31, 2018). [Google Scholar]
- (10).Iverson SL, and Uetrecht JP (2001) Identification of a Reactive Metabolite of Terbinafine: Insights into Terbinafine-Induced Hepatotoxicity. Chem. Res. Toxicol 14 (2), 175–181. [DOI] [PubMed] [Google Scholar]
- (11).Leyden J (1998) Pharmacokinetics and Pharmacology of Terbinafine and Itraconazole. J. Am. Acad. Dermatol 38 (5), S42–S47. [DOI] [PubMed] [Google Scholar]
- (12).Ajit C, Suvannasankha A, Zaeri N, and Munoz SJ (2003) Terbinafine-Associated Hepatotoxicity. Am. J. Med. Sci 325 (5), 292–295. [DOI] [PubMed] [Google Scholar]
- (13).Barnette DA, Davis MA, Dang NL, Pidugu AS, Hughes T, Swamidass SJ, Boysen G, and Miller GP (2018) Lamisil (Terbinafine) Toxicity: Determining Pathways to Bioactivation through Computational and Experimental Approaches. Biochem. Pharmacol 156, 10. [DOI] [PMC free article] [PubMed] [Google Scholar]
- (14).Kovarik JM, Mueller EA, Zehender H, Denouël J, Caplain H, and Millerioux L (1995) Multiple-Dose Pharmacokinetics and Distribution in Tissue of Terbinafine and Metabolites. Antimicrob. Agents Chemother 39 (12), 2738–2741. [DOI] [PMC free article] [PubMed] [Google Scholar]
- (15).Vickers AEM, Sinclair JR, Zollinger M, Heitz F, Glänzel U, Johanson L, and Fischer V (1999) Multiple Cytochrome P-450s Involved in the Metabolism of Terbinafine Suggest a Limited Potential for Drug-Drug Interactions. Drug Metab. Dispos 27 (9), 1029–1038. [PubMed] [Google Scholar]
- (16).Zaretzki J, Matlock M, and Swamidass SJ (2013) XenoSite: Accurately Predicting CYP-Mediated Sites of Metabolism with Neural Networks. J. Chem. Inf. Model 53 (12), 3373–3383. [DOI] [PubMed] [Google Scholar]
- (17).Spaggiari D, Geiser L, Daali Y, and Rudaz S (2014) Phenotyping of CYP450 in Human Liver Microsomes Using the Cocktail Approach. Anal. Bioanal. Chem 406 (20), 4875–4887. [DOI] [PubMed] [Google Scholar]
- (18).Hartman JH, Knott K, and Miller GP (2014) CYP2E1 Hydroxylation of Aniline Involves Negative Cooperativity. Biochem. Pharmacol 87 (3), 523–533. [DOI] [PubMed] [Google Scholar]
- (19).Khojasteh SC, Prabhu S, Kenny JR, Halladay JS, and Lu AYH (2011) Chemical Inhibitors of Cytochrome P450 Isoforms in Human Liver Microsomes: A Re-Evaluation of P450 Isoform Selectivity. Eur. J. Drug Metab. Pharmacokinet 36 (1), 1–16. [DOI] [PubMed] [Google Scholar]
- (20).Tornio A, Neuvonen PJ, and Backman JT (2006) The CYP2C8 Inhibitor Gemfibrozil Does Not Increase the Plasma Concentrations of Zopiclone. Eur. J. Clin. Pharmacol 62 (8), 645–651. [DOI] [PubMed] [Google Scholar]
- (21).Nirogi R, Palacharla RC, Uthukam V, Manoharan A, Srikakolapu SR, Kalaikadhiban I, Boggavarapu RK, Ponnamaneni RK, Ajjala DR, and Bhyrapuneni G (2015) Chemical Inhibitors of CYP450 Enzymes in Liver Microsomes: Combining Selectivity and Unbound Fractions to Guide Selection of Appropriate Concentration in Phenotyping Assays. Xenobiotica 45 (2), 95–106. [DOI] [PubMed] [Google Scholar]
- (22).Schellinger AP, and Carr PW (2004) Solubility of Buffers in Aqueous−Organic Eluents for Reversed-Phase Liquid Chromatography. LCGC North Am 22 (6), 3. [Google Scholar]
- (23).Dai Z, and Locasale JW (2017) Understanding Metabolism with Flux Analysis: From Theory to Application. Metab. Eng 43, 94–102. [DOI] [PMC free article] [PubMed] [Google Scholar]
- (24).Nilsson R, Roci I, Watrous J, and Jain M (2017) Estimation of Flux Ratios without Uptake or Release Data: Application to Serine and Methionine Metabolism. Metab. Eng 43, 137–146. [DOI] [PMC free article] [PubMed] [Google Scholar]
- (25).Riemer SA, Rex R, and Schomburg D (2013) A Metabolite-Centric View on Flux Distributions in Genome-Scale Metabolic Models. BMC Syst. Biol 7, 33. [DOI] [PMC free article] [PubMed] [Google Scholar]
- (26).Dolton MJ, Perera V, Pont LG, and McLachlan AJ (2014) Terbinafine in Combination with Other Antifungal Agents for Treatment of Resistant or Refractory Mycoses: Investigating Optimal Dosing Regimens Using a Physiologically Based Pharmacokinetic Model. Antimicrob. Agents Chemother 58 (1), 48–54. [DOI] [PMC free article] [PubMed] [Google Scholar]
- (27).Lamisil; Novartis Pharmaceuticals Corporation: East Hanover, NJ, 2004. [Google Scholar]
- (28).Busby WF, Ackermann JM, and Crespi CL (1999) Effect of Methanol, Ethanol, Dimethyl Sulfoxide, and Acetonitrile on In Vitro Activities of CDNA-Expressed Human Cytochromes P-450. Drug Metab. Dispos 27 (2), 246–249. [PubMed] [Google Scholar]
- (29).Klein K, and Zanger UM Pharmacogenomics of Cytochrome P450 3A4: Recent Progress Toward the “Missing Heritability” Problem. Front. Genet 2013, 4 DOI: 10.3389/fgene.2013.00012 [DOI] [PMC free article] [PubMed] [Google Scholar]
- (30).Tracy TS, Rosenbluth BW, Wrighton SA, Gonzalez FJ, and Korzekwa KR (1995) Role of Cytochrome P450 2C9 and an Allelic Variant in the 4′-Hydroxylation of (R)- and (S)-Flurbiprofen. Biochem. Pharmacol 49 (9), 1269–1275. [DOI] [PubMed] [Google Scholar]
- (31).Desta Z, Kerbusch T, Soukhova N, Richard E, Ko J-W, and Flockhart DA (1998) Identification and Characterization of Human Cytochrome P450 Isoforms Interacting with Pimozide. J. Pharmacol. Exp. Ther 285 (2), 428–437. [PubMed] [Google Scholar]
- (32).Desta Z, Zhao X, Shin J-G, and Flockhart DA (2002) Clinical Significance of the Cytochrome P450 2C19 Genetic Polymorphism. Clin. Pharmacokinet 41 (12), 913–958. [DOI] [PubMed] [Google Scholar]
- (33).Achour B, Barber J, and Rostami-Hodjegan A (2014) Expression of Hepatic Drug-Metabolizing Cytochrome P450 Enzymes and Their Intercorrelations: A Meta-Analysis. Drug Metab. Dispos 42 (8), 1349–1356. [DOI] [PubMed] [Google Scholar]
- (34).Rodrigues AD Drug-Drug Interactions, 2nd ed.; CRC Press: Boca Raton, FL, 2008. [Google Scholar]
- (35).Humbert H, Cabiac MD, Denouël J, and Kirkesseli S (1995) Pharmacokinetics of Terbinafine and of Its Five Main Metabolites in Plasma and Urine, Following a Single Oral Dose in Healthy Subjects. Biopharm. Drug Dispos 16 (8), 685–694. [DOI] [PubMed] [Google Scholar]
- (36).Dang NL, Hughes TB, Miller GP, and Swamidass SJ (2018) Computationally Assessing the Bioactivation of Drugs by N-Dealkylation. Chem. Res. Toxicol 31 (2), 68–80. [DOI] [PMC free article] [PubMed] [Google Scholar]
Associated Data
This section collects any data citations, data availability statements, or supplementary materials included in this article.