Abstract
A library of 52 distyryl and 9 mono-styryl cationic dyes was synthesized and investigated with respect to their optical properties, propensity to aggregation in aqueous medium, and capacity to serve as fluorescence “light-up” probes for G-quadruplex (G4) DNA and RNA structures. Among the 61 compounds, 57 dyes showed preferential enhancement of fluorescence intensity in the presence of one or another G4-DNA or RNA structure, while no dye displayed preferential response to double-stranded DNA or single-stranded RNA analytes employed at equivalent nucleotide concentration. Thus, preferential fluorimetric response towards G4 structures appears to be a common feature of mono- and distyryl dyes, including long-known mono-styryl dyes used as mitochondrial probes or protein stains. However, the magnitude of the G4-induced “light-up” effect varies drastically, as a function of both the molecular structure of the dyes and the nature or topology of G4 analytes. Although our results do not allow to formulate comprehensive structure–properties relationships, we identified several structural motifs, such as indole- or pyrrole-substituted distyryl dyes, as well as simple mono-stryryl dyes such as DASPMI [2-(4-(dimethylamino)styryl)-1-methylpyridinium iodide] or its 4-isomer, as optimal fluorescent light-up probes characterized by high fluorimetric response (I/I0 of up to 550-fold), excellent selectivity with respect to double-stranded DNA or single-stranded RNA controls, high quantum yield in the presence of G4 analytes (up to 0.32), large Stokes shift (up to 150 nm) and, in certain cases, structural selectivity with respect to one or another G4 folding topology. These dyes can be considered as promising G4-responsive sensors for in vitro or imaging applications. As a possible application, we implemented a simple two-dye fluorimetric assay allowing rapid topological classification of G4-DNA structures.
Keywords: fluorescent probes, G-quadruplex DNA, G-quadruplex RNA, nucleic acids, styryl dyes
Introduction
Development of fluorescent probes for G-quadruplex (G4) DNA and RNA is an active research area. In fact, these non-canonical nucleic acid structures appear to be biologically relevant, although a complete understanding of their roles is still missing [1–3]. At the same time, they represent versatile building blocks for artificial nano-architectures and nanodevices [4–5]. In this context, small-molecule fluorescent probes find applications for in vitro detection of G4 structures and their differentiation from other DNA or RNA forms [6–10], topological characterization of G4 structures [11–14], real-time detection of G4 formation [15], and implementation of G4-based molecular devices [16–17] and biosensors [18–23]. Also, there have been promising reports on cellular imaging of G4-DNA [24–29] and G4-RNA [30–33] structures using small-molecule probes. A large number of fluorescent probes for G4-DNA and RNA have thus emerged in the last years, as summarized in several recent reviews on this subject [34–39]. Moreover, novel probes continue to be regularly reported. However, in most cases, the discovery of novel probes is based on serendipitous findings or limited variations of already established fluorogenic scaffolds. This provokes a flood of “one-molecule” papers that report on novel exciting probes, but do not compare their performance with that of already established ones [40–51]. Systematic approaches to the development of fluorescent probes are still rare and explore only a limited range of the chemical space [52–57]. This is a major hurdle to the establishment of solid structure–properties relationships. Therefore, the choice of the best probe for a particular application, as well as the development of novel probes with improved or tailored properties, still remain problematic tasks.
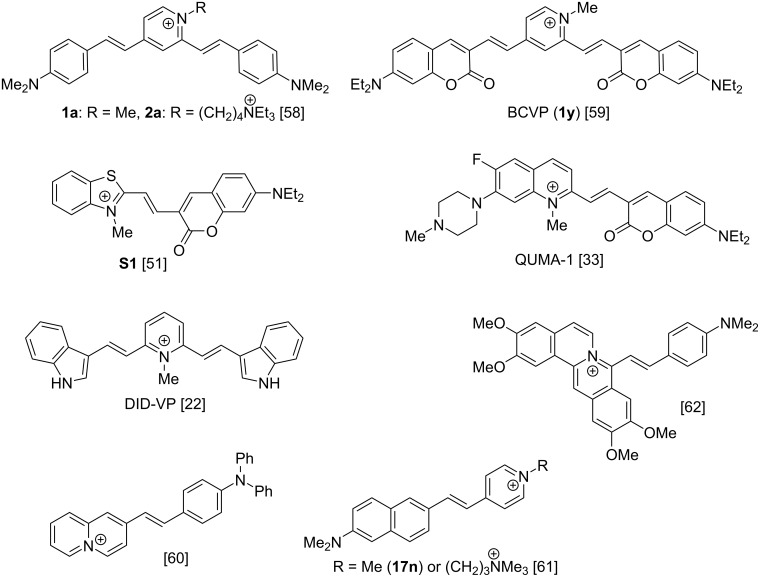
Along these lines, we have previously reported that cationic styryl-type dyes, such as distyrylpyridinium derivatives 1a and 2a (Figure 1) represent a promising starting point for the development of fluorescent probes selective for a variety of G4-DNA structures [58]. Another distyryl dye, namely coumarin derivative 1y (BCVP), provides a bimodal (colorimetric and fluorimetric) output towards G4-DNA through the selective disruption of H-aggregates formed in buffered solution [59]. In the meantime, numerous other styryl derivatives were reported as efficient “light-up” probes for G4-DNA and RNA, validating the potential of this molecular scaffold (Figure 1) [22,33,60–63]. Nevertheless, the structural determinants for the desired properties of the probes (i.e., high selectivity for G4-DNA or G4-RNA with respect to double-stranded or single-stranded nucleic acids, high fluorimetric response and quantum yield, low background fluorescence) are still poorly understood, mostly due to the lack of comparative studies. To explore this aspect, we report the synthesis and systematic study of a library of 61 di- and mono-styryl dyes, as potential “light-up” probes for G4 structures. The study aims at the improvement of photophysical properties of the dyes and the establishment of structure–properties relationships.
Figure 1.
Some di- and mono-styryl dyes previously reported as fluorescent “light-up” probes for G4-DNA and RNA. Counter-ions are omitted for the sake of clarity.
Results
Design and synthesis of the dye library
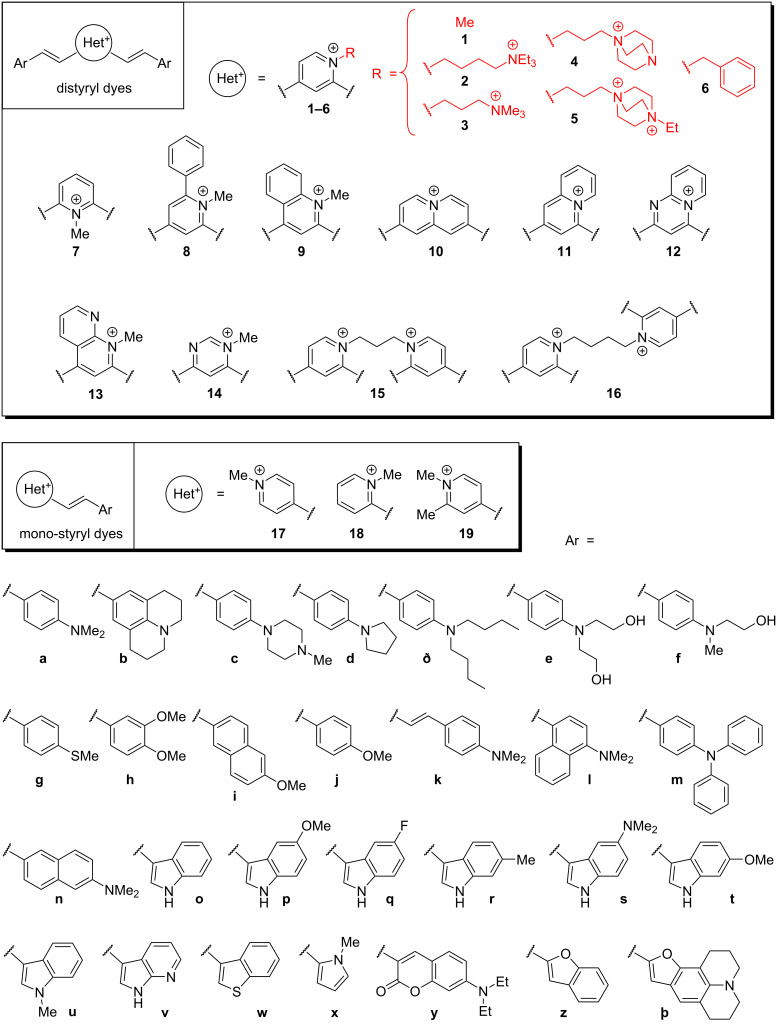
On the basis of the previously established distyryl scaffold, we designed 49 novel derivatives through systematic variation of the electron-donating lateral aromatic groups Ar (a–Þ), the cationic heterocyclic core Het+ (1–16) and, in the case of 2,4-disubstituted derivatives (1–6), the substituent R (Figure 2). Among these, several distyryl dyes (1o, 1x, 7x [64] and 10a [65]) have been previously reported as fluorescent probes for detection of double-stranded DNA. Compounds 15a and 16a are homo-dimeric derivatives, featuring two distyryl moieties connected via a C3 (15a) or a C4 (16a) linker. In addition, we included 9 mono-styryl derivatives. Among these, compounds 17a and 18a are long-known [66–67]; however, to the best of our knowledge, they have not been studied as fluorescent probes for G4 structures so far. On the contrary, dye 17n (Figure 1) was reported as a fluorescent probe for G4-DNA during the preparation of the present work earlier this year [61]. Of note, numerous mono-styryl dyes combining indole and quinolinium or pyridinium fragments have been described as bright, photostable stains for double-stranded DNA, although their interaction with G4 structures has not been assessed [68–70].
Figure 2.
Design of a library of di- and mono-styryl dyes. Counter-ions are omitted for the sake of clarity.
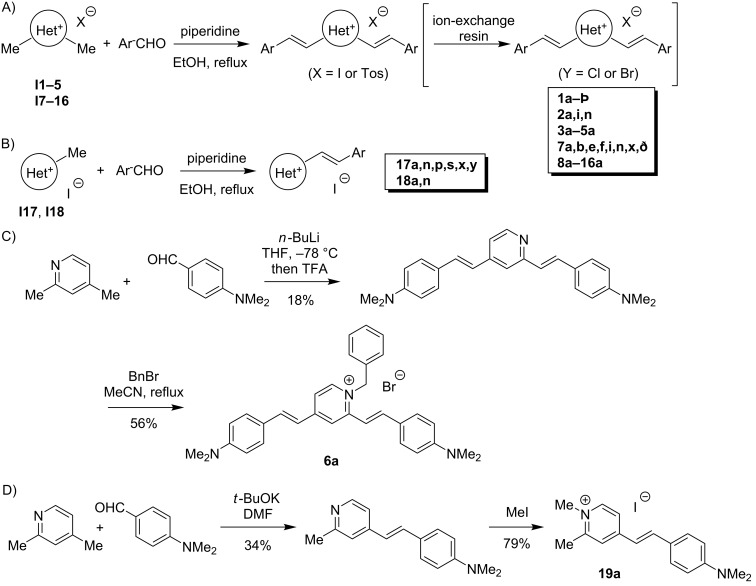
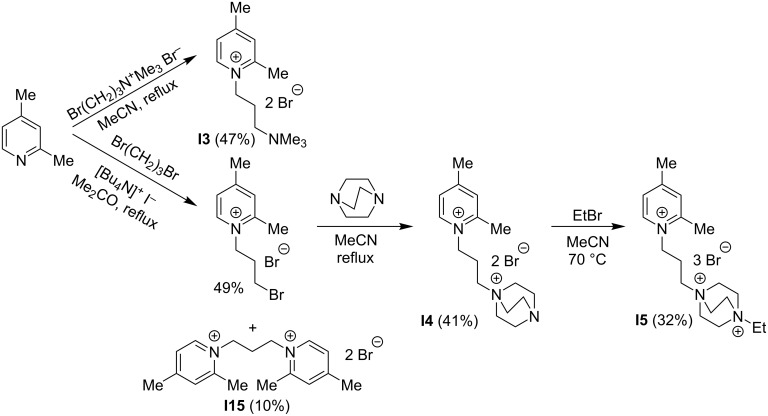
All dyes, except for distyryl derivative 6a and mono-styryl derivative 19a, were obtained through a piperidine-catalyzed Knoevenagel condensation of the corresponding heterocyclic precursors I1–5 and I7–16 with 1.5 molar equivalents (per styryl unit) of aromatic aldehydes ArCHO (Scheme 1A,B). The synthesis of precursors I3–5 and I15 is presented in Scheme 2 and detailed in Supporting Information File 1. Dyes 6a and 19a, which could not be obtained by this route, were synthesized through quaternization of the corresponding neutral styryl precursors with alkyl halides (Scheme 1C,D).
Scheme 1.
A, B) General synthesis of A) distyryl and B) mono-styryl dyes via Knoevenagel condensation route. C) Synthesis of the dye 6a. D) Synthesis of the dye 19a.
Scheme 2.
Synthesis of I3–5 and I15.
Most dyes of the library were prepared and handled as iodide salts. However, in the case of very lipophilic dyes, the solubility of iodide salts in the high-ionic-strength aqueous buffer required for native G4 structures was insufficient. In these cases, ion exchange to bromide (1b, 1ð, 1u, 6a, 7b, 7n) or chloride (1d, 1k–1q, 1t, 1w, 7ð, as well as 8a–12a and 14a–16a) was performed using ion-exchange resins (cf. Supporting Information File 1 and Table 1), in order to achieve a satisfactory level of solubility in aqueous buffer (i.e., no visible precipitation at a dye concentration of 10 µM in K-100 buffer: 10 mM LiAsO2Me2, 100 mM KCl, pH 7.2). Dyes containing side-chain substituents (2a–6a) were obtained directly as bromide salts, sufficiently soluble in the aqueous buffer. All dyes were rigorously purified by recrystallization and their identity and purity were confirmed by 1H and 13C NMR, LC–MS and elemental analysis data.
Table 1.
Positions of maxima and intensity of long-wavelength absorption bands of dyes in MeOH and K-100 aqueous buffer.a
| Dye | Anion | MeOH | Buffer K-100 | ||
| λmax [nm]b | ε [103 cm−1 M−1] | λmax [nm]b | ε [103 cm−1 M−1] | ||
| distyryl dyes | |||||
| 1a | I– | 507 | 61.7 | 476, 616 (sh) (J) | 39.9, 1.4 |
| 1b | Br– | 551 | 61.4 | 510 | 28.7 |
| 1c | I– | 472 | 53.7 | 422 (H) | 43.6 |
| 1d | Cl– | 521 | 67.7 | 620 (J), 531 (sh) | 34.5, 27.5 |
| 1ð | Br– | 524 | 65.9 | 459 (H) | 43.3 |
| 1e | I– | 508 | 63.7 | 486 | 53.6 |
| 1f | I– | 510 | 61.9 | 486 | 45.6 |
| 1g | I– | 418 | 50.4 | 404 | 40.6 |
| 1h | I– | 422 | 44.6 | 403 | 40.8 |
| 1i | I– | 425 | 54.7 | 414 | 23.2 |
| 1j | I– | 407 | 46.7 | 393 | 393 |
| 1k | Cl– | 533 | 66.4 | 510 | 26.3 |
| 1l | Cl– | 468 | 32.8 | 443 | 22.4 |
| 1m | Cl– | 493 | 61.0 | 479 | 38.3 |
| 1o | Cl– | 466, 409 (sh) | 56.2, 32.6 | 458 | 27.0 |
| 1p | Cl– | 474 | 57.2 | 465 | 29.3 |
| 1q | Cl– | 457, 404 (sh) | 55.3, 34.0 | 487 | 27.3 |
| 1r | I– | 473, 417 (sh) | 56.9, 32.2 | 462 | 28.8 |
| 1s | I– | 482 | 33.4 | 456 | 24.6 |
| 1t | Cl– | 476 | 55.5 | 455 | 20.8 |
| 1u | Br– | 472, 418 (sh) | 52.2, 31.6 | 459 | 31.0 |
| 1v | I– | 435, 391 (sh) | 48.8, 33.6 | 413, 367 | 22.0, 19.9 |
| 1w | Cl– | 410 | 32.8 | 404 | 22.5 |
| 1x | I– | 473, 419 (sh) | 50.9, 32.5 | 455 | 42.7 |
| 1y | I– | 527 | 95.3 | 580, 460 (H) | 14.9, 44.0 |
| 1z | I– | 423 | 55.9 | 416 | 45.3 |
| 1Þ | I– | 605 | 62.6 | 542 (H) | 30.4 |
| 2a | 2 Br– | 516 | 62.9 | 483 | 43.1 |
| 2i | 2 Br– | 430 | 53.2 | 411 | 32.8 |
| 2n | 2 Br– | 508 | 56.9 | 475 | 28.3 |
| 3a | 2 Br– | 523 | 65.1 | 493 | 44.9 |
| 4a | 2 Br– | 524 | 57.4 | 493 | 48.1 |
| 5a | 3 Br– | 528 | 64.5 | 495 | 43.3 |
| 6a | Br– | 520 | 64.7 | 491 | 25.0 |
| 7a | I– | 494 | 70.3 | 465 | 44.9 |
| 7b | Br– | 535 | 66.4 | 507 | 29.0 |
| 7ð | Cl– | 511 | 79.5 | 480 | 43.4 |
| 7e | I– | 497 | 73.5 | 475 | 60.2 |
| 7f | I– | 497 | 68.9 | 474 | 52.3 |
| 7i | I– | 420 | 62.5 | 400 | 20.1 |
| 7n | Br– | 489 | 64.0 | 480 | 21.2 |
| 7x | I– | 467 | 57.3 | 448 | 48.7 |
| 8a | Cl– | 512 | 62.1 | 476 | 38.6 |
| 9a | Cl– | 565, 497 | 56.6, 48.3 | 492 (H) | 33.5 |
| 10a | Cl– | 516 | 87.0 | 463 (H) | 28.7 |
| 11a | Cl– | 473 | 61.1 | 432 | 32.8 |
| 12a | Cl– | 551 | 56.7 | 659 (J), 471 | 42.8, 16.8 |
| 13a | Tos– | 597, 512 | 53.9, 42.0 | 570 (sh), 515 | 24.9, 27.0 |
| 14a | Cl– | 569, 471 | 82.3, 29.7 | 564 | 54.4 |
| 14p | Cl– | 523, 420 | 74.4, 20.5 | 590 (J) | 67.5 |
| 15a | 2 Cl– | 520 | 115.2 | 523 | 61.4 |
| 16a | 2 Cl– | 510 | 111.7 | 490 | 69.1 |
| mono-styryl dyes | |||||
| 17a | I– | 475 | 47.1 | 448 | 31.5 |
| 17n | I– | 473 | 37.1 | 422 | 29.1 |
| 17p | I– | 444 | 42.3 | 422 | 35.5 |
| 17s | I– | 449 | 33.2 | 424 | 32.2 |
| 17x | I– | 440 | 35.1 | 424 | 24.3 |
| 17y | I– | 495 | 61.2 | 491 | 54.1 |
| 18a | I– | 461 | 42.1 | 435 | 28.4 |
| 18n | I– | 459 | 33.4 | 409 | 26.0 |
| 19a | I– | 466 | 45.9 | 438 | 31.2 |
| other | |||||
| ThTc | Cl– | 415 | 28.1 | 410 | 24.7 |
a10 mM LiAsMe2O2, 100 mM KCl, pH 7.2. bsh: shoulder, H: H-aggregate band, J: J-aggregate band. cThioflavin T.
Optical properties
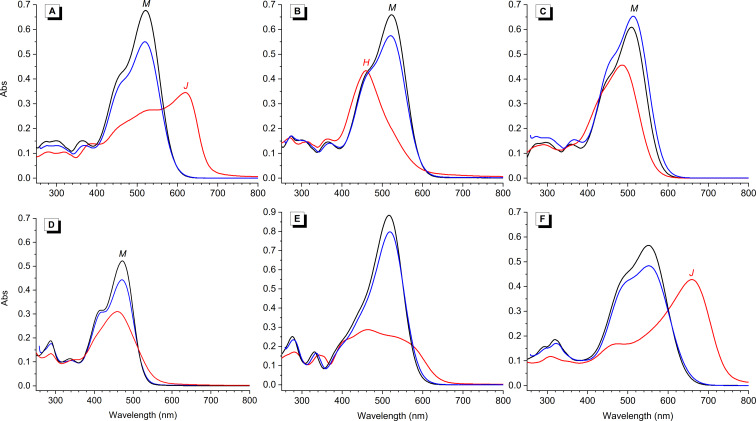
The library of styryl dyes covers a broad spectral range, with absorption maxima ranging, in MeOH, from 407 nm (1j) to 605 nm (1þ), and molar extinction coefficients from around 45,000 to 60,000 cm−1 M−1 (Table 1). Several representative absorption spectra are shown in Figure 3. In aqueous buffer solutions (K-100: 10 mM LiAsO2Me2, 100 mM KCl, pH 7.2) and at dye concentration of 10 µM, the absorption bands of most dyes are blue-shifted by 10 to 30 nm and undergo a hypochromic effect, compared with organic solvents such as MeOH or DMSO. This behavior evidences a more or less significant aggregation propensity of dyes in aqueous medium, even though, in all tested cases, no visible precipitation occurred. In addition, some dyes (1c, 1ð, 1Þ, 9a, 10a) display even larger (>50 nm) blue shifts of their absorption bands (Figure 3B). This is a characteristic feature for the formation of H-aggregates, as already described for dye 1y [59]. On the other hand, several dyes displayed new, strong absorption bands, red-shifted by ≈70 nm (14p) or more than 100 nm (1d and 12a) in aqueous buffer solution, with respect to organic solvents. These could be ascribed to the formation of J-aggregates (Figure 3A and 3F). This phenomenon was already observed, although at a lower extent, with dye 1a [58]. With respect to the molecular structure of dyes, it may be concluded that lipophilic substituents (1c, 1d, 1ð, 1y, 1Þ) and/or π-expanded heterocyclic cores (9a, 10a, 12a, 14p) promote the dye aggregation, but the nature of the resulting aggregate (H vs J) is unpredictable. Conversely, small or hydrophilic substituents (1e, 1f, 1h, 1x, 7e, 7x) or charged aminoalkyl chains (3a, 4a) reduce the tendency of the dyes to self-aggregate, as suggested by the reduced hypochromism of their absorption bands in aqueous solutions. Of note, our assessment of the aggregation behavior of the dyes is only preliminary, as it was performed at a single concentration (10 µM) and fixed ionic strength of the medium (110 mM). A complete investigation of this phenomenon is outside the scope of the present work. Finally, as typically observed for styryl dyes, most of the library members displayed very weak fluorescence both in organic solvents (MeOH, DMSO) and in aqueous buffer, as assessed by visual inspection of the respective solutions.
Figure 3.
Representative absorption spectra of distyryl dyes: A) 1d, B) 1ð, C) 1f, D) 1u, E) 10a and F) 12a in DMSO (blue), MeOH (black) and K-100 aqueous buffer (red lines); c = 10 µM in all cases. Band assignment (when possible): M, monomer; H, H-aggregate; J, J-aggregate.
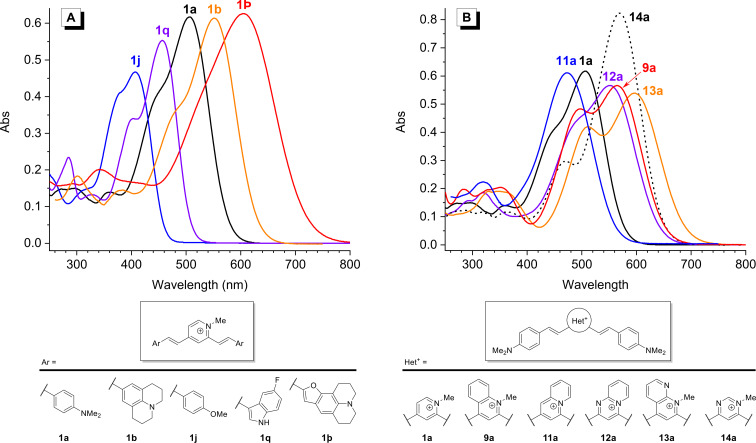
In non-aggregating conditions, the influence of the molecular structure of the dyes on their absorption bands can be clearly observed. Thus, when Ar contains poor electron-donating substituents (1g–1j), the absorption spectra of the dyes are blue-shifted with respect to the prototype dye 1a. Conversely, strongly electron-donating (1b, 1d) or π-extended (1k, 1Þ) Ar units lead to bathochromic shifts of absorption bands (Table 1 and Figure 4A). The influence of the heterocyclic core is equally important: replacement of the 2,4-pyridinium unit in dye 1a with a 2,6-pyridinium (7a) or a 2,4-quinolizinium moiety (11a) leads to a blue shift of the absorption maximum, whereas all other heterocyclic units lead to significantly stronger (10a, 14a) and/or red-shifted (9a, 12a, 13a) absorption bands (Table 1 and Figure 4B). On the other hand, the nature of the substituent R in the 2,4-pyridinium unit has only a minor influence on the optical properties, and the absorption bands of the dyes 2a–6a are only slightly red-shifted (by 10–20 nm in MeOH) with respect to that of 1a.
Figure 4.
Representative absorption spectra of the distyryl dyes (c = 10 µM in MeOH) demonstrating the influence of the molecular structure on the optical properties. A) Variation of Ar groups. B) Variation of the Het+ core.
Fluorimetric response of dyes towards DNA and RNA structures
The fluorimetric response of the dye library was investigated against a set of 14 diverse nucleic acid structures (Table 2), including ten G4-DNA structures of different topologies (parallel G4: c-kit2, 25CEB, c-kit87up, c-myc, c-src1; parallel dimer G4: c-myb; hybrid G4: 22AG, 46AG; antiparallel G4: TBA, HRAS), two G4-RNA structures (TERRA and NRAS), as well as genomic double-stranded DNA (calf thymus DNA, ct DNA) and RNA from calf liver (cl RNA). Screened samples contained fixed concentrations of dyes (2.5 µM) and nucleic acids (5 µM). Corrections to the concentration of nucleic acids were made to take into account the peculiarities of some of the samples. In particular, 46AG was tested at 2.5 µM, to account for its dimeric G4 nature, and ct DNA and cl RNA were tested at 110 µM nucleotide concentration, which is equivalent to the total nucleotide concentration in a 5 µM sample of a 22 nt oligonucleotide. All samples were prepared in a K+-rich buffer solution (K-100, see Table 1 footnote). Thioflavin T (ThT), which is widely used for detection of G4 structures, was included for comparison. The fluorescence intensity was measured using a microplate reader. In order to screen a large panel of dyes against a number of analytes, the measurements were performed at fixed excitation and emission wavelengths, selected with a set of filters and adapted to the absorption and emission characteristics of each dye (Supporting Information File 1, Table S1).
Table 2.
Nucleic acid samples used in the first screening round.
| Acronym | Sequence (5′ → 3′) | Topology | Number of G-tetrads | Ref. |
| G4-DNA | ||||
| c-kit2 | GGGCGGGCGCGAGGGAGGGG | parallel | 3 | [71] |
| 25CEB | AGGGTGGGTGTAAGTGTGGGTGGGT | parallel with a long loop | 3 | [72] |
| c-kit87up | AGGGAGGGCGCTGGGAGGAGGG | parallel with a snap-back loop | 3 | [73] |
| c-myc | TGAGGGTGGGTAGGGTGGGTAA | parallel | 3 | [74] |
| c-src1 | GGGCGGCGGGCTGGGCGGGG | parallel | 3 | [75–76] |
| c-myb | GGAGGAGGAGGA | parallel (dimer) | 2 | [77] |
| 22AG | A(GGGTTA)3GGG | hybrid (mixture of isoforms) | 3 | [78] |
| 46AG | A(GGGTTA)7GGG | hybrid (dimeric G4)a | 2 × 3 | [79] |
| HRAS | TCGGGTTGCGGGCGCAGGGCACGGGCG | antiparallel | 3 | [80] |
| TBA | GGTTGGTGTGGTTGG | antiparallel | 2 | [81] |
| G4-RNA | ||||
| TERRA | r(AGGGUUAGGGUUAGGGUUAGGGU) | parallel | 3 | [82] |
| NRAS | r(GGGAGGGGCGGGUCUGGG) | parallel | 3 | [83] |
| controls | ||||
| ct DNA | calf thymus DNA | double-stranded DNA | N/A | |
| cl RNA | calf liver RNA | single-stranded RNA | N/A | |
aUsed at half of the oligonucleotide concentration with respect to other G4 samples.
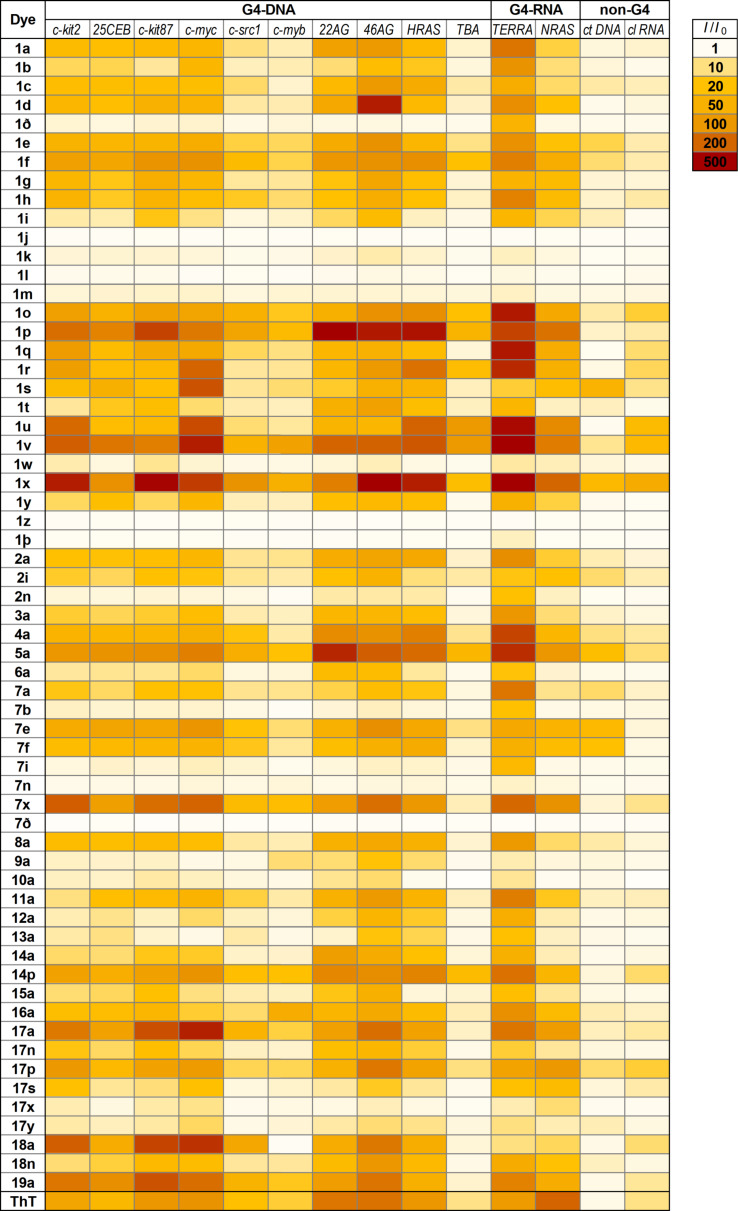
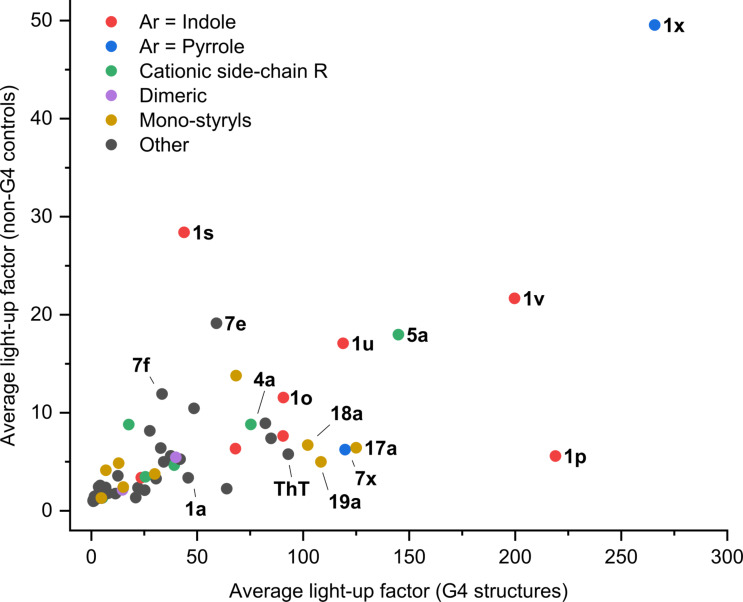
The results of the screening, presented as relative enhancement of fluorescence intensity in the presence of nucleic acids (I/I0, where I is the fluorescence intensity of the dye in the presence of two equivalents of nucleic acid and I0 is the fluorescence of the dye alone), are shown in the form of a heat-map in Figure 5 (for numeric values cf. Supporting Information, Table S1). In addition, group-average data, i.e., average fluorescence response of each dye towards 12 G4 (DNA and RNA) analytes vs average response to non-G4 (ct DNA and cl RNA) controls, are presented in Figure 6. This plot facilitates the identification of the most promising probes, disregarding the differences in response of dyes with respect to individual analytes within each group. The inspection of these data leads to a number of interesting observations. 1) Most dyes of the library display significant fluorescence enhancement (I/I0 > 10) in the presence of at least one DNA or RNA target. Only 9 of 61 styryl dyes (1j–m, 1w, 1z, 1þ, 7n and 7ð) displayed weak or no fluorescence enhancement with all nucleic acid analytes. 2) Most remarkably, the fluorescence of all dyes, with the exception of a few most “unresponsive” ones (1j, 1l, 1z, and 7ð), is preferentially enhanced in the presence of G4-DNA or G4-RNA structures, although to a varying extent. In fact, among the 61 tested dyes, none showed preferential response to double-stranded DNA (ct DNA) or single-stranded RNA (cl RNA) controls. 3) Compared to the prototype dye 1a, modifications of the core (Het+) unit (7a–14a) within the distyryl scaffold do not produce significant variations in the fluorimetric response of the dyes. The same holds true for the homo-distyryl compounds 15a and 16a, which do not outperform dye 1a. 4) Likewise, in the 2,4-pyridinium series of dyes, introduction of an aminoalkyl (3a) or benzyl substituent (6a) does not significantly improve the performance of the probes, as was already described for the dye 2a [58]. Instead, introduction of a DABCO fragment (bringing two additional positive charges) in 4a and 5a leads to higher fluorimetric response of the probes to G4-DNA (e.g., for 5a, I/I0 = 330 with 22AG), although accompanied by a concomitant loss of selectivity with respect to ds DNA (I/I0 = 25 for 5a). 5) In contrast, modification of Ar units strongly influences the fluorimetric response of the dyes. In particular, dyes containing indole residues (1o–s, 1u and 1v; red dots in Figure 6) show particularly large fluorescence enhancement in the presence of most G4-DNA and G4-RNA targets (1p: up to 550-fold with 22AG) and thus represent a significant improvement with respect to dye 1a (I/I0 < 170, with all analytes) and ThT (I/I0 ≤ 200, with all analytes). Distyryl dyes containing pyrrole residues (1x, 7x: blue dots in Figure 6) also demonstrate outstanding fluorescence enhancement in the presence of G4-DNA analytes (1x: up to 690-fold with TERRA; 7x: up to 220-fold with c-kit2). However, in the case for 1x, a marked loss of selectivity with respect to non-G4 analytes can be observed (I/I0 = 40 in the presence of ct DNA and 60 in the presence cl RNA; cf. Figure 6). Conversely, as mentioned above, the dyes containing benzothiophene (1w) or benzofuran (1z, 1þ) residues perform poorly as fluorescent probes. 6) Strongly aggregating dyes (i.e., 1d, 1ð, 10a and 12a) generally do not show higher light-up effects than weakly aggregating analogues 1a or 1e. As a remarkable exception, dye 1d shows strong and highly selective response towards the dimeric G4-DNA 46AG (I/I0 = 350), which can be attributed to higher-affinity binding of the dye at the interface between two G4 units, leading to efficient disaggregation. 7) Finally, several mono-styryl dyes, especially 17a, 17p, 18a and 19a also display significant fluorescence enhancements in the presence of G4 structures (e.g., 17a: up to 340-fold, 18a: up to 300-fold, both in the presence of c-myc), even higher than those of the distyryl analogues 1a and 7a, and good selectivity with respect to double-stranded DNA.
Figure 5.
Heat map of the relative emission intensity enhancement (I/I0) of styryl dyes and thioflavin T (ThT) (c = 2.5 µM in K-100 buffer) in the presence of 2 molar equiv of G4-DNA (46AG: 1 molar equivalent), G4-RNA, or ct DNA and cl RNA controls used at equivalent nucleotide concentration. Darker cells indicate higher I/I0 values (see legend). For the numeric data, excitation and emission wavelengths see Supporting Information File 1, Table S1.
Figure 6.
Analysis of the light-up response matrix of the dyes. The average light-up factor of each dye with respect to non-G4 targets (ct DNA and cl RNA) is plotted against the corresponding average light-up factor obtained with 12 G4 targets. The grouping of dyes is arbitrary and serves to highlight some of the structural motifs. Of note, x and y axes display different scales.
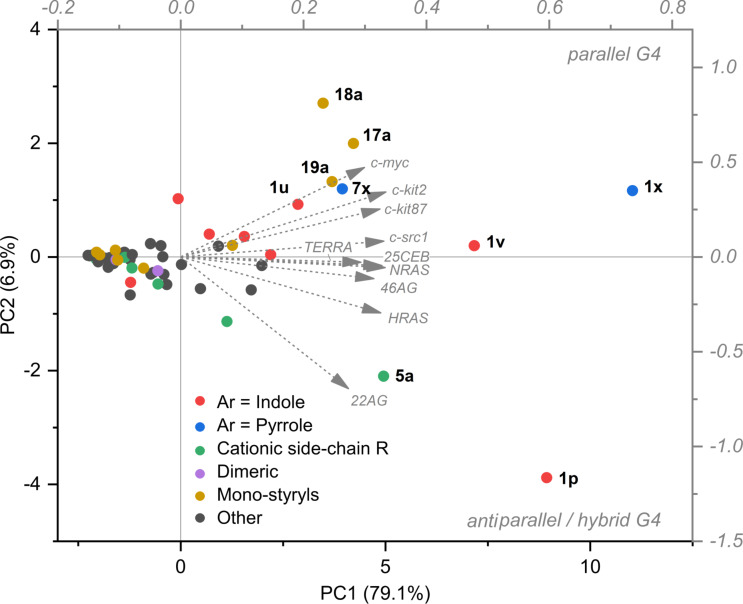
A number of patterns could also be revealed with respect to the differential response of the probes towards various G4 targets. 1) Remarkably, G4-RNA TERRA systematically induces the highest fluorimetric response of most probes from the distyryl series, but not from the mono-styryl one. 2) In contrast, TBA and c-myb (i.e., both two-quartet quadruplexes) are poorly detected by most dyes (including ThT), in agreement with what was observed with other probes [6,14,57]. Nonetheless, several indole-containing dyes enable sensitive detection of these targets (with I/I0 up to 100, 1u and 1v), with an excellent selectivity with respect to double-stranded DNA. 3) Several dyes display preferential response towards one or another topological group of analytes. The first group (dyes 1a, 1d, 1p, 1x) is selective towards hybrid (22AG, 46AG) and antiparallel (HRAS) G4-DNA, whereas the second group (dyes 1s, 1u, 1v, 17a and 18a) shows fluorimetric selectivity for parallel G4-DNA forms (c-kit2, c-kit87up, c-myc). To verify the preferences of the dyes with respect to the conformation of the G4 analytes, we analysed the data matrix presented in Figure 5 using principal component analysis (PCA). TBA and c-myb, which had proven mostly unresponsive, were excluded from the analysis. The response pattern of each dye is represented as a dot in the plot of the two first principal components (PC1 vs PC2, Figure 7). In this plot, PC1 (x axis) correlates with the overall light-up intensity observed for each dye with the tested targets. On the contrary, PC2 (y axis) correlates with the intra-G4 selectivity of each compound, with compounds selective for hybrid and antiparallel G4s locating in the lower part of the plot and compounds selective for parallel G4s locating in the upper part. Interestingly, the loading vectors for parallel G4-RNA (NRAS and TERRA) fall in between those of parallel and hybrid/antiparallel DNA G4s, suggesting an impact of the ribose backbone on the interaction. As can be inferred from the dot distribution in the plot, the mono-styryl motif and the pyrrole substituent within the distyryl motif (1x, 7x) clearly promote the selectivity for the parallel G4 structures. On the other side, the effect of the indole motif is less clear, with most of the dyes not displaying any well-defined preference, except for 1p. This latter compound displays a marked selectivity for hybrid and antiparallel topologies, and in particular for the 22AG target.
Figure 7.
PC1 vs PC2 plot obtained from the principal component analysis of the light-up data matrix for all dyes (ct DNA and cl RNA were excluded, as well as TBA and c-myb due to their low light-up factors). Color coding highlights the distribution of the dyes sharing similar structural motifs.
Topological classification of G4-DNA by dual-dye analysis
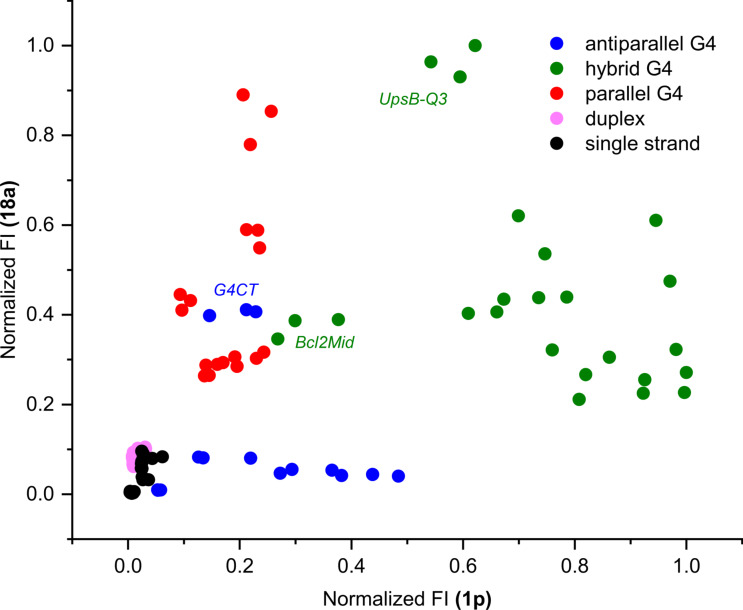
On the basis of screening results, two dyes, namely 1p and 18a, were selected to build a fluorimetric test for conformational classification of DNA oligonucleotides. As discussed above, they present complementary preferences with respect to the analyte groups, with 1p preferentially responding to hybrid and 18a to parallel G4-DNA structures. Moreover, both dyes showed excellent light-up response and selectivity for G4 targets over controls. The concomitant analysis of the response of both dyes should thus allow the sensitive discrimination of different G4 topologies. The response of two dyes was tested against a panel of 33 DNA analytes (Supporting Information File 1, Table S2), comprising some of the previously tested oligonucleotides (c-myc, 25CEB, 22AG, 46AG, TBA, ct DNA). Altogether, the panel of analytes comprehended five conformational groups of roughly equal size, representing the three G4 topologies (parallel, antiparallel and hybrid) as well as single and double strands. RNA targets were excluded from this experiment, even though G4-RNA TERRA triggered the highest fluorescence responses for many dyes. On one side, the interest of G4-RNA topology investigation is limited. In fact, to date, they have never been shown to adopt a structure other than parallel one [84–85]. On the other side, PCA proved that the response of the dyes to RNA targets differs from that to parallel G4-DNA, which might complicate data interpretation.
Emission intensities of both dyes were measured for the new DNA panel in the conditions previously utilized for the screening (2.5 µM dye, 5 µM DNA oligonucleotide, K-100 buffer). The data points corresponding to the oligonucleotides in the set are displayed in a 2D scatter plot (Figure 8), featuring normalized emission intensities of 1p and 18a dyes as x and y axes, respectively. Notably, the oligonucleotides appeared to be grouped in clusters broadly mirroring their conformations. Specifically, parallel G4s cluster in the upper left part of the plot (red dots), as a result of high fluorescence response with 18a and moderate-to-low response with 1p. Hybrid G4s (green dots) produce moderate light-up values for 18a and high ones for 1p, thus clustering on the right side of the plot. Finally, antiparallel G4s (blue dots) locate in the lower left part of the plot, corresponding to almost null emission enhancement by 18a and low one by 1a. Despite the low response to antiparallel G4 structures, these can be still clearly distinguished from double- and single-stranded controls (pink and black dots), to which none of the two dyes proves responsive. A few G4 structures located relatively far from the areas occupied by the respective groups. This is the case of G4CT, Bcl2Mid and, at least partially, UpsB-Q3. In the case of G4CT, previous studies report the existence of an equilibrium between a monomolecular antiparallel form and a bimolecular parallel one, affected by K+ and oligonucleotide concentration [86]. As already suggested, this oligonucleotide is probably present as a mixture of conformations in our working conditions [14]. It is thus likely that the parallel one strongly influences the position of the data in the plot, being better stained by dye 18a. For both Bcl2Mid and UpsB-Q3, CD spectra are partially different from those obtained with typical hybrid G4s, normally related to the telomeric sequence [14]. This might indicate the presence of peculiar structural elements that might as well play a role in determining the probes response. On the overall, the combination of the two probes proved quite efficacious at both (1) distinguishing G4 forming DNA sequences from controls, comprehending randomly generated single strands with varying content of guanine and a wealth of duplex structures, and (2) discriminating G4 structures based on their topology, with the exception of a few notable cases presenting structural peculiarities.
Figure 8.
Dual-dye conformational analysis of an extended panel of 33 DNA oligonucleotides. This is performed on normalized datasets (data referring to each of the two dyes are normalized separately), plotting the resulting fluorescence of compound 18a against that of compound 1p. Data for each target are presented as independent triplicates.
Quantum yield and brightness of the probes
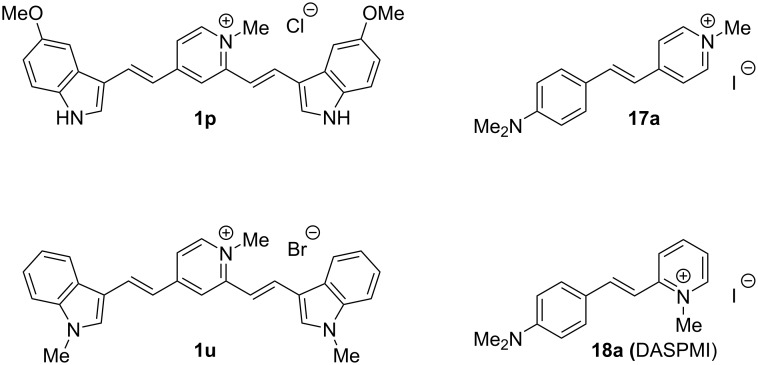
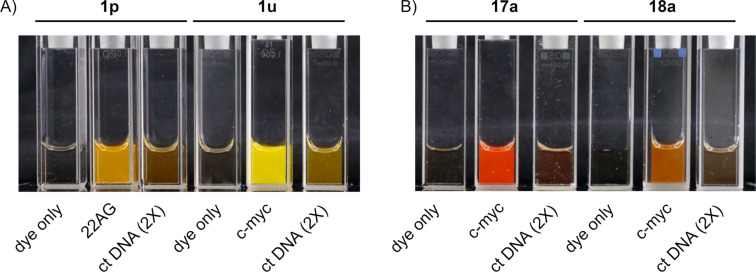
Four highly responsive and G4-selective dyes, namely 1p, 1u, 17a and 18a (Figure 9), were chosen for fluorescence quantum yield and brightness measurements, in order to assess their potential for imaging applications. The quantum yield of dyes was measured in the 1.2–3 µM concentration range, in the absence or in the presence of an excess of two G4-DNA analytes, namely c-myc (parallel G4) or 22AG (hybrid G4), and brightness data were obtained from the multiplication of the corresponding quantum yield by the molar absorptivity coefficient at absorption maxima (εmax) values, for dyes alone and dye–G4 complexes. The obtained data are presented in Table 3. The images of dyes in the absence and in the presence of selected DNA samples are shown in Figure 10.
Figure 9.
Selected probes featuring high fluorimetric response towards G4 structures.
Table 3.
Optical parameters (absorption and emission maxima, Stokes shift, molar absorptivity coefficient at the absorption maximum, fluorescence quantum yield and brightness) of dyes 1p, 1u, 17a and 18a in the absence of DNA or in the presence of G4-DNA structures (c-myc and 22AG).
| Properties | Conditionsa | 1p | 1u | 17a | 18a |
| λmax (abs) [nm]b | c-myc | 501 | 504 | 463 | 450 |
| 22AG | 508 | 497 | 455 | 447 | |
| λmax (em) [nm]c | c-myc | 571 | 560 | 611 | 584 |
| 22AG | 570 | 560 | 606 | 582 | |
| ∆λ [nm]d | c-myc | 70 | 56 | 148 | 134 |
| 22AG | 62 | 63 | 151 | 135 | |
| εmax [103 cm−1 M−1]e | no DNA | 29.3 | 31.0 | 31.5 | 28.4 |
| c-myc | 32.6 | 35.7 | 26.8 | 24.3 | |
| 22AG | 30.6 | 29.2 | 28.6 | 26.6 | |
| Φf | no DNA | 0.0041 | 0.0114 | 0.0015 | 0.0056 |
| c-myc | 0.124 | 0.319 | 0.085 | 0.079 | |
| 22AG | 0.227 | 0.293 | 0.047 | 0.040 | |
| B [103, cm−1 M−1]g | no DNA | 0.12 | 0.35 | 0.047 | 0.16 |
| c-myc | 4.04 | 11.4 | 2.27 | 1.92 | |
| 22AG | 6.95 | 8.56 | 1.34 | 1.06 | |
aWhenever indicated: in the presence of 6 µM of the respective G4-DNA. bAbsorption maximum in K-100 buffer, in the concentration range of 1.2–3 µM. cFluorescence emission maximum (λex = 500 nm). dStokes shift. eMolar absorptivity coefficient at the absorbance maximum for the dye alone or the dye-G4 complex. fFluorescence quantum yield (integration range: 510–800 nm, reference: rhodamine 6G in EtOH). gBrightness (B = εmax × Φ).
Figure 10.
Photographs of solutions of A) distyryl dyes 1p and 1u; B) mono-styryl dyes 17a and 18a, in the absence or in the presence of G4 (22AG or c-myc, 10 µM) or ds DNA (ct DNA, 250 µM bp) upon bottom illumination with UV light (λ = 312 nm); in all cases, c(dye) = 5 µM in K-100 buffer.
All dyes display moderate to good quantum yields and brightnesses upon complexation with both G4 analytes. In more detail, distyryl dyes 1p and 1u prove more performant in this sense, displaying higher quantum yield and brightness (Φ = 0.12 to 0.32, B = (4.0–11.4) × 103 cm−1 M−1) than mono-styryl dyes (Φ = 0.040–0.085, B = (1.1–2.3) × 103 cm−1 M−1). It must be noted that the increase of fluorescence quantum yields observed in the presence of G4-DNA (Φ/Φ0) is significantly lower (up to five-fold) than the corresponding light-up factor measured at a single wavelength (Table S1, Supporting Information File 1). This is typically due to red shifts of absorption and emission spectra of dyes in the presence of nucleic acids, leading to the overestimation of the light-up effect. Nevertheless, single-wavelength light-up factors are of primordial importance for imaging applications, which are performed with a single set of excitation of emission filters. As can be inferred from the data in Table 3, Φ values mirror the selectivity patterns already observed in the screening experiments. In fact, dye 1p in the presence of hybrid G4 (22AG) is roughly twice as fluorescent as its complex with c-myc (Φ = 0.227 and 0.124, respectively). On the other side, complexes of 1u, 17a and 18a with c-myc are more fluorescent than those with 22AG. Among these, 1u certainly forms the brightest and most fluorescent complexes (Φ = 0.32 and 0.29; B = 11.4 and 8.6 × 103 cm−1 M−1 for c-myc and 22AG, respectively). However, the differences observed between the two G4 analytes are narrow, with respect to those observed with the other dyes.
The analysis of absorption spectra also allowed us to quantify the red-shift effect observed for all dyes upon complexation to G4 structures, which is more pronounced for distyryl dyes 1p and 1u (36–45 nm, cf. Table 1 and Table 3) than for mono-styryl dyes 17a and 18a (7–15 nm, cf. Table 1 and Table 3). Moreover, comparison of the absorption maxima with the corresponding emission ones enabled us to calculate the Stokes shifts for the samples. Of note, all compounds display remarkable shifts, ranging from 56 to 151 nm, although these are more pronounced for distyryl dyes (142 nm on average) than for mono-styryl ones (63 nm on average). The combination of the absorption maxima redshift and these high Stokes shifts contributes to make the selected styryl dyes excellent tools for optical imaging.
Discussion
Despite the wealth of scaffolds already reported for the fluorimetric detection of G4 structures, the published studies usually lack a systematic investigation of the factors governing their interaction with DNA and sensing capabilities. In fact, although it is known in broad terms that some molecular features (e.g., size and shape of the aromatic scaffold, charge, redox potential) influence the interaction of dyes with G4-DNA, a thorough assessment of such phenomena by comparative studies is lacking in most reports. In this work, we address this gap within the family of styryl dyes, trying to establish how to construct an optimized dye for G4 sensing. In particular, we studied the optical properties and the fluorimetric response of 61 in-house synthesized compounds against a set of G4-DNA and G4-RNA analytes, as well as the respective non-G4 controls. The data were analyzed aiming at the identification of structural motifs or physical properties (such as aggregation in aqueous medium) of dyes which could govern their fluorimetric response towards one or another group of analytes. Most remarkably, our results demonstrated that a large majority of the dyes (57 out of 61) undergo preferential fluorescence enhancement in the presence of G4 structures, compared with double-stranded (DNA) and single-stranded (RNA) controls (the remaining four dyes did not undergo a fluorescence enhancement with any of the analytes). Can it be considered as a general rule? Considering the significant structural diversity of our library and the related works [41,49], this is highly probable, with regard to mono- and distyryl scaffolds. This implies that styryl-based fluorescent probes initially developed for detection or visualization of DNA, RNA, or other analytes, either in vitro or in cellular imaging applications, must be reassessed in view of their potential strong bias for G4 motifs. Indeed, a remarkable “light-up” effect of SYPRO Orange, a widely used protein stain belonging to the mono-styryl dye family, in the presence of G4-DNA has been reported earlier this year [49]. Moreover, mono-styryls 17a and 18a (the latter also known as DASPMI) are long-known and widely used as mitochondrial stains [87–88] and groove-binding fluorescent probes for double-stranded DNA [89–90]. Herein, we report that the fluorescence enhancement of these dyes induced by parallel G4 structures is dramatically higher compared to ds DNA.
Although the preferential response to G4 structures seems to be an inherent feature of the styryl scaffold, the magnitude of the “light-up” effect drastically varies within the series. Our results clearly point to several structural motifs that appear advantageous for high fluorimetric response and high quantum yield of the probes. First of all, indole substituents, including core-substituted indoles, emerge as the most efficient in this sense, as demonstrated by several distyryls (1o–v) with superior properties with respect to the prototype compound 1a. A similar effect of indole substituents was already observed in the family of mono-styryl dyes developed for detection of double-stranded DNA [68,70,91]. Moreover, pyrrole-substituted distyryls (1x and 7x) also display very high fluorimetric response (up to I/I0 = 690, for 1x–TERRA complex), albeit at the expense of somewhat lower selectivity with respect to ds DNA and ss RNA. It may be suggested that electron-rich heterocyclic substituents (indole and pyrrole) act by lowering the reduction potential of dyes, rendering the photoinduced electron-transfer reaction with guanine residues in DNA energetically disfavored and resulting in higher fluorescence quantum yields. However, in the absence of redox potential data, this assumption could not be experimentally verified. Finally, we showed that the mono-styryl design can yield probes with interesting properties, such as high light-up factors (up to 340, for 17a–c-myc complex) and a clear-cut selectivity for parallel-stranded G4 motifs. Interestingly, in the mono-styryl family, dyes containing indole (17p, 17s) or pyrrole (17x) substituents did not perform better than the simplest styryl derivatives, i.e., 17a and 18a. This fact demonstrates that our data are still insufficient to formulate generalized structure–properties relationships.
Conclusion
To summarize, a systematic analysis enabled us to select the optimal probes within the styryl dye family (i.e., those displaying high quantum yield and brightness, excellent light-up factor, and remarkable selectivity for a certain G4 class). A comparison with literature data demonstrates that dyes 1p and 1u largely outperform, in terms of brightness and quadruplex-vs-duplex selectivity, the widely used fluorescent probes, such as thioflavin T (ThT, Φ = 0.25, in the presence of 22AG/K+ conditions) and thiazole orange (TO, Φ = 0.19 in the presence of 22AG/K+ conditions) [92], and approach the brightest G4-DNA probes developed so far, such as trialryimidazole IZCM-7 (Φ = 0.52, in the presence of c-myc) [52] and the NIR-emitting squaraine dye CAS-C1 (Φ of up to 0.74 with parallel G4-DNA) [93]. Applications of these dyes can be multiple. As an example, we proposed herein the implementation of a simple two-dye array to classify G4-DNA structures based on their topology. Applications in the design of G4-based logic gates could also be envisaged. Taking into account the favorable optical properties, in particular high brightness and large Stokes shift, the same probes could be utilized to proceed to cellular imagining of G4 structures, certainly with caution regarding the inherent propensity of cationic dyes to accumulate in mitochondria. At the same time, our work establishes an approach to optimize the structure of renowned scaffolds and achieve maximal performances in G4 sensing.
Supporting Information
Experimental details and supplementary Tables S1 and S2.
Acknowledgments
The authors thank Ms. Anne Cucchiarini (Institut Curie) for HPLC analysis and Mr. Élie Benchimol for help in the synthesis of the dyes. This work was supported by Institut Curie (post-doctoral fellowship to M.Z.).
This article is part of the thematic issue "Dyes in modern organic chemistry".
References
- 1.Rhodes D, Lipps H J. Nucleic Acids Res. 2015;43:8627–8637. doi: 10.1093/nar/gkv862. [DOI] [PMC free article] [PubMed] [Google Scholar]
- 2.Tian T, Chen Y-Q, Wang S-R, Zhou X. Chem. 2018;4(6):1314–1344. doi: 10.1016/j.chempr.2018.02.014. [DOI] [Google Scholar]
- 3.Mukherjee A K, Sharma S, Chowdhury S. Trends Genet. 2019;35:129–144. doi: 10.1016/j.tig.2018.11.001. [DOI] [PMC free article] [PubMed] [Google Scholar]
- 4.Yatsunyk L A, Mendoza O, Mergny J-L. Acc Chem Res. 2014;47:1836–1844. doi: 10.1021/ar500063x. [DOI] [PubMed] [Google Scholar]
- 5.Mergny J-L, Sen D. Chem Rev. 2019;119:6290–6325. doi: 10.1021/acs.chemrev.8b00629. [DOI] [PubMed] [Google Scholar]
- 6.Renaud de la Faverie A, Guédin A, Bedrat A, Yatsunyk L A, Mergny J-L. Nucleic Acids Res. 2014;42:e65–e65. doi: 10.1093/nar/gku111. [DOI] [PMC free article] [PubMed] [Google Scholar]
- 7.Xu S, Li Q, Xiang J, Yang Q, Sun H, Guan A, Wang L, Liu Y, Yu L, Shi Y, et al. Sci Rep. 2016;6:24793. doi: 10.1038/srep24793. [DOI] [PMC free article] [PubMed] [Google Scholar]
- 8.Kim M, Kreig A, Lee C-Y, Rube H T, Calvert J, Song J S, Myong S. Nucleic Acids Res. 2016;44(10):4807–4817. doi: 10.1093/nar/gkw272. [DOI] [PMC free article] [PubMed] [Google Scholar]
- 9.Hu M-H, Chen S-B, Wang Y-Q, Zeng Y-M, Ou T-M, Li D, Gu L-Q, Huang Z-S, Tan J-H. Biosens Bioelectron. 2016;83:77–84. doi: 10.1016/j.bios.2016.04.029. [DOI] [PubMed] [Google Scholar]
- 10.Chang T, Li W, Ding Z, Cheng S, Liang K, Liu X, Bing T, Shangguan D. Anal Chem (Washington, DC, U S) 2017;89:8162–8169. doi: 10.1021/acs.analchem.7b01992. [DOI] [PubMed] [Google Scholar]
- 11.Sabharwal N C, Savikhin V, Turek-Herman J R, Nicoludis J M, Szalai V A, Yatsunyk L A. FEBS J. 2014;281:1726–1737. doi: 10.1111/febs.12734. [DOI] [PMC free article] [PubMed] [Google Scholar]
- 12.Zhao D, Dong X, Jiang N, Zhang D, Liu C. Nucleic Acids Res. 2014;42:11612–11621. doi: 10.1093/nar/gku833. [DOI] [PMC free article] [PubMed] [Google Scholar]
- 13.Kreig A, Calvert J, Sanoica J, Cullum E, Tipanna R, Myong S. Nucleic Acids Res. 2015;43:7961–7970. doi: 10.1093/nar/gkv749. [DOI] [PMC free article] [PubMed] [Google Scholar]
- 14.Zuffo M, Xie X, Granzhan A. Chem – Eur J. 2019;25:1812–1818. doi: 10.1002/chem.201805422. [DOI] [PubMed] [Google Scholar]
- 15.Endoh T, Rode A B, Takahashi S, Kataoka Y, Kuwahara M, Sugimoto N. Anal Chem (Washington, DC, U S) 2016;88(4):1984–1989. doi: 10.1021/acs.analchem.5b04396. [DOI] [PubMed] [Google Scholar]
- 16.He H-Z, Chan D S-H, Leung C-H, Ma D-L. Nucleic Acids Res. 2013;41(8):4345–4359. doi: 10.1093/nar/gkt108. [DOI] [PMC free article] [PubMed] [Google Scholar]
- 17.Chen H, Sun H, Zhang X, Sun X, Shi Y, Xu S, Tang Y. New J Chem. 2016;40:1940–1943. doi: 10.1039/c5nj02652k. [DOI] [Google Scholar]
- 18.Ma D-L, Chan D S-H, Man B Y-W, Leung C-H. Chem – Asian J. 2011;6:986–1003. doi: 10.1002/asia.201000870. [DOI] [PubMed] [Google Scholar]
- 19.Yeasmin Khusbu F, Zhou X, Chen H, Ma C, Wang K. TrAC, Trends Anal Chem. 2018;109:1–18. doi: 10.1016/j.trac.2018.09.013. [DOI] [Google Scholar]
- 20.Sun X, Li Q, Xiang J, Wang L, Zhang X, Lan L, Xu S, Yang F, Tang Y. Analyst. 2017;142:3352–3355. doi: 10.1039/c7an01062a. [DOI] [PubMed] [Google Scholar]
- 21.Chen H, Zhang X, Sun H, Sun X, Shi Y, Xu S, Tang Y. Analyst. 2015;140:7170–7174. doi: 10.1039/c5an01507c. [DOI] [PubMed] [Google Scholar]
- 22.Lu Y-J, Hu D-P, Deng Q, Wang Z-Y, Huang B-H, Fang Y-X, Zhang K, Wong W-L. Analyst. 2015;140(17):5998–6004. doi: 10.1039/c5an01158b. [DOI] [PubMed] [Google Scholar]
- 23.Sun H, Yu L, Chen H, Xiang J, Zhang X, Shi Y, Yang Q, Guan A, Li Q, Tang Y. Talanta. 2015;136:210–214. doi: 10.1016/j.talanta.2015.01.027. [DOI] [PubMed] [Google Scholar]
- 24.Tseng T-Y, Wang Z-F, Chien C-H, Chang T-C. Nucleic Acids Res. 2013;41:10605–10618. doi: 10.1093/nar/gkt814. [DOI] [PMC free article] [PubMed] [Google Scholar]
- 25.Shivalingam A, Izquierdo M A, Le Marois A, Vyšniauskas A, Suhling K, Kuimova M K, Vilar R. Nat Commun. 2015;6:8178. doi: 10.1038/ncomms9178. [DOI] [PMC free article] [PubMed] [Google Scholar]
- 26.Huang W-C, Tseng T-Y, Chen Y-T, Chang C-C, Wang Z-F, Wang C-L, Hsu T-N, Li P-T, Chen C-T, Lin J-J, et al. Nucleic Acids Res. 2015;43:10102–10113. doi: 10.1093/nar/gkv1061. [DOI] [PMC free article] [PubMed] [Google Scholar]
- 27.Zhang S, Sun H, Wang L, Liu Y, Chen H, Li Q, Guan A, Liu M, Tang Y. Nucleic Acids Res. 2018;46:7522–7532. doi: 10.1093/nar/gky665. [DOI] [PMC free article] [PubMed] [Google Scholar]
- 28.Doria F, Nadai M, Zuffo M, Perrone R, Freccero M, Richter S N. Chem Commun. 2017;53:2268–2271. doi: 10.1039/c6cc08492c. [DOI] [PMC free article] [PubMed] [Google Scholar]
- 29.Yang C, Hu R, Li Q, Li S, Xiang J, Guo X, Wang S, Zeng Y, Li Y, Yang G. ACS Omega. 2018;3:10487–10492. doi: 10.1021/acsomega.8b01190. [DOI] [PMC free article] [PubMed] [Google Scholar]
- 30.Xu S, Li Q, Xiang J, Yang Q, Sun H, Guan A, Wang L, Liu Y, Yu L, Shi Y, et al. Nucleic Acids Res. 2015;43:9575–9586. doi: 10.1093/nar/gkv1040. [DOI] [PMC free article] [PubMed] [Google Scholar]
- 31.Laguerre A, Hukezalie K, Winckler P, Katranji F, Chanteloup G, Pirrotta M, Perrier-Cornet J-M, Wong J M Y, Monchaud D. J Am Chem Soc. 2015;137:8521–8525. doi: 10.1021/jacs.5b03413. [DOI] [PubMed] [Google Scholar]
- 32.Chen S-B, Hu M-H, Liu G-C, Wang J, Ou T-M, Gu L-Q, Huang Z-S, Tan J-H. J Am Chem Soc. 2016;138:10382–10385. doi: 10.1021/jacs.6b04799. [DOI] [PubMed] [Google Scholar]
- 33.Chen X-C, Chen S-B, Dai J, Yuan J-H, Ou T-M, Huang Z-S, Tan J-H. Angew Chem, Int Ed. 2018;57(17):4702–4706. doi: 10.1002/anie.201801999. [DOI] [PubMed] [Google Scholar]
- 34.Ma D-L, Shiu-Hin Chan D, Yang H, He H-Z, Leung C-H. Curr Pharm Des. 2012;18:2058–2075. doi: 10.2174/138161212799958314. [DOI] [PubMed] [Google Scholar]
- 35.Largy E, Granzhan A, Hamon F, Verga D, Teulade-Fichou M-P. Top Curr Chem. 2012:111–177. doi: 10.1007/128_2012_346. [DOI] [PubMed] [Google Scholar]
- 36.Vummidi B R, Alzeer J, Luedtke N W. ChemBioChem. 2013;14:540–558. doi: 10.1002/cbic.201200612. [DOI] [PubMed] [Google Scholar]
- 37.Ma D-L, Zhang Z, Wang M, Lu L, Zhong H-J, Leung C-H. Chem Biol. 2015;22:812–828. doi: 10.1016/j.chembiol.2015.06.016. [DOI] [PubMed] [Google Scholar]
- 38.Suseela Y V, Narayanaswamy N, Pratihar S, Govindaraju T. Chem Soc Rev. 2018;47:1098–1131. doi: 10.1039/c7cs00774d. [DOI] [PubMed] [Google Scholar]
- 39.Chilka P, Desai N, Datta B. Molecules. 2019;24:752. doi: 10.3390/molecules24040752. [DOI] [PMC free article] [PubMed] [Google Scholar]
- 40.Chen X, Wang J, Jiang G, Zu G, Liu M, Zhou L, Pei R. RSC Adv. 2016;6:70117–70123. doi: 10.1039/c6ra11152a. [DOI] [Google Scholar]
- 41.Wang M-Q, Xu J, Zhang L, Liao Y, Wei H, Yin Y-Y, Liu Q, Zhang Y. Bioorg Med Chem. 2019;27(3):552–559. doi: 10.1016/j.bmc.2018.12.037. [DOI] [PubMed] [Google Scholar]
- 42.Guan A-j, Zhang X-F, Sun X, Li Q, Xiang J-F, Wang L-X, Lan L, Yang F-M, Xu S-J, Guo X-M, et al. Sci Rep. 2018;8(1):2666. doi: 10.1038/s41598-018-20960-7. [DOI] [PMC free article] [PubMed] [Google Scholar]
- 43.Yan J-w, Tian Y-g, Tan J-h, Huang Z-s. Analyst. 2015;140(21):7146–7149. doi: 10.1039/c5an01573a. [DOI] [PubMed] [Google Scholar]
- 44.Lin D, Fei X, Gu Y, Wang C, Tang Y, Li R, Zhou J. Analyst. 2015;140:5772–5780. doi: 10.1039/c5an00866b. [DOI] [PubMed] [Google Scholar]
- 45.Ihmels H, Thomas L. Org Biomol Chem. 2013;11:480–487. doi: 10.1039/c2ob26779a. [DOI] [PubMed] [Google Scholar]
- 46.Chen Y, Yan S, Yuan L, Zhou Y, Song Y, Xiao H, Weng X, Zhou X. Org Chem Front. 2014;1:267–270. doi: 10.1039/c3qo00048f. [DOI] [Google Scholar]
- 47.Wang Y-Q, Hu M-H, Guo R-J, Chen S-B, Huang Z-S, Tan J-H. Sens Actuators, B. 2018;266:187–194. doi: 10.1016/j.snb.2018.03.125. [DOI] [Google Scholar]
- 48.Chen S-B, Wu W-B, Hu M-H, Ou T-M, Gu L-Q, Tan J-H, Huang Z-S. Chem Commun. 2014;50(81):12173–12176. doi: 10.1039/c4cc05394j. [DOI] [PubMed] [Google Scholar]
- 49.Deore P S, Manderville R A. New J Chem. 2019;43:4994–4997. doi: 10.1039/c9nj00188c. [DOI] [Google Scholar]
- 50.Wu S, Wang L, Zhang N, Liu Y, Zheng W, Chang A, Wang F, Li S, Shangguan D. Chem – Eur J. 2016;22:6037–6047. doi: 10.1002/chem.201505170. [DOI] [PubMed] [Google Scholar]
- 51.Jiang G, Chen X, Xu L, Cao Y, Hong S, Liu M, Cao W, Pei R. ChemistrySelect. 2017;2:2783–2788. doi: 10.1002/slct.201601889. [DOI] [Google Scholar]
- 52.Hu M-H, Chen S-B, Guo R-J, Ou T-M, Huang Z-S, Tan J-H. Analyst. 2015;140:4616–4625. doi: 10.1039/c5an00761e. [DOI] [PubMed] [Google Scholar]
- 53.Lu Y-J, Wang Z-Y, Hu D-P, Deng Q, Huang B-H, Fang Y-X, Zhang K, Wong W-L, Chow C-F. Dyes Pigm. 2015;122:94–102. doi: 10.1016/j.dyepig.2015.06.018. [DOI] [Google Scholar]
- 54.Zhang L, Er J C, Li X, Heng J J, Samanta A, Chang Y-T, Lee C-L K. Chem Commun. 2015;51:7386–7389. doi: 10.1039/c5cc01601k. [DOI] [PubMed] [Google Scholar]
- 55.Tera M, Hirokawa T, Okabe S, Sugahara K, Seimiya H, Shimamoto K. Chem – Eur J. 2015;21:14519–14528. doi: 10.1002/chem.201501693. [DOI] [PubMed] [Google Scholar]
- 56.Zuffo M, Guédin A, Leriche E-D, Doria F, Pirota V, Gabelica V, Mergny J-L, Freccero M. Nucleic Acids Res. 2018;46:e115–e115. doi: 10.1093/nar/gky607. [DOI] [PMC free article] [PubMed] [Google Scholar]
- 57.Xie X, Reznichenko O, Chaput L, Martin P, Teulade-Fichou M-P, Granzhan A. Chem – Eur J. 2018;24:12638–12651. doi: 10.1002/chem.201801701. [DOI] [PubMed] [Google Scholar]
- 58.Xie X, Choi B, Largy E, Guillot R, Granzhan A, Teulade-Fichou M-P. Chem – Eur J. 2013;19:1214–1226. doi: 10.1002/chem.201203710. [DOI] [PubMed] [Google Scholar]
- 59.Xie X, Renvoisé A, Granzhan A, Teulade-Fichou M-P. New J Chem. 2015;39:5931–5935. doi: 10.1039/c5nj01325a. [DOI] [Google Scholar]
- 60.Das A K, Ihmels H, Kölsch S. Photochem Photobiol Sci. 2019;18:1373–1381. doi: 10.1039/c9pp00096h. [DOI] [PubMed] [Google Scholar]
- 61.Kumari B, Yadav A, Pany S P, Pradeepkumar P I, Kanvah S. J Photochem Photobiol, B. 2019;190:128–136. doi: 10.1016/j.jphotobiol.2018.10.007. [DOI] [PubMed] [Google Scholar]
- 62.Pithan P M, Decker D, Druzhinin S I, Ihmels H, Schönherr H, Voß Y. RSC Adv. 2017;7:10660–10667. doi: 10.1039/c6ra27684a. [DOI] [PMC free article] [PubMed] [Google Scholar]
- 63.Wang M-Q, Liu X-N, Guo Z-J, Feng C, Rui M. New J Chem. 2018;42(7):4933–4939. doi: 10.1039/c8nj00203g. [DOI] [Google Scholar]
- 64.Su J-J, Wang L-Y, Zhang X-H, Fu Y-L, Huang Y, Wei Y-S. J Braz Chem Soc. 2011;22(1):73–79. doi: 10.1590/s0103-50532011000100009. [DOI] [Google Scholar]
- 65.Maçôas E, Marcelo G, Pinto S, Cañeque T, Cuadro A M, Vaquero J J, Martinho J M G. Chem Commun. 2011;47:7374–7376. doi: 10.1039/c1cc12163d. [DOI] [PubMed] [Google Scholar]
- 66.Crippa G B, Verdi T. Ann Chim Appl. 1936;26:418–423. [Google Scholar]
- 67.Clemo G R, Swan G A. J Chem Soc. 1938:1454–1455. doi: 10.1039/jr9380001454. [DOI] [Google Scholar]
- 68.Bohländer P R, Wagenknecht H-A. Org Biomol Chem. 2013;11:7458–7462. doi: 10.1039/c3ob41717d. [DOI] [PubMed] [Google Scholar]
- 69.Bohländer P R, Wagenknecht H-A. Eur J Org Chem. 2014;(34):7547–7551. doi: 10.1002/ejoc.201403119. [DOI] [Google Scholar]
- 70.Bohländer P R, Wagenknecht H-A. Methods Appl Fluoresc. 2015;3:044003. doi: 10.1088/2050-6120/3/4/044003. [DOI] [PubMed] [Google Scholar]
- 71.Kuryavyi V, Phan A T, Patel D J. Nucleic Acids Res. 2010;38:6757–6773. doi: 10.1093/nar/gkq558. [DOI] [PMC free article] [PubMed] [Google Scholar]
- 72.Amrane S, Adrian M, Heddi B, Serero A, Nicolas A, Mergny J, Phan A T. J Am Chem Soc. 2012;134:5807–5816. doi: 10.1021/ja208993r. [DOI] [PubMed] [Google Scholar]
- 73.Phan A T, Kuryavyi V, Burge S, Neidle S, Patel D J. J Am Chem Soc. 2007;129:4386–4392. doi: 10.1021/ja068739h. [DOI] [PMC free article] [PubMed] [Google Scholar]
- 74.Ambrus A, Chen D, Dai J, Jones R A, Yang D. Biochemistry. 2005;44:2048–2058. doi: 10.1021/bi048242p. [DOI] [PubMed] [Google Scholar]
- 75.Rodriguez R, Miller K M, Forment J V, Bradshaw C R, Nikan M, Britton S, Oelschlaegel T, Xhemalce B, Balasubramanian S, Jackson S P. Nat Chem Biol. 2012;8:301–310. doi: 10.1038/nchembio.780. [DOI] [PMC free article] [PubMed] [Google Scholar]
- 76.Murat P, Gormally M V, Sanders D, Di Antonio M, Balasubramanian S. Chem Commun. 2013;49:8453–8455. doi: 10.1039/c3cc44737e. [DOI] [PMC free article] [PubMed] [Google Scholar]
- 77.Matsugami A, Ouhashi K, Kanagawa M, Liu H, Kanagawa S, Uesugi S, Katahira M. J Mol Biol. 2001;313(2):255–269. doi: 10.1006/jmbi.2001.5047. [DOI] [PubMed] [Google Scholar]
- 78.Renčiuk D, Kejnovská I, Školáková P, Bednářová K, Motlová J, Vorlíčková M. Nucleic Acids Res. 2009;37(19):6625–6634. doi: 10.1093/nar/gkp701. [DOI] [PMC free article] [PubMed] [Google Scholar]
- 79.Yue D J E, Lim K W, Phan A T. J Am Chem Soc. 2011;133:11462–11465. doi: 10.1021/ja204197d. [DOI] [PubMed] [Google Scholar]
- 80.Membrino A, Cogoi S, Pedersen E B, Xodo L E. PLoS One. 2011;6:e24421. doi: 10.1371/journal.pone.0024421. [DOI] [PMC free article] [PubMed] [Google Scholar]
- 81.Schultze P, Macaya R F, Feigon J. J Mol Biol. 1994;235:1532–1547. doi: 10.1006/jmbi.1994.1105. [DOI] [PubMed] [Google Scholar]
- 82.Martadinata H, Phan A T. Biochemistry. 2013;52:2176–2183. doi: 10.1021/bi301606u. [DOI] [PubMed] [Google Scholar]
- 83.Kumari S, Bugaut A, Huppert J L, Balasubramanian S. Nat Chem Biol. 2007;3:218–221. doi: 10.1038/nchembio864. [DOI] [PMC free article] [PubMed] [Google Scholar]
- 84.Fay M M, Lyons S M, Ivanov P. J Mol Biol. 2017;429:2127–2147. doi: 10.1016/j.jmb.2017.05.017. [DOI] [PMC free article] [PubMed] [Google Scholar]
- 85.Małgowska M, Czajczynska K, Gudanis D, Tworak A, Gdaniec Z. Acta Biochim Pol. 2016;63(4):609–621. doi: 10.18388/abp.2016_1335. [DOI] [PubMed] [Google Scholar]
- 86.Rehm C, Holder I T, Groß A, Wojciechowski F, Urban M, Sinn M, Drescher M, Hartig J S. Chem Sci. 2014;5:2809–2818. doi: 10.1039/c4sc00440j. [DOI] [Google Scholar]
- 87.Bereiter-Hahn J. Biochim Biophys Acta, Bioenerg. 1976;423:1–14. doi: 10.1016/0005-2728(76)90096-7. [DOI] [PubMed] [Google Scholar]
- 88.Ramadass R, Bereiter-Hahn J. Biophys J. 2008;95:4068–4076. doi: 10.1529/biophysj.108.135079. [DOI] [PMC free article] [PubMed] [Google Scholar]
- 89.Kumar C V, Turner R S, Asuncion E H. J Photochem Photobiol, A. 1993;74:231–238. doi: 10.1016/1010-6030(93)80121-o. [DOI] [Google Scholar]
- 90.Sahoo D, Bhattacharya P, Chakravorti S. J Phys Chem B. 2010;114:2044–2050. doi: 10.1021/jp910766q. [DOI] [PubMed] [Google Scholar]
- 91.Schwechheimer C, Rönicke F, Schepers U, Wagenknecht H-A. Chem Sci. 2018;9:6557–6563. doi: 10.1039/c8sc01574k. [DOI] [PMC free article] [PubMed] [Google Scholar]
- 92.Mohanty J, Barooah N, Dhamodharan V, Harikrishna S, Pradeepkumar P I, Bhasikuttan A C. J Am Chem Soc. 2013;135:367–376. doi: 10.1021/ja309588h. [DOI] [PubMed] [Google Scholar]
- 93.Grande V, Shen C-A, Deiana M, Dudek M, Olesiak-Banska J, Matczyszyn K, Würthner F. Chem Sci. 2018;9(44):8375–8381. doi: 10.1039/c8sc02882f. [DOI] [PMC free article] [PubMed] [Google Scholar]
Associated Data
This section collects any data citations, data availability statements, or supplementary materials included in this article.
Supplementary Materials
Experimental details and supplementary Tables S1 and S2.


