

Abstract
Immune checkpoint blockade (ICB) therapy provides remarkable clinical gains, where melanoma is at the forefront of its success. However, only a subset of patients with advanced tumors currently benefit from these therapies, which at times incur considerable side-effects and costs. Constructing predictors of patient’s response has remained a serious challenge due to the complexity of the immune response and the shortage of large ICB-treated patient cohorts including both omics and response data. Here we build IMPRES, a predictor of ICB-response in melanoma which encompasses 15 pairwise transcriptomics relations between immune checkpoint genes. It is based on two key conjectures: (a) immune mechanisms underlining spontaneous regression in neuroblastoma can predict ICB response in melanoma, and (b) key immune interactions can be captured via specific pairwise relations of immune checkpoint genes’ expression. IMPRES is validated on 9 published datasets1–6 and on a newly generated dataset with 31 patients treated with anti-PD-1 and 10 with anti-CTLA-4, spanning 297 samples in total. It achieves an overall accuracy of AUC=0.83, outperforming existing predictors, capturing almost all true responders while misclassifying less than half of the non-responders. Future studies are warranted to determine the value of the approach presented here in other cancer types.
Life Sciences Reporting Summary
Reporting Summary is available.
Melanoma, even in its metastatic form, is one of a handful of cancers in which spontaneous regression has been frequently observed and has been tightly linked to immune response7,8. This led us to conjecture that the immune components governing spontaneous tumor regression may be a major determinant of immune responses to ICB. To this end, we focused on neuroblastoma (NB), where we could take advantage of an existing cohort of patients with transcriptomic and clinical outcome data. Interestingly, NB in children under 18 months of age manifests frequent spontaneous regression9 that is mediated by cellular immunity, including tumor-infiltrating lymphocytes, tumor-targeted T-cells and anti-neural antibodies10. Moreover, NB is the first pediatric cancer with an FDA-approved immunotherapy (Dinutuximab), a monoclonal antibody targeting the disialoganglioside GD2 that is expressed in NB, melanoma, and other tumors11,12. We thus hypothesized that an immune-based predictor of NB spontaneous regression may effectively predict ICB response in melanoma.
To test this hypothesis we built a predictor of spontaneous regression in NB, analyzing the transcriptomics data of 108 patients. Those include both spontaneously regressing (patients considered as low risk NB and with no tumor progression) and high risk progressing patients (i.e., without spontaneous regression, Methods)13. We focused on 28 immune checkpoint genes collected from the literature that were included in all RNA-sequencing (RNA-seq) datasets available to us (Supp. Table 1). We based the NB predictor on pairwise relations between the (normalized) expression levels of these genes. Each predictive feature compares the expression of two checkpoint genes A and B, capturing a logical relation between their transcriptional levels (e.g., A > B). We performed a feature selection procedure searching for a subset of these features that best separates spontaneously regressing NB patients from those with high risk progressing disease, resulting in 15 most predictive features (Methods). Based on these features, the prediction of spontaneous regression of a tumor sample from its expression data is simply made by counting the number of predictive feature pairs that are fulfilled (true) in that sample given its transcriptomics data. This number, ranging from 0–15, denotes its IMmuno-PREdictive Score (IMPRES), with higher scores predicting spontaneous regression (Supp. Methods; Supp. Table 2). The resulting predictor obtains an accuracy of 0.9 (in terms of the Area Under the Receiver Operator Curve (AUC)) in the NB dataset (Supp. Figure 1, Supp. Methods). Reassuringly, examining tumors derived from patients with melanoma who were not treated with ICB14, the IMPRES scores of patients denoted as ‘high immune response’ are considerably higher than that of other subtypes (Figure 1A). Additionally, we find that IMPRES is significantly and positively associated with higher overall survival in these datasets14 (Figure 1B).
Figure 1.
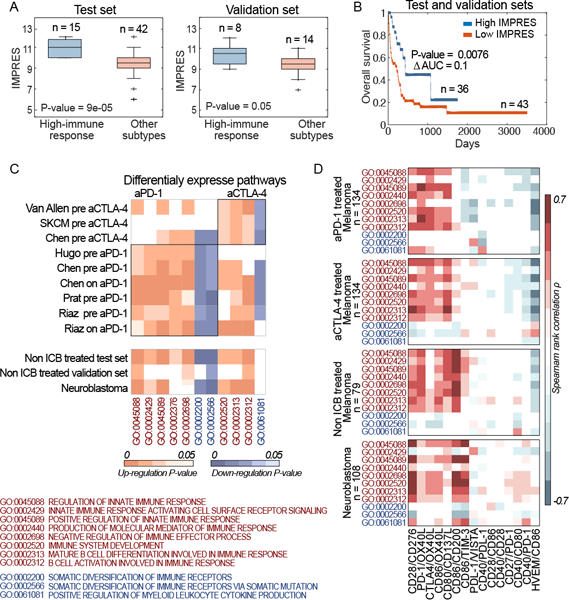
(A) Boxplots showing IMPRES of high vs low immune response in test and validation datasets of non-ICB treated melanoma patients14; P-values are computed via a one-sided Rank-sum test. Boxplots centre lines indicate medians, box edges represent the interquartile range, whiskers extend to the most extreme data points not considered outliers, and the outliers are plotted individually using the ’+’ symbol. (B) Kaplan-Meier survival curves of patients with high versus low IMPRES (computed over the combined test and validation datasets14). The median IMPRES is used to define the “Low IMPRES” and “High IMPRES” subgroups. The P-value is computed via a two-sided log-rank test. (C) Upper Panel: Heatmaps showing the enrichment P-values for CDPs that are up (orange) or down (purple) regulated in responders versus non-responders across the anti-PD-1 (encapsulated in the left rectangle) and the anti-CTLA-4 melanoma datasets1,3,4,6 (right rectangle). The lower Panel displays the enrichment P-values for these CDPs in high immune response vs other subtypes in non-ICB treated melanoma, and in spontaneous regression vs non-spontaneous regression in the NB dataset. (D) Heatmaps showing the rank correlation ρ between expression levels of each CDP (vertical axis) and each of the IMPRES features ratios (horizontal axis), computed separately over the anti-PD-1 datasets, the anti-CTLA-4 datasets, the non-ICB treated melanoma datasets and the neuroblastoma dataset. White-colored entries denote non-statistically significant associations.
We next turned to investigate whether there are similarities between the cellular processes mediating spontaneous tumor regression in NB and those mediating spontaneous and ICB-stimulated immune response in melanoma, studying 9 different melanoma datasets1–6. To this end we identified immune related, Consistently Differentially expressed Pathways (termed CDPs) in ICB responders versus non-responders (evaluated separately for patients treated with anti-PD-1 or anti-CTLA-4 treatments, Methods). We identified seven CDPs that are common across all anti-PD-1 datasets and four CDPs across all anti-CTLA-4 datasets. We find that these CDPs are also differentially expressed in a similar manner in the ‘high immune response’ melanomas compared with other subtypes14 and in spontaneously regressing vs high risk progressing NB tumors (Figure 1C, Supp. Table 3) (Methods; see Supp. Material, Supp. Table 4 and Supp. Figure 2 for a related analysis based on estimated immune cell abundances). We then computed the correlations between each IMPRES feature (using expression ratios, Methods) and the expression of each of the CDPs. As evident from Figure 1D, these associations are consistently maintained across the four sample groups studied.
We then turned to apply IMPRES to predict melanoma patients’ response to ICB, without any further training. To this end we analyzed 256 samples from 9 datasets derived from 6 independent studies including patients treated with anti-CTLA-4, anti-PD1 or their combination1–6. We computed the IMPRES score of each melanoma sample from its expression data and used those and the clinical response data to generate the Receiver Operator Characteristic (ROC) classification curves quantifying IMPRES prediction performance in each of the different datasets. The resulting AUCs are in the range 0.77–0.96 (Figure 2A).
Figure 2.
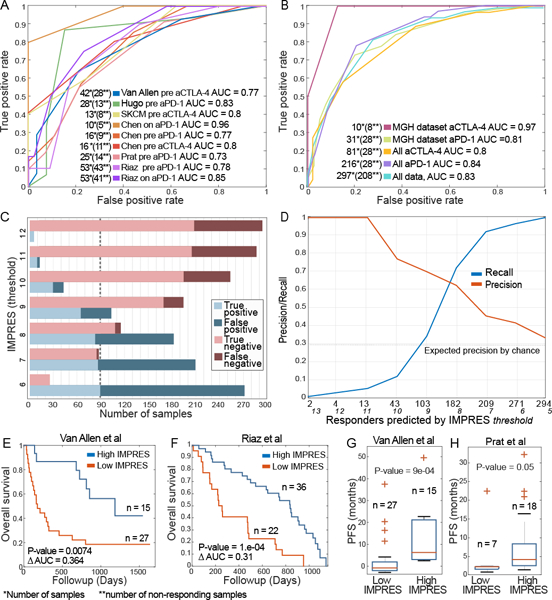
(A) Receiver Operating Characteristic (ROC) curves quantifying IMPRES prediction AUC across numerous publically available ICB response datasets1–6. (B) ROC curves for the MGH dataset of ICB response (with 10 patients treated with anti-CTLA-4 and 31 patients treated with anti-PD-1) and for the aggregate datasets including all 297 samples, the 216 samples of patients treated with anti-PD-1 and 81 with anti-CTLA-4. (C) Bar plots showing the prediction accuracy and error types for different IMPRES thresholds (where a positive label corresponds to a ‘responder’ prediction) on the aggregate compendium of 297 patients included in all 11 datasets studied. The dashed line represents the total number of responders. (D) Precision/recall evaluation of IMPRES on the same aggregate compendium. The Y-axis displays the precision/recall as a function of the number of ‘responder’ predictions made (shown on the X-axis, obtained by decreasing the classification threshold, whose value is also displayed in italic font). Prediction performance in terms of specificity and sensitivity values is provided in Supp. Table 5. (E)-(F) Kaplan Meier survival curves for the ICB treatment datasets1,6, with high vs. low IMPRES scores (using the median IMPRES as a threshold differentiating between the high and low groups). The P-values are computed via a two-sided log-rank test. (G)-(H) Boxplots comparing progression free survival between low vs. high IMPRES in the ICB1,5 datasets (using the median IMPRES as a differentiating threshold). P-values are computed via a one-sided Rank-sum test. Boxplots centre lines indicate medians, box edges represent the interquartile range, whiskers extend to the most extreme data points not considered outliers, and the outliers are plotted individually using the ’+’ symbol.
We further tested the predictive ability of IMPRES in a newly generated RNA-seq data of tumor biopsies from metastatic melanoma patients treated with ICB therapies at the Massachusetts General Hospital. IMPRES achieves AUCs of 0.81 and 0.97 on the anti-PD-1 and anti-CTLA-4 samples respectively (Figure 2B). It maintains its predictive accuracy when evaluating the aggregate collection of the datasets studied above (a total of 297 samples, Figure 2B). Figure 2C shows the number of true/false positives (responders) and true/false negatives (non-responders) obtained on this aggregated data at different IMPRES score classification thresholds, manifesting the well-known tradeoff between precision and recall (Figure 2D, Supp. Figure 3A-B, Supp. Table 5). As evident, IMPRES can capture almost all true responders while misclassifying less than half of the non-responders (at threshold = 8). Higher IMPRES scores are also associated with improved overall survival and progression-free survival (PFS) in ICB treated melanoma patients (Methods, Figure 2E-H, Supp. Figure 3C).
To compare the predictive accuracy of IMPRES with that of current transcriptome-based predictors, we generated predictors of response to ICB for each published transcriptomic signature (Supp. Methods). The performance of IMPRES is superior to the other predictors (Figure 3A, Supp. Table 6). This observation also holds true when we compare the performances on each ICB-treatment group separately (Figure 3B). Overall, the predictors built on biologically motivated scores (cytolytic-activity15 and PDL-1 expression) generalize better than the machine learning based predictors constructed on transcriptomic signatures identified in the specific cohorts. Of note, while we find a significant correlation between IMPRES and CD8+ and CD4+ T cells abundances inferred via CIBERSORT, the latter are poor predictors of ICB response (Supp. Figure 4). IMPRES superiority is particularly notable because for most existing signature-based predictors (all but cytolytic-activity15 and PDL-1 expression) we had to re-train the latter separately for each dataset, otherwise their overall performance was dismal, testifying to their poor generalizability between different datasets (Methods). In contrast, IMPRES is constructed only once from the NB data and never trained on any melanoma dataset. Thus, it is markedly less prone to over-fitting, a paramount concern regarding standard cancer transcriptomics predictors16–18. To further study the importance of training on the independent NB data, we trained ICB response predictors based on melanoma data instead of NB, following exactly the same representation and training procedure as used in IMPRES. This results in markedly lower prediction performances on the melanoma datasets that were not used for training compared to the original IMPRES procedure (Supp. Figure 5). Finally, IMPRES performance remains superior when repeating this comparative analysis while excluding patients annotated with ‘stable disease’ (Supp. Table 6).
Figure 3.
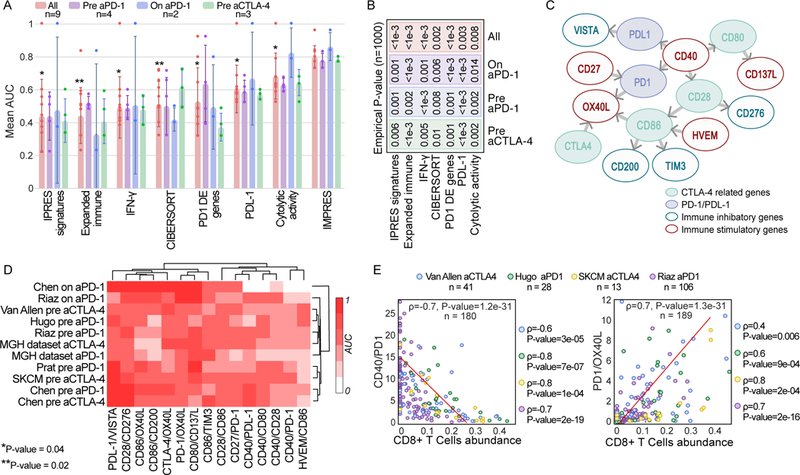
(A) AUC of IMPRES and other published predictors across 9 publicly available ICB treatment datasets grouped by treatment type and stage (pre and on stands for before and during ICB treatment). The one-sided Rank-sum P-values comparing the performance of each predictor evaluated to that of IMPRES over all datasets are presented (P-value of 0.002 is achieved when IMPRES AUC is larger than that obtained by the other predictor for all 9 datasets, and 0.004 when it is larger for 8/9 datasets). Bar centre is defined by the mean and error bars via SD. (B) The empirical P-values comparing IMPRES performance to that of each of the other predictors in the three different ICB treatment classes and for the aggregate of all datasets (using n=1000 permutations, the value of ‘<1e-3’ denotes that IMPRES’ prediction performance was superior to that of the predictor with which it was compared in all 1,000 repetitions). (C) A network representation of the 15 pairwise features comprising IMPRES. Each node represents an immune checkpoint gene and each edge describes a pairwise relation (an IMPRES feature). The direction of edge A -> B denotes that the higher expression of A vs. that of B is associated with better patients’ response. The color of the outline of each node denotes if it is inhibitory or activating and its fill color denotes whether it belongs to the PD1 or CTLA-4 pathways. (D) Clustogram (with average linkage function) of the individual predictive power of the 15 IMPRES features (based on their expression ratios) in each of the melanoma treatment datasets studied (the color scaling denotes the AUC obtained using each individual ratio as a response predictor, ranging from 0 to 1). (E) Scatter plots showing the correlation between CIBERSORT-inferred CD8+ T cells abundance (X-axis) and the gene expression ratios of two IMPRES features that are significantly associated with it (Y-axis); CD40/PD1 (upper panel) and PD1/OX40L lower panel). The Spearman ρ and associated P-values are shown for each ICB response data1,3,4,6 individually (on the right) and for all four datasets together (in the plot)
The features composing IMPRES uncover a few insights that are biologically interesting. Reassuringly, the relatively higher expression of genes encoding immune stimulatory molecules (such as HVEM, CD27 and CD40) is associated with a better response to ICB, while the higher expression of genes encoding immune inhibitory molecules (such as CD276, TIM-3, CD200 and VISTA) is associated with a worse response, as expected (Figure 3C). Higher expression of CD40 compared to that of PD-1, PDL-1, CD80 and CD28 is associated with a better ICB response, in line with the recent findings that agonists of CD40 reverse resistance to anti-PD-1 therapy, and that induced PD-1 expression mediates acquired resistance to antagonist CD40 treatment19. Additionally, the higher expression of CD27 compared to that of PD1 (but not compared to CTLA-4) is associated with improved response. This is in line with recent findings that the combination of a CD27 agonist plus anti-PD-1 recapitulates the effects of CD4+ T helper cells on tumor control, while the combination of a CD27 agonist plus anti-CTLA-4 did not improve tumor control20.
We further studied the individual predictive power of the IMPRES features by considering the expression ratio of each predictive pair (Methods). We find that some features are specifically more predictive for anti-PD-1 pre-treatment (CD28/CD86, Rank-sum P-value = 0.05) or on-treatment (PD1/OX40L, CD86/OX40L and CD86/CD200, Rank-sum P-value = 0.018 for all, Supp. Table 7C). Notably, no feature emerges as being strongly predictive of response to anti-CTLA-4 specifically (Figure 3D, Supp. Table 7C). Examining the associations between these 15 features (using their expression ratio) and the inferred abundance of 22 types of immune cells (Supp. Table 4) uncovers two significant associations, with CD40/PD-1 and PD1/OX40L (Figure 3E). Finally, a feature reduction analysis (Supp. Methods) shows that the overall predictive performance of IMPRES can be maintained with a subset of 11 of the 15 original features, but beyond that it markedly decreases (Supp. Figure 6, Supp. Table 8).
In summary, IMPRES’ high predictive performance is mainly due to two key conjectures: (a) key immune mechanisms underlining spontaneous regression in NB are shared with those determining response to ICB in melanoma, and (b) those may be captured by specific pairwise relations of immune checkpoint genes’ expression. Building on these assumptions leads to a predictor of response to checkpoint therapy that is significantly superior to existing predictors and displays robust performance across many different melanoma datasets. From a translational standpoint, we show that IMPRES can correctly capture almost all true responders while misclassifying less than half of the non-responders. Future studies are warranted to further study the predictive performance of the approach presented here in other cancer types where ICB is approved, as sufficiently large datasets are accumulated.
Online Methods
Ethics statement
All clinical data and patient samples were collected following approval by the Massachusetts General Hospital Institutional Review Board (IRB). In all cases informed consent was obtained from patients.
Statistical analyses
Boxplots and comparisons. For all boxplots, centre lines indicate medians, box edges represent the interquartile range, whiskers extend to the most extreme data points not considered outliers, and the outliers are plotted individually using the ’+’ symbol. Points are defined as outliers if they are greater than q3 + w × (q3 – q1) or less than q1 – w × (q3 – q1), where w is the maximum whisker length, and q1 and q3 are the 25th and 75th percentiles of the sample data, respectively. All differential expression and distribution comparisons P-values are obtained via one-sided Rank-sum test.
Survival analyses. All Kaplan Meier analyses are performed by comparing the survival of patients with high scores (> median) to those with low scores (< median) using a two-sided log-rank test. The patients with median score (= median) are grouped with the smaller-size group among the two groups mentioned above.
Bar plots. For bar plots, centre is defined by the mean of the distribution and error bars represents the SD of the distribution.
Correlation coefficients. All correlations coefficients and P-values are obtained via Spearman rank correlation test.
Collection of immune checkpoint molecules
To build a predictor based on pair-wise relations between checkpoint genes’ expression, we formed a list of 45 immune checkpoint genes with known co-stimulatory or co inhibitory effects, collected from literature reports 21–24. From these, we focus on 28 genes that were measured in all RNA-sequencing datasets analyzed in this paper (Supp. Table 1).
Feature selection and IMPRES construction on the NB data
For feature selection, we use the quantile-normalized expression of the 28 immune checkpoint genes selected above in the 108 NB tumor samples studied (Supp. Methods), using the following expression function of pairs of checkpoint genes as features:
Where and denote the expression of genesandin sample .
We focus on pairs where at least one of the genes is among the six genes that are directly associated with anti-CTLA-4 and anti-PD1 blockade therapy, including CTLA-4, CD28, CD80/CD86, PD-1 and PD-L125, which together form 294 potential gene pairs. To select features that best separate positive from negative samples in the NB data, we performed a hill climbing aggregative feature selection involving 500 iterations of a five-fold cross validation procedure, where the features that highly scored consistently across folds were selected for IMPRES. A detailed description of the feature selection steps is available in the Supp. Methods.
Immune pathway enrichment analysis
To identify CDPs (consistently differentially expressed immune pathways in melanoma ICB responders), we first identified the genes that are up and down regulated in ICB responders vs non-responders for each of the datasets1,3,4,6 (using one sided Rank-sum P-value<0.05). Then, we performed a GO pathway26 enrichment analysis for immune related pathways (Supp. Table 3) via a hyper-geometric test, to identify (1) pathways that are consistently up or down regulated (hyper-geometric P-value<0.05) in responders for all anti-PD-1 melanoma datasets, and (2) pathways that are consistently up or down regulated in responders for all anti-CTLA-4 melanoma datasets (Figure 1C, Supp. Table 3).
To correlate CDPs with the IMPRES features, we then evaluated the Spearman rank correlation coefficients () and corresponding P-values between the median pathway expression level of each CDP (using the median expression of all genes in a pathway) and each of the IMPRES expression ratios. This is done across all samples in each of the following datasets: (1) the anti-PD-1 treated melanoma datasets (2) the anti-CTLA-4 treated melanoma datasets (3) the non ICB-treated melanoma datasets and (4) the neuroblastoma dataset.
Computing IMPRES features’ expression ratio
To evaluate the predictive performance and functional associations of individual IMPRES features in a more refined manner we used the expression ratio instead of the binary indicators in each sample (i.e. for each feature A>B we used A/B instead). The resulting AUCs obtained with each ratio feature for each ICB response data are presented in Figure 3D and Supp. Table 7B.
CIBERSORT analysis
Using CIBERSORT27 we infer the relative abundances of 22 immune cells in NB and melanoma samples (analyzing each dataset for ICB treated and non-treated melanoma). Having estimated these cell abundances for each sample, we perform the following analyses:
We perform a differential abundance analysis via a one-sided Rank-sum test for each immune cell type between NB samples with or without spontaneous regression, between melanoma samples who respond or do not respond to ICB treatment, and between high immune response versus other subtypes in non ICB-treated melanoma samples (Supp. Table 4).
To study the relation between IMPRES and major T cell types mediating the immune response, we correlate the CIBERSORT inferred relative abundances of CD8+ and CD4+ T-cells to IMPRES scores for RNA-seq melanoma ICB response datasets via Spearman rank-correlation (Supp. Figure 4)
To survey the key associations between IMPRES features and immune subtypes, we correlate each CIBERSORT inferred immune cell type to each IMPRES feature (considering expression ratios instead of binary relations), for RNA-seq melanoma ICB response datasets via Spearman rank-correlation (Supp. Table 4).
Applying IMPRES to predict ICB response of melanoma patients
To apply IMPRES, we calculate for each sample , the over the 15 IMPRES checkpoint pairs (features). This leads to a binary vector of length 15 for each sample. The total number of ‘1’s in this vector denotes the sample’s IMPRES score (ranging between 0 and 15). High scores predict good response. By varying the classification threshold over the different possible IMPRES score values we generate the ROC curves and the resulting AUCs presented in the main text for each melanoma dataset.
RNA-seq
RNA-sequencing of 31 anti-PD-1 pre-and on-treatment tumor specimens, and 10 anti-CTLA-4 pre-and on-treatment metastatic tumor specimens (for which the response is known) derived from patients with metastatic melanoma (up to 90 days from treatment start) was conducted as previously described in Jenkins et al28 (Supp. Table 9). These patients were enrolled in clinical trials at Massachusetts General Hospital. Clinical trial registration numbers at ClinicalTrials.gov are NCT01714739; NCT02083484; NCT01543698; NCT01072175; NCT00949702; NCT01783938; NCT01006980.
Clinical response classification
Table 1 enclosed by summarizes the response annotations and criteria used for establishing them in the original study. The response classification of each patient in each of the publicly available studies and the MGH dataset (with MGH patients clinical information) is described in Supp. Table 9.
Table 1.
Response annotations for each melanoma dataset
| Van Allen et al. |
Hugo et al. | TCGA SKCM |
Chen et al. | Prat et al. | Riaz et al. | MGH dataset |
|
|---|---|---|---|---|---|---|---|
| classified as “response” | ‘response’, | ‘Complete Response’, ‘Partial Response’ | ‘Complete Response’, ‘Partial Response’ | ’R’ = freedom from disease/ decreased tumor > 6 months | ‘CR’, ‘PR’ | ’CR’, ‘PR’ | ’CR’, ‘PR’ |
| classified as “non-response” | ‘nonresponse’,’long-survival’ | ’Progressive Disease’ | ’Clinical Progressive Disease’, ‘Stable Disease’ | ’NR’ = tumor growth on serial CT scans or a clinical benefit lasting 6 months or less | ’PD’ | ’PD’, ‘SD’ | ’PD’ |
| Protocol | irRECIST29 | RECIST30 | RECIST30 | Nan | RECIST30 | RECIST30 | RECIST30 |
Applying IMPRES to predict melanoma patients’ response to ICB treatments on the combined, aggregate collection of all melanoma samples
To apply IMPRES and evaluate its predictive performance on the combination of melanoma samples in all eleven datasets studied, we normalize the IMPRES scores for datasets in which not all relevant checkpoint genes were measured (Supp. Table 1). This normalization is done by linearly scaling the IMPRES score to compensate for the number of missing pairs whose expression is not available in the dataset. For example, if 13 out of the 15 IMPRES features are measured in a dataset, then the IMPRES score of these samples is multiplied by 15 and divided by 13 to linearly scale it back to the original scale of 0–15. We then calculate the AUC in a standard manner using these normalized IMPRES scores over all samples.
Training a predictor using melanoma datasets
We use a similar training procedure as described above for IMPRES (using binary relations (A>B) between the 28 checkpoint genes as before), but this time training on melanoma datasets: (1) First we train on the combined data from Riaz et al6 and Hugo et al9 (both anti-PD-1 datasets) and (2) we then train on the combined datasets from Hugo et al. and Van Allen et al.1,3 (anti-PD-1 and anti-CTLA-4 datasets, respectively). For both, we use hill climbing feature selection and perform similar procedure as described above in ‘Feature selection and IMPRES construction on the NB data’, of 500 rounds of five-fold training and testing. The final feature set is also selected in the same manner (using similar definition of and selecting features with binomial p-value < 0.05).
IMPRES analysis of different melanoma subtypes
We evaluate whether IMPRES significantly differs between different melanoma subtypes by comparing IMPRES scores of each subtype against that of all other subtypes, when using pre anti-PD-1, on anti-PD-1 and all samples from Riaz et al (Supp. Figure 7) 6.
Comparing IMPRES predictive performance to that obtained by predictors based on other published signatures
We compare the performance of IMPRES to those obtained using other published transcriptomic signatures3,15,31 as well as PDL-1 expression. We additionally evaluate the performance of a predictor based on immune cell abundances estimated via CIBERSORT27. The predictors’ performance is evaluated using the nine publicly available melanoma datasets analyzed to evaluate IMPRES (see main text). The Cytolytic activity15 and PDL1 expression based predictors are applied in a straightforward manner, analogous to that of IMPRES as they do not require additional training. However, making predictions using gene signatures reported in specific studies in the literature (see main text) requires training on every specific dataset tested (using cross validation), aiming to identify their maximal performance levels. Hence, we build predictors of ICB response using Support Vector Machines (SVMs) on each of the pertaining melanoma datasets. Each such SVM predictor is built using the genes in the specific signatures on which it is based as its feature set. This is performed with linear kernels using 100 repetitions of a five-fold cross validation process, where in each fold the training set and test set are randomly selected. The AUC presented for each predictor is the mean AUC overall repetitions (Supp. Table 6, upper panel).
To compare IMPRES performance to that of other predictors over different treatment groups in a systematic manner, we aggregate the samples into four treatment groups: pre anti-CTLA-4, pre anti-PD-1, on anti-PD-1 and all samples. To calculate an empirical P-value, we then perform 1000 repetition of: (1) randomly sampling 80% of the samples in a stratified manner (maintaining the proportion of responders vs. non-responders) from each treatment group and (2) evaluating the AUC resulting from each predictor on the randomly selected samples from each treatment group. The resulting empirical P-value (reported in Figure 3B) denotes the percentage of iterations in which the AUC obtained via each predictor is superior to that obtained using IMPRES for each treatment group.
Feature reduction analysis
As IMPRES features were selected for NB, it is possible that some are less predictive for melanoma response. To investigate which features may be removed, we performed a feature removal procedure using 5-fold cross validation on the combined data from all 5 RNAseq datasets 1,3,4,6 (as these cover all IMPRES features). In each fold we performed 500 rounds of greedy (hill climbing) feature removal on the training set, each round ended when the performance (AUC) has been reduced by more than 5% from the full set performance on the training set. The set of remaining features was applied to the test set to obtain a test-AUC. We find a group of 11 features that captures most of IMPRES original performance levels (Supp. Figure 6, Supp. Table 8). All groups with less than 11 features have reduced the test-AUC by more than 5%.
IMPRES sensitivity analysis and random control predictors
To evaluate IMPRES sensitivity to missing features, we perform all possible removals of single, double, triple and quadruple features. For each removal, we examine the AUCs obtained with the remaining features for each of the 11 datasets. We find that while the results remain robust for most single and double feature removals, higher order removals are likely to significantly reduce the performance but not in all cases (e.g., as the reduced features set, Supp. Figure 6,Supp. Table 10).
To evaluate the power of predictors constructed via randomly selected relations, we generate 1000 predictors, each based on randomly selected 15 immune gene relations (drawing from the same pool of features as those considered for the construction of IMPRES, Supp. Figure 8).
Principle Component Analysis (PCA) using IMPRES features
We perform PCA of patient profiles for each melanoma ICB study and across all studies combined using IMPRES selected features (i.e., each sample is represented as a 15-dimensional binary vector comprised of the 15 IMPRES logical relations). The PCA results are presented in Supp. Figure 9.
Comparing IMPRES scores to mutational counts across TCGA tumors
Examining pan-cancer TCGA data, we find that cancer types with high IMPRES scores tend to have a higher mutational burden, a well-established marker of response to immunotherapy (Spearman Rho = 0.79, Supp. Figure 10). To perform this analysis, the complete raw data of all TCGA cancer types (n=23) which include at least 100 patients were downloaded from cBioPortal32. We considered samples containing somatic point mutations and gene expression data, relative to matched-normal samples.
Supplementary Material
Acknowledgments
The authors thank Max Leiserson, Sushant Patkar, Erez Persi, Welles Robinson, Ze’ev Ronai, Yonatan Saadon, Yardena Samuels and John Wherry for their helpful comments. N.A, J.S.L and E.R were partially supported by a grant from the Israeli Science Foundation (ISF, grant No 41/11) and R33-CA225291–01. E.R is supported by the intramural program at the CCR, NCI. N.A is supported by the NCI-UMD partnership for integrative cancer research. M.H and K.F. are supported by Dr. Miriam and Sheldon G. Adelson Medical Research Foundation. M.H. is supported by National Institutes of Health Grants 5P01CA114046, 5P50CA174523 and 1U54CA224070, and Peer Reviewed Cancer Research Program Grant WX1XWH-16–1-0119 [CA150619].
Footnotes
Competing financial interests
The authors have no competing interests as defined by Nature Research, or other interests that might be perceived to influence the results and/or discussion reported in this paper.
Accession Codes
Code availability
Codes are implemented in MATLAB and are publicly available in GitHub:
https://github.com/noamaus/IMPRES-codes
The CIBERSORT software was applied on matrices of gene expression data using the given LM22 immune cell signatures.
Data availability statement
All patients data analyzed from published papers are referenced to and publicly available accordingly. The transcriptomic data of the MGH patients analyzed are available from GEO (GSE115821). MGH patients’ clinical information is available in Supp. Table 9.
References
- 1.Van Allen EM et al. Genomic correlates of response to CTLA-4 blockade in metastatic melanoma. Science (80-. ). 350, 207–211 (2015). [DOI] [PMC free article] [PubMed] [Google Scholar]
- 2.Chen PL et al. Analysis of immune signatures in longitudinal tumor samples yields insight into biomarkers of response and mechanisms of resistance to immune checkpoint blockade. Cancer Discov. 6, 827–837 (2016). [DOI] [PMC free article] [PubMed] [Google Scholar]
- 3.Hugo W et al. Genomic and Transcriptomic Features of Response to Anti-PD-1 Therapy in Metastatic Melanoma. Cell 165, 35–44 (2016). [DOI] [PMC free article] [PubMed] [Google Scholar]
- 4.Weinstein JN et al. The Cancer Genome Atlas Pan-Cancer analysis project. Nat. Genet. 45, 1113–20 (2013). [DOI] [PMC free article] [PubMed] [Google Scholar]
- 5.Prat A et al. Immune-related gene expression profiling after PD-1 blockade in non–small cell lung carcinoma, head and neck squamous cell carcinoma, and melanoma. Cancer Res. 77, 3540–3550 (2017). [DOI] [PubMed] [Google Scholar]
- 6.Riaz N et al. Tumor and Microenvironment Evolution during Immunotherapy with Nivolumab. Cell (2017). doi: 10.1016/j.cell.2017.09.028 [DOI] [PMC free article] [PubMed] [Google Scholar]
- 7.Bramhall RJ, Mahady K & Peach AHS Spontaneous regression of metastatic melanoma -Clinical evidence of the abscopal effect. Eur. J. Surg. Oncol. 40, 34–41 (2014). [DOI] [PubMed] [Google Scholar]
- 8.Kalialis LV, Drzewiecki KT & Klyver H Spontaneous regression of metastases from melanoma: review of the literature. Melanoma Res. 19, 275–282 (2009). [DOI] [PubMed] [Google Scholar]
- 9.Diede SJ Spontaneous regression of metastatic cancer: learning from neuroblastoma. Nat. Rev. Cancer 14, 71–2 (2014). [DOI] [PubMed] [Google Scholar]
- 10.Brodeur GM & Bagatell R Mechanisms of neuroblastoma regression. Nat. Rev. Clin. Oncol. 11, 704–713 (2014). [DOI] [PMC free article] [PubMed] [Google Scholar]
- 11.Cheung NKV et al. Ganglioside G(D2) specific monoclonal antibody 3F8: A phase I study in patients with neuroblastoma and malignant melanoma. Journal of Clinical Oncology 5, 1430–1440 (1987). [DOI] [PubMed] [Google Scholar]
- 12.Yu AL et al. Anti-GD2 Antibody with GM-CSF, Interleukin-2, and Isotretinoin for Neuroblastoma. N. Engl. J. Med. 363, 1324–1334 (2010). [DOI] [PMC free article] [PubMed] [Google Scholar]
- 13.Su Z et al. An investigation of biomarkers derived from legacy microarray data for their utility in the RNA-seq era. Genome Biol. 15, 523 (2014). [DOI] [PMC free article] [PubMed] [Google Scholar]
- 14.Jönsson G et al. Gene expression profiling-based identification of molecular subtypes in stage IV melanomas with different clinical outcome. Clin. Cancer Res. 16, 3356–3367 (2010). [DOI] [PubMed] [Google Scholar]
- 15.Rooney MS, Shukla SA, Wu CJ, Getz G & Hacohen N Molecular and genetic properties of tumors associated with local immune cytolytic activity. Cell 160, 48–61 (2015). [DOI] [PMC free article] [PubMed] [Google Scholar]
- 16.Simon R, Radmacher MD, Dobbin K & McShane LM Pitfalls in the use of DNA microarray data for diagnostic and prognostic classification. J. Natl. Cancer Inst. 95, 14–18 (2003). [DOI] [PubMed] [Google Scholar]
- 17.Tinker AV, Boussioutas A & Bowtell DDL The challenges of gene expression microarrays for the study of human cancer. Cancer Cell 9, 333–339 (2006). [DOI] [PubMed] [Google Scholar]
- 18.Ransohoff DF Bias as a threat to the validity of cancer molecular-marker research. Nat. Rev. Cancer 5, 142–149 (2005). [DOI] [PubMed] [Google Scholar]
- 19.Zippelius A, Schreiner J, Herzig P & Muller P Induced PD-L1 Expression Mediates Acquired Resistance to Agonistic Anti-CD40 Treatment. Cancer Immunol. Res. 3, 236–244 (2015). [DOI] [PubMed] [Google Scholar]
- 20.Ahrends T et al. CD27 Agonism Plus PD-1 Blockade Recapitulates CD4+ T-cell Help in Therapeutic Anticancer Vaccination. Cancer Res. 76, 2921–2931 (2016). [DOI] [PubMed] [Google Scholar]
Online Methods references
- 21.Chen L & Flies DB Molecular mechanisms of T cell co-stimulation and co-inhibition. Nature Reviews Immunology 13, 227–242 (2013). [DOI] [PMC free article] [PubMed] [Google Scholar]
- 22.Zhang Q & Vignali DAA Co-stimulatory and Co-inhibitory Pathways in Autoimmunity. Immunity 44, 1034–1051 (2016). [DOI] [PMC free article] [PubMed] [Google Scholar]
- 23.Fuertes Marraco SA, Neubert NJ, Verdeil G & Speiser DE Inhibitory receptors beyond T cell exhaustion. Frontiers in Immunology 6, (2015). [DOI] [PMC free article] [PubMed] [Google Scholar]
- 24.Ramsay AG Immune checkpoint blockade immunotherapy to activate anti-tumour T-cell immunity. British Journal of Haematology 162, 313–325 (2013). [DOI] [PubMed] [Google Scholar]
- 25.Buchbinder EI & Desai A CTLA-4 and PD-1 Pathways: Similarities, Differences, and Implications of Their Inhibition. Am. J. Clin. Oncol. 39, 98–106 (2016). [DOI] [PMC free article] [PubMed] [Google Scholar]
- 26.Ashburner M et al. Gene ontology: Tool for the unification of biology. Nature Genetics 25, 25–29 (2000). [DOI] [PMC free article] [PubMed] [Google Scholar]
- 27.Newman AM et al. Robust enumeration of cell subsets from tissue expression profiles. Nat. Methods 12, 453–457 (2015). [DOI] [PMC free article] [PubMed] [Google Scholar]
- 28.Jenkins RW et al. Ex Vivo Profiling of PD-1 Blockade Using Organotypic Tumor Spheroids. Cancer Discov. CD-17–0833 (2017). doi: 10.1158/2159-8290.CD-17-0833 [DOI] [PMC free article] [PubMed] [Google Scholar]
- 29.Eisenhauer EA et al. New response evaluation criteria in solid tumours: Revised RECIST guideline (version 1.1). Eur. J. Cancer 45, 228–247 (2009). [DOI] [PubMed] [Google Scholar]
- 30.Hoos A, Wolchok JD, Humphrey RW & Hodi FS CCR 20th anniversary commentary: Immune-related response criteria -Capturing clinical activity in immuno-oncology. Clinical Cancer Research 21, 4989–4991 (2015). [DOI] [PubMed] [Google Scholar]
- 31.Ayers M et al. IFN-γ – related mRNA profile predicts clinical response to PD-1 blockade. J. Clin. Invest. 127, 1–11 (2017). [DOI] [PMC free article] [PubMed] [Google Scholar]
- 32.Gao J et al. Integrative analysis of complex cancer genomics and clinical profiles using the cBioPortal. Sci. Signal. 6, pl1 (2013). [DOI] [PMC free article] [PubMed] [Google Scholar]
Associated Data
This section collects any data citations, data availability statements, or supplementary materials included in this article.