

Abstract
Transcranial application of focused ultrasound (FUS) combined with vascular introduction of microbubbles (MBs) has emerged as a non-invasive technique that can temporarily create a localized opening in the blood-brain barrier (BBB). Under image-guidance, we administered FUS to sheep brain after intravenous injection of MBs. The presence of BBB opening was evaluated by performing dynamic contrast-enhanced (DCE) magnetic resonance image (MRI) to detect the extravasated gadolinium-based MR contrast agents. Through pharmacokinetic analysis as well as independent component analysis of the DCE MRI data, we observed localized enhancement in BBB permeability at the area that received acoustic pressure of 0.48 MPa (mechanical index of 0.96). On the other hand, application of a higher pressure at 0.58 MPa resulted in localized, minor cerebral hemorrhage. All animals did not show any abnormal behavior during the post-FUS survival periods up to two months. Our data suggests that monitoring for excessive BBB disruption is important for safe translation of the method to humans.
Keywords: focused ultrasound, blood-brain barrier, drug delivery, dynamic contrast-enhanced MRI, pharmacokinetics, independent component analysis
Introduction
The blood-brain barrier (BBB) serves as a functional and structural barrier in the vasculature of the central nervous system (CNS) and also regulates and maintains normal brain function (Abbott and Romero 1996, Zlokovic et al. 1985a, Zlokovic et al. 1985b). The barrier restricts the passage of various types of endogenous and exogenous molecules (typically > 400 Da) from the blood circulation into the brain parenchyma (Pardridge 2012). This restriction also applies to pharmaceutical and biological agents used for therapeutic and imaging purposes (Abbott et al. 2010, Liu et al. 2014, Pardridge 2005), thus posing challenges in the delivery of therapeutic drugs for various CNS diseases (Bartels et al. 2008, Jordao et al. 2010, Obermeier et al. 2013, Pardridge 2003, Wohlfart et al. 2012). Several approaches have been proposed to modify the BBB’s permeability, including administration of hyperosmotic solutions (Dorovini-Zis et al. 1984), viral biological agents or vasoactive molecules (Chen and Liu 2012, Sanovich et al. 1995), use of microwave irradiation (Kiyatkin and Sharma 2009), or circumvention of the BBB through direct intracranial injection of substance-of-interest (Suzuki et al. 1982). However, these methods are currently limited from translating into wide clinical practice due to their lack of spatial specificity or the significant risk of adverse effects that they may pose (Horodyckid et al. 2017, Kobus et al. 2016).
Advancement in focused ultrasound (FUS) technology has enabled the delivery of acoustic pressure waves to a small (measuring a few millimeters in dimension) region of the brain in a non-invasive manner, with additional capability to reach deep brain structures (Elias et al. 2013, Hynynen et al. 2004, Martin et al. 2009). The application of low-intensity FUS coupled with intravascular administration of microbubble contrast agents (MBs) has drawn great attention as a new avenue for temporarily disrupting the BBB (Burgess et al. 2015, Cammalleri et al. 2018, Downs et al. 2015b, Goldwirt et al. 2016, Hynynen et al. 2001, Jones et al. 2018, McDannold et al. 2008a, McDannold et al. 2008b). Although the exact mechanism remains to be determined, acoustic cavitation of MBs (i.e., sub-/ultra-harmonic oscillations or contraction–expansion of the bubble, characterized as stable cavitation) through the interaction with the ultrasound waves is believed to loosen the adjacent endothelial wall of the BBB, thus increasing its permeability to large molecules and compounds (Burgess et al. 2015, Hosseinkhah et al. 2015).
A number of studies have been conducted using small animal models to evaluate the efficacy and safety of FUS-mediated BBB opening using various acoustic parameters and doses of MBs injected (Choi et al. 2010, Chopra et al. 2010, Chu et al. 2016, McDannold et al. 2008a, McDannold et al. 2008b, Treat et al. 2007). Based on the information from the small animal studies, a few trials have also been reported on non-human primates (Downs et al. 2015a, Horodyckid et al. 2017, Karakatsani et al. 2017, McDannold et al. 2012, Wu et al. 2018) and humans (Carpentier et al. 2016, Lipsman et al. 2018), with promising efficacy. Further testing on large animal models can bridge the gap between rodent models and humans to expedite the translation of this technique to clinical practice. In particular, the use of ovine CNS models can provide important translational information because sheep have a skull structure of similar curvature and thickness to that of humans (Laure et al. 2012, Yoon et al. 2018). Among large experimental animals, the sheep brain has a greater mass and volume and bears a gross-morphological similarity (non-homogeneous and gyrencephalic brain) to the human brain (McBride and Morton 2018). Also, the availability of various CNS disease models in sheep, such as Alzheimer’s (Reid et al. 2017), epilepsy (Opdam et al. 2002, Stypulkowski et al. 2014) and stroke (Boltze et al. 2008), will aid in the translation of this method into clinical trial by providing information for how specific therapeutic agents can be used to treat these diseases. Pelekanos and colleagues (Pelekanos et al. 2018) demonstrated the initial feasibility of the FUS-mediated BBB opening technique in sheep and verified the extravasation of Evans blue dye and immunoglobulin G (IgG) at the sonicated brain parenchyma. Further studies using non-invasive imaging, such as magnetic resonance image (MRI), to evaluate BBB openings and observation of post-sonication behavior are warranted to examine the efficacy and safety of the method.
In the present study, we examined FUS-mediated BBB opening in ovine models through contrast-enhanced (CE) MRI. A single-element FUS transducer with a fixed focal geometry was used. Optical image-guidance was also employed based on the acquisition of animal-specific anatomical MRI data for the navigation and placement of the FUS focus on the designated brain area. The presence of the BBB opening was examined by intravenous (IV) injection of gadolinium contrast agent and subsequent pharmacokinetic (PK) analysis of T1-weighted dynamic MRI data. Two PK parameters, Ktrans and Ve, were obtained, where Ktrans indicates the transfer rate constant from the blood plasma to the extracellular-extravascular space (EES) as an index for BBB permeability (Montagne et al. 2015) and Ve indicates the fractional volume of the injected agent in the EES (Tofts 1997, Tofts et al. 1999). Susceptibility-weighted MRI (SWI) was also conducted to examine the presence of hemorrhage, which may indicate an excessive BBB opening (Liu et al. 2008). Independent component analysis (ICA), which allows for unsupervised analysis of MR signal enhancement stemming from the BBB opening, was also adopted to characterize spatial and temporal features of CE MRI data and to estimate the volume of the BBB opening. Across the animals, post-sonication behaviors were observed for various durations up to 2 months. Histological analysis was then performed on the extracted brains.
Methods and Materials
Animal preparation
This study was conducted under the approval of and according to the ethical standards set forth by the local Institutional Animal Care and Use Committee (IACUC). The sheep (Polypay, all female, weight = 42.5 ± 5.3 kg, n = 7, numbered ‘S1’ through ‘S7’ herein) were anesthetized using an IV injection of 2–4 mg/kg of Telazol (a mixture of tiletamine and zolazepam) for experimental procedures. Additional doses of Telazol were given as needed to maintain an adequate plane of anesthesia. Prior to sonication, wool over the sheep scalp was removed using an electric hair trimmer and razor to allow for the uninterrupted transmission of acoustic waves through the scalp.
High-resolution MRI for image-guidance
In order to navigate the acoustic focus to the individual functional neuroanatomy of the sheep, MRI was conducted using a 3-Tesla MRI scanner (Signa HDxt, GE Medical Systems, Waukesha, WI) prior to the FUS procedure. While lying prone on the scanner table, the head was positioned inside an eight-channel head coil. Pillows and cushions were applied around the head to prevent motion. A high-resolution anatomic image of the entire head was acquired using volumetric T1-weighted, inversion recovery three-dimensional (3D) spoiled gradient recalled (SPGR) sequence (field of view 25 × 25 cm2, slice thickness 1 mm, image matrix 256 × 256, number of slices 156, voxel size 0.98 × 0.98 × 1.00 mm3, repetition time 7.4 ms, echo time 3.1 ms, flip angle 11°).
Sonication setup and characterization of the FUS transducer
A single-element FUS transducer (GPS200–400128, Ultran Group, Hoboken, NJ) was used for sonication of the sheep brain. The diameter of the transducer was 37 mm, and the focal length was 30 mm from the exit plane. The pulsed sinusoidal waves (operating at a fundamental frequency [FF] of 250 kHz) were generated using a function waveform generator (33500B, Keysight, Santa Rosa, CA) and subsequently amplified by a linear power amplifier (240L, Electronics and Innovations, Rochester, NY). The amplified signals were transmitted to the FUS transducer via an impedance matching box (JT-800, Electronics and Innovations). The acoustic pressure at the focus of the FUS transducer was characterized using a calibrated needle-type hydrophone (HNR500, Onda, Sunnyvale, CA) with respect to input voltage amplitudes. The longitudinal (30 × 70 mm2 rectangular area, 1 mm step) and transverse (30 × 30 mm2 square area, 1 mm step) pressure profiles of the focal area with respect to the sonication direction were examined by scanning the area using the hydrophone mounted on a three-axis robotic stage (Bi-Slide, Velmex, Bloomfield, NY). The method for characterizing the transducer focus is described in detail elsewhere (Yoo et al. 2011). The centroid of the profile was used as a representative coordinate of the focal point for targeting under image-guidance. The size of the FUS focus was 4 mm in diameter and 17 mm in length along the sonication axis measured at full-width at 90%-maximum of the acoustic pressure profile (indicated by the area enclosed by a white dotted line in Fig. 1A), with an estimated volume of 142.3 mm3 assuming an ellipsoidal focal shape. The size of the focus measured at full width at half maximum (FWHM) was 8 mm in diameter, 50 mm in length, with an estimated volume of 1675.5 mm3, as described by a black dotted line in Figure 1A.
Fig. 1.
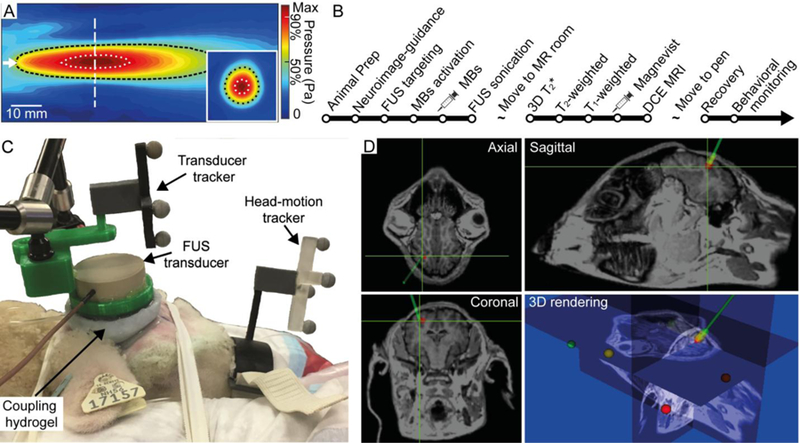
Schematics for FUS setup. (A) Acoustic pressure profile in the longitudinal and transverse (inset) planes. The direction of sonication is indicated by the white arrow. The white vertical dashed line indicates the location of the transverse plane. The areas enclosed by the white and black dotted lines represent the 90% and 50%-maximum region of the acoustic pressure field, respectively. (B) Sequence of experimental procedures for FUS sonication and MRI monitoring. (C) Experimental setup of the image-guided transcranial FUS. The FUS transducer was positioned at the entry point of the sheep’s head using a neuroimage guidance system. (D) Triplanar view and its 3D rendering of animal-specific anatomical MR neuroimaging data. The navigated sonication path and FUS focus are represented by a green line and crosshairs, respectively.
Image-guided FUS and BBB opening
The experimental procedures for FUS sonication and subsequent MRI for the evaluation of the BBB opening are outlined in Figure 1B. The sheep’s head was placed on the navigation platform with a cushion, and fabric tape was used to prevent head motion during the FUS procedure (Fig. 1C). The actual spatial coordinate system for the animal’s head was co-registered to the MRI neuroimage data. The spatial coordinates of the five anatomical landmarks (nose tip, bottoms of bilateral orificio auditivo externo of the ear, bilateral inner canthus of the eyes) were collected using a registration probe under optical tracking (Polaris Vicra, Northern Digital Inc., Ontario, Canada). The physical space was co-registered to the space of the MR neuroimage by matching the obtained landmark coordinates through a point-based rigid body registration method (Fitzpatrick et al. 1998). The fiducial registration error (FRE) was generated to represent the accuracy of the co-registration in terms of the root-mean-square (RMS) distance and was found to be 5.3 ± 1.0 mm across the seven sheep. The head motion in relation to the sonication system, as well as the transducer orientation and location (as shown in Fig. 1C), were tracked in real-time by an established optical navigation protocol (Kim et al. 2012, Lee et al. 2016, West and Maurer 2004). The ultrasound path was coupled to the animal’s head using degassed hydrogel (polyvinyl alcohol) (Lee et al. 2014) and ultrasound gel.
Under image guidance, the operator aligned the acoustic focus to the right parietal lobe approximately 10 mm under the inner skull surface, as shown in Figure 1D. Ultrasound MBs (Definity®, Lantheus Medical Imaging Inc., North Billerica, MA) were administered using an IV bolus injection of 0.01 mL/kg dose. Following the injection of MBs, FUS was immediately delivered to the targeted brain region using the experimental parameters summarized in Table 1.
Table 1.
Summary of sonication parameters and MRI observations. TBD: Tone Burst Duration, PRF: Pulse Repetition Frequency, SD: Sonication Duration, MI: Mechanical Index.
| Sheep ID | ‘S1’ | ‘S2’ | ‘S3’ | ‘S4’ | ‘S5’ | ‘S6’ | ‘S7’ |
|---|---|---|---|---|---|---|---|
| Sonication parameters | |||||||
| TBD (ms) | 10 | 10 | 10 | 10 | 10 | 10 | 10 |
| PRF (Hz) | 1 | 1 | 1 | 1 | 1 | 1 | 1 |
| SD (min) | 1 | 2 | 2 | 2 | 2 | 2 | 2 |
| In situ Pressure (MPa) | 0.46 | 0.58 | 0.39 | 0.48 | 0.48 | 0.48 | 0.48 |
| In situ MI | 0.92 | 1.16 | 0.78 | 0.96 | 0.96 | 0.96 | 0.96 |
| MRI observation | |||||||
| Dynamic MR Acquisition | N/A | N/A | Yes | Yes | Yes | Yes | Yes |
| ∆SI in ROI@focus (%) | 4.3 ± 6.7 | 45.7 ± 32.3 | 3.8 ± 7.3 | 35.0 ± 37.0 | 54.9 ± 49.2 | 30.1 ± 27.6 | 30.7 ± 24.7 |
| ∆SI in ROI@off-focus (%) | 2.8 ± 7.0 | 2.0 ± 6.4 | 7.2 ± 10.6 | 5.2 ± 4.7 | 3.7 ± 15.0 | 3.6 ± 15.5 | 7.3 ± 16.3 |
| BBB opening | No | Yes | No | Yes | Yes | Yes | Yes |
| SWI-based hemorrhage detection | No | Yes | No | No | No | No | No |
To estimate the in situ pressure at the focus, the level of attenuation induced by the coupling hydrogel and the skull was measured in a degassed water tank using a hydrophone. The skulls were extracted from the sheep post-mortem and were positioned in the water tank to mimic the actual sonication path and depth. The attenuation of acoustic pressure was 8.5 ± 0.5% for the coupling hydrogel (n = 6) and 44.7 ± 4.5% for the excised sheep’s skulls (n = 6). An additional 1% pressure attenuation factor by the brain tissue (~5 mm) was introduced using an attenuation coefficient of 8.6 Np·m−1·MHz−1 (Kyriakou et al. 2015). Based on these measurements, the in situ pressure was estimated using 50.1% of the pressure level in the degassed water.
Post-FUS MR imaging
After sonication, the sheep were moved to the MR scanner for brain imaging. The lead time between the end of sonication and MR scanning was 44 ± 12 min (n = 7). A 3D susceptibility-weighted (T2*) sequence (field of view 18 × 18 cm2, slice thickness 2 mm, image matrix 256 × 256, number of slice 30, voxel size 0.7 × 0.7 × 2.0 mm3, repetition time 33 ms, echo time 19 ms, flip angle 15°) was used to detect the presence of hemorrhage. Anatomic T2-weighted fast spin echo sequence (field of view 18 × 18 cm2, slice thickness 3 mm, image matrix 512 × 512, number of slice 20, voxel size 0.35 × 0.35 × 3.0 mm3, repetition time 3,116 ms, echo time 100 ms, flip angle 90°) was used to obtain anatomical information. To evaluate the opening of the BBB, T1-weighted fast spin echo images (field of view 18 × 18 cm2, slice thickness 3 mm, image matrix 256 × 256, number of slice 20, voxel size 0.7 × 0.7 × 3.0 mm3, repetition time 500 ms, echo time 13 ms, echo train length 4, flip angle 90°) of the brain were acquired before injection of the MR contrast agent (Magnevist, Bayer, Wayne, NJ) of dose 0.2 mL/kg. After the injection, T1-weighted images were obtained covering the same brain volumes. For the first two sheep (‘S1’ and ‘S2’), three T1-weighted images were obtained with no inter-scan delay every 30 s. In the rest of the animals (n = 5; ‘S3’–’S7’), we conducted dynamic contrast-enhanced (DCE) MR acquisitions to perform pharmacokinetic analysis. T1-weighted fast spin echo images (field of view 18 × 18 cm2, slice thickness 3 mm, image matrix 256 × 256, number of slice 7, voxel size 0.7 × 0.7 × 3.0 mm3, repetition time 500 ms, echo time 13 ms, echo train length 4, flip angle 90°) were acquired 31 times (one before injection of contrast agent and thirty after injection) every 18 s without inter-scan delay. Higher temporal resolution is desired while maintaining the maximal volume coverage in DCE imaging. We determined that 18 s temporal resolution can provide adequate sensitivity and volume coverage (2.1 cm-thick volume) for the PK analysis according to the previous work by Heisen and colleagues (Heisen et al. 2010).
Before analyzing the obtained time-series of T1-weighted images, the respective sets of the images were motion-corrected and registered using a normalized mutual information method (Maes et al. 1997, Pluim et al. 2003) through SPM software package (SPM8, Wellcome Centre for Human Neuroimaging, University College London, London, UK) in a MATLAB environment (MathWorks, Natick, MA). Significant global movement of the head (≥ 5 mm in translational motion and ≥ 2° in rotational motion as the criteria) during the dynamic scan was not detected from any of the sheep. Then, the brain parenchyma was manually segmented from the rest of the head anatomy including the skull, using an in-house MATLAB script (MathWorks, Natick, MA) by creating a binary mask based on 3D T1-weighted images of the sheep brain. The enhancement of the sonication location in T1-weighted images was quantified by evaluating the pixel-wise percentage difference in MR signal intensity (∆SI) between pre- and post-injection (90 s right after injection) of MR contrast agent. Then, the pixel with the highest ∆SI value in the vicinity of the FUS focus was identified, and its location was used to define the center of the region-of-interest (ROI) (ROI@focus, 5 × 5 in pixel, 3.5 × 3.5 mm2). Another ROI was also defined at the unsonicated opposite hemisphere (symmetric to the sonication) and referred to as the ROI@off-focus.
Pharmacokinetic (PK) analysis of BBB opening
The processed (motion-corrected, registered, and segmented) DCE MRI data of ‘S3’–’S7’ were subjected to PK analysis. The temporal changes in the concentration of the pixel-wise contrast agent (Ct(t)) can be calculated from the processed dynamic image volumes using the Solomon-Bloembergen equation (Eq. (1)) (Bloembergen 1957, Haase et al. 1986, Solomon 1955),
| (1) |
where T1(t) is T1 relaxation time at time t, T10 is T1 relaxation time before injecting contrast agents, and r1 is the T1 relaxivity constant. T1 relaxation time (T1(t)) is obtained from the signal intensity (S(t)) of the MRI using Eq. (2), which is based on the Bloch equation (Buckley and Parker 2005),
| (2) |
in which S0 is the MR signal intensity before injecting contrast agents, θ is the flip angle, and TR is the repetition time.
The PK characteristic of the BBB opening was analyzed through the extended Tofts model (Eq. (3)) (Tofts 1997, Tofts et al. 1999),
| (3) |
where Vp is the volume of the blood plasma and Cp(t) is the concentration of the contrast agent in the blood plasma (also known as the arterial input function, as shown in Fig. S1).
Finally, the PK parameters (Ktrans and Ve) were estimated by fitting the measured contrast agent concentration (Eq. (1)) to the extended Tofts model (Eq. (3)) through the Levenberg-Marquardt algorithm (Ahearn et al. 2005, Marquardt 1963) using DCE@urLAB software package (Ortuño et al. 2013). The degree of data fit was evaluated by calculating a pixel-wise R2 (correlation of determination), and the pixels with R2 ≥ 0.5 were displayed for visualization.
Independent Component Analysis (ICA)
The spatial and temporal features of T1-weighted images were also investigated using independent component analysis (ICA), which decomposes the dynamic data into signals that are maximally independent (Bell and Sejnowski 1995, McKeown et al. 1998, Yoo et al. 2002). Group ICA of fMRI Toolbox (GIFT) (Calhoun et al. 2001a, Calhoun et al. 2001b) was used to analyze the motion-corrected and segmented dynamic image volumes. A total of 20 independent components (ICs) were estimated using principle component analysis (PCA) in which greater than 99.5% of the signal variability was in the data. The spatial mapping of the obtained independent component was evaluated using the infomax algorithm (Bell and Sejnowski 1995). Then, the animal-specific ICs were back-reconstructed using the group ICA algorithm (Calhoun et al. 2001a, Calhoun et al. 2001b) to obtain component-specific maps through voxel-wise calculation of the z-scores with respect to the temporal domain of the ICs. A component that represents the typical signal enhancement pattern of gadolinium uptake (i.e., initial signal increase upon injection and then sustained elevation) was chosen. Then, a threshold (z-score > 3.1 which indicates p < 0.001) was applied to the component map, pseudo-colored and overlaid on the T1-weighted images for visualization.
Volume estimation of BBB opening
The volume of the BBB opening (VBBB) was separately estimated from pixel-wise ∆SI maps and from the IC map. The ∆SI maps were obtained by calculating the percentage signal difference between T1-weighted images acquired before injection of MR contrast agent and the average of the subsequent 30 post-injection images. A ∆SI map typically shows spurious enhancement patterns related to the cerebral vasculature (Ellingson et al. 2017, Hatzoglou et al. 2016, Karakatsani et al. 2017, Kobus et al. 2016), which can obscure the boundaries of regions with BBB opening. Therefore, the volume-of-interest (VOI) was defined around the acoustic focus within the brain parenchyma (11 × 11 × 4 voxels, 7.7 × 7.7 × 12 mm3) to include the highest ∆SI value. The degree of variation in the ∆SI which was not related to the BBB opening was estimated by taking the standard deviation (σ) of the ∆SI values from the VOI with the same volume in the non-sonicated brain hemisphere. Subsequently, the volume of BBB opening was evaluated by counting the number of voxels that were ≥ 1σ above the mean ΔSI value. The volume of the BBB opening was also assessed from the IC map by counting the number of voxels that satisfied the thresholding condition.
Post-sonication behavior monitoring and histological assessment
All sheep were monitored for the presence of any abnormal behaviors, including loss of appetite or weight, for various durations after their sonication session (n = 1 within 24 h, n = 2 for 1 week, n = 2 for 2 weeks, and n = 2 for 2 months). Afterwards, the sheep were euthanized, and their brains were extracted and divided into left and right hemispheres. Both hemispheres were sliced into 5 sections in the caudal to rostral direction; whereby the location of the middle three sections, each ~10 mm thick, was determined by referring to the neuroimage, to ensure that the sonication target was included. The samples were fixated in 10% buffered formalin phosphate for three days. Then, the samples were cut in half (~5 mm thickness) carefully to further match the slice having sonication target as guided by the high-resolution T1-weighted MRI. The corresponding slice was divided into superior/inferior orientation to obtain ~25 × 20 × 5 mm3 blocks (to fit into histological sample cassette) that include sonicated targets. The obtained blocks were further fixated in the formalin for one week, and then were subjected to paraffin-embedding and a subsequent sectioning process (5–8 slides with 7 µm thickness). Through hematoxylin and eosin (H&E; GHS-2–16, Sigma-Aldrich, St. Louis, MO) and vanadium acid fuchsin (VAF; A3908, Sigma-Aldrich)-toluidine blue (T3260, Sigma-Aldrich) staining, the presence of any vascular injuries or ischemia were visualized. Immunohistochemistry (IHC) was also performed to detect the presence of glia infiltration and neurodegeneration through glial fibrillary acidic protein (GFAP) staining. IHC was performed on the Leica Bond automated staining platform (Leica Biosystems Inc. Buffalo Grove, IL). A 1:3000 dilution of antibody GFAP (#ab7260 polyclonal, Abcam, Cambridge, UK) was run using the Bond Polymer Refine Detection kit (DS9800, Leica Biosystems, Buffalo Grove, IL) with citrate antigen retrieval. The slides were photographed using a microscope cell imaging system (Invitrogen EVOS FL Auto 2, Thermo Fisher Scientific, Waltham, MA) covering the entire tissue block.
Results
Assessment of BBB opening via MRI observation
Figure 2 displays axial views of T1-weighted images of the sheep (taken 90 s after injection) that received sonication at three different acoustic pressures. Localized T1-weighted MR hyperintensity at the sonication target, indicating a successful BBB opening, was observed in the five animals that were exposed to acoustic pressures of 0.48 MPa or 0.58 MPa (see the areas indicated by the yellow arrows for ‘S4’ and ‘S2’ in Fig. 2B and C as examples). The use of lower acoustic pressure levels in two sheep (0.39 MPa for ‘S3’ in Fig. 2A and 0.46 MPa for ‘S1’ in Fig. S2) did not show any signal enhancement in the brain.
Fig. 2.
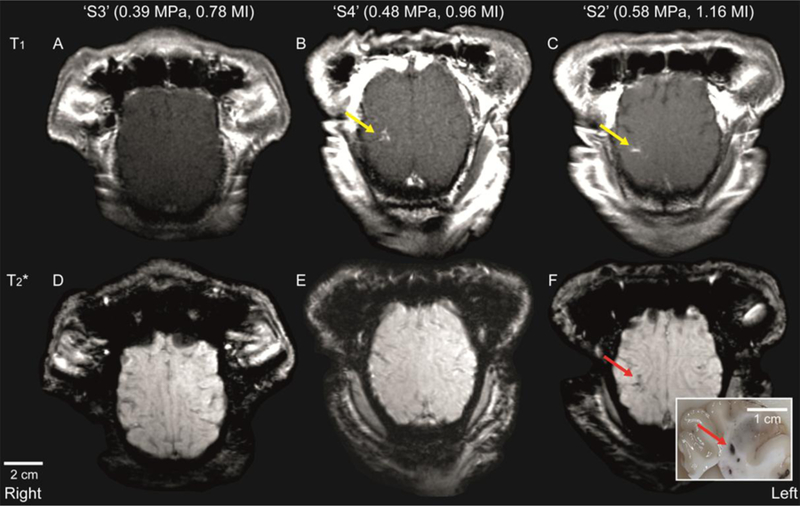
Axial plane T1-weighted MR images of the sheep brain at different levels of acoustic pressure (and corresponding mechanical index: MI). (A)–(C) Contrast-enhanced and (D)–(F) SWI images of sheep brains that were exposed to different levels of in situ acoustic pressure. The location of localized signal enhancement is depicted by a yellow arrow. The presence of hemorrhage was indicated by localized hypointensity (see red arrow), which was later confirmed as a dark spot in the extracted brain tissue (also noted by a red arrow in the inset).
Based on the examination of the SWI (Fig. 2D–F), the FUS session using the highest acoustic pressure (0.58 MPa, ‘S2’) showed the region with hypointense signal, which indicates the presence of hemorrhage (as marked by a red arrow in Figure 2F). Hemorrhaging was also detected in the extracted brain sample (inset in Fig. 2F). In all other brain samples, abnormalities were not detected. The T1-/T2-weighted images, as well as SWI, for all of the sheep (‘S1’–’S7’) are available in supplementary Figure S2.
A summary of the MRI observations is given in Table 1. In terms of percentage signal enhancement (∆SI), ‘S1’ and ‘S3’, which did not have BBB openings, showed ∆SI values of 4.3% and 3.8% at the ROI@focus, respectively. These values were comparable to the ∆SI values of 2.8% and 7.2% from the unsonicated control tissue areas (ROI@off-focus). ‘S4’–’S7,’ which were exposed to an acoustic pressure of 0.48 MPa, showed a ∆SI range of 30.1–54.9% at the ROI@focus, while a lower ∆SI range of 3.6–7.3% was observed at the ROI@off-focus. For ‘S2,’ which was exposed to the highest acoustic pressure level (0.58 MPa), ∆SI was 45.7% at the ROI@focus and 2.0% at the ROI@off-focus.
PK analysis of dynamic T1-weighted images
The mean and standard deviation of the extracted PK parameters (Ktrans and Ve) from the ROI@focus and ROI@off-focus for ‘S3’–’S7,’ which underwent dynamic MR acquisitions, are displayed in Table 2. ‘S3’ (sonicated with 0.39 MPa), which did not have a BBB opening, showed a similar range of Ktrans (0.3 × 10⁻³ min−1) and Ve (0.4 × 10⁻³) between the ROI@focus and the ROI@off-focus. ‘S4’–’S7’, which were exposed to an acoustic pressure of 0.48 MPa, had higher values of Ktrans and Ve in the ROI@focus compared to those of the ROI@off-focus. ‘S4’–’S7’ also had a range of larger mean values of Ktrans (4.8 × 10⁻³–9.2 × 10⁻³ min−1) and Ve (13.7 × 10⁻³–28.5 × 10⁻³) in the ROI@focus but relatively small values of Ktrans (0.2 × 10⁻³–0.5 × 10⁻³ min−1) and Ve (0.3 × 10⁻³–0.9 × 10⁻³) in the ROI@off-focus.
Table 2.
Mean and standard deviation values of PK parameters in the ROI@focus and ROI@off-focus.
| Ktrans (× 10−3 min−1) |
Ve (× 10−3) |
|||
|---|---|---|---|---|
| Sheep ID (in situ pressure) | ROI@focus | ROI@off-focus | ROI@focus | ROI@off-focus |
| ‘S3’ (0.39 MPa) | 0.3 ± 1.2 | 0.3 ± 1.2 | 0.4 ± 1.4 | 0.4 ± 1.3 |
| ‘S4’ (0.48 MPa) | 5.8 ± 9.4 | 0.2 ± 0.8 | 28.5 ± 37.0 | 0.3 ± 0.9 |
| ‘S5’ (0.48 MPa) | 8.3 ± 12.0 | 0.4 ± 1.2 | 18.4 ± 24.2 | 0.8 ± 1.8 |
| ‘S6’ (0.48 MPa) | 4.8 ± 68.0 | 0.5 ± 2.2 | 13.7 ± 19.5 | 0.9 ± 2.8 |
| ‘S7’ (0.48 MPa) | 9.2 ± 11.0 | 0.3 ± 0.9 | 23.9 ± 29.9 | 0.9 ± 1.9 |
Spatial distributions of the PK parameters in the brain for ‘S3’–’S7’ are illustrated in Figure 3. No apparent increase of Ktrans (second row) and Ve (third row) were observed in the brain of ‘S3,’ where an acoustic pressure of 0.39 MPa was used. Elevated Ktrans and Ve were observed for ‘S4’–’S7’ at the localized area of the right brain hemisphere around the target point of the FUS focus. The fourth row of Figure 3 shows a Ktrans map overlaid on the T2-weighted images to show the detailed location of the BBB opening and the Ktrans enhancements that are present along the sulcus and surrounding brain parenchyma.
Fig. 3.
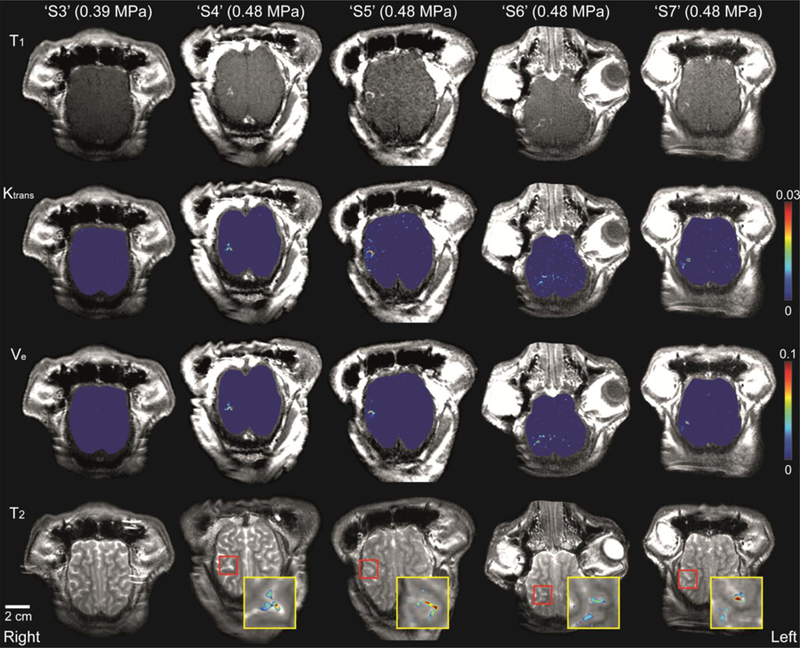
Axial view of contrast-enhanced T1-weighted images, distribution of Ktrans and Ve in the brain, and T2-weighted images for ‘S3’–’S7’. Ktrans and Ve values were increased for ‘S4’–’S7’ at the localized area of the right parietal lobe. Insets (the yellow boxes) show the magnified view of the BBB opening region (noted in the red box) in the T2-weighted image and the overlaid corresponding Ktrans map.
ICA of dynamic T1-weighted images and volume estimation of BBB opening
ICA successfully extracted temporal ICs that were relevant for the gadolinium-mediated T1 signal enhancement pattern (the top row of Fig. 4), and the corresponding IC map (the middle row of Fig. 4) visualized the brain area that was associated with the specific IC. The area with signal enhancement identified from the IC map matched well with the region of hyperintensity in the T1-weighted images (See Fig. 3).
Fig. 4.
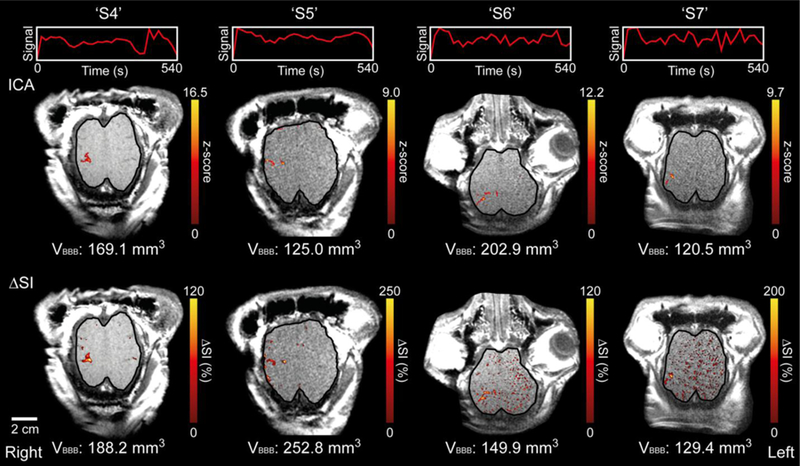
ICA results overlaid on axial T1-weighted images for ‘S4’–’S7’ and the corresponding ∆SI map. The unit signals of the extracted independent components and time progression are depicted in the top row. A single slice is shown (see Fig. S3 for supplementary figures covering all slices). The voxels that show statistically significant correlation with the extracted IC (z-score > 3.1; p < 0.001) were pseudo-colored and overlaid on the anatomical images (in the middle row). The voxels that were ≥ 1σ above the mean ∆SI value are visualized in the bottom row. VBBB indicates the estimated volume of BBB opening for each animal. The boundary of the cortical area is delineated with a solid black line.
The thresholded (at ≥ 1σ) ∆SI map (the bottom row of Fig. 4) showed the area of signal enhancement and also showed scattered signal enhancement patterns in the planar brain regions, such as in unsonicated sulci. ICA, on the other hand, revealed more localized brain areas that are associated with the typical dynamic enhancement pattern. The estimated volumes of BBB opening (VBBB in Fig. 4) were 180.1 ± 47.0 mm3 (n = 4) based on the ∆SI map and 154.4 ± 33.8 mm3 (n = 4) based on ICA.
Post-sonication behavior monitoring and histological analysis
All sheep exhibited normal behaviors and good appetite during the post-sonication monitoring period. After histological assessment, the sheep brain exposed to the highest acoustic pressure (‘S2,’ 0.58 MPa) exhibited evidence of hemorrhage around the sonication targeting region, but the presence of edema, ischemia, glia infiltration and neuro-degeneration were not found, as shown in Figure 5A–C. In all other sheep (n = 6), no tissue damage was detected. The data from ‘S7’, which exhibited successful BBB opening, is shown as an example (Fig. 5D–F).
Fig. 5.
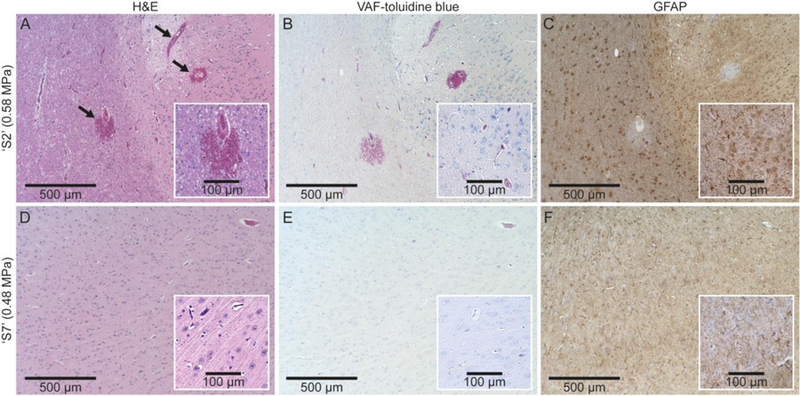
Exemplar histological images from ‘S2’ (exposed to acoustic pressure of 0.58 MPa, the top row) and ‘S7’ (exposed to a lower pressure of 0.48 MPa, the bottom row). The column of images indicates the type of staining: (A, D) H&E, (B, E) VAF-toluidine blue, (C, F) GFAP. The extravasations of erythrocytes are indicated by arrows in (A).
Discussion
We showed that focal delivery of ultrasound pressure waves, in conjunction with intravascular administration of MBs, can create localized openings in the BBB of sheep. The first reported FUS-mediated BBB opening on an ovine model was performed by Pelekanos and colleagues (Pelekanos et al. 2018). In their study, Evans blue dye was injected immediately after sonication (followed by immediate sacrifice and brain harvest) to visualize the opening of the BBB. We, on the other hand, assessed the presence of BBB opening using CE MRI. Therefore, we were able to monitor the behavior of the animal throughout an extended period of time. Although we observed the presence of hemorrhage in one animal (‘S2’) that received the highest acoustic pressure of 0.58 MPa (corresponding MI of 1.16), no adverse behavioral signs were observed across all animals during post-sonication monitoring.
Among the four different pressure values tested in this study, successful BBB opening (without tissue damage) was verified in sheep that received acoustic pressures of 0.48 MPa (0.96 in MI). The pressure level and corresponding MI was higher than values obtained from previous studies using a similar range of fundamental frequency (FF), where the BBB opening was observed at an acoustic pressure of 0.3 MPa (0.59 MI at an FF of 260 kHz) in rabbits (Hynynen et al. 2006) and 0.15 MPa (0.32 MI at an FF of 220 kHz) in rhesus macaques (McDannold et al. 2012). In terms of MI, which is well-known to have a strong correlation with BBB opening threshold (Cammalleri et al. 2018, Chu et al. 2016, McDannold et al. 2008a), the effective acoustic pressure in our study was higher than the MI (0.4–0.5) required for BBB opening from previous small animal studies (Kobus et al. 2016, Lin et al. 2015, Liu et al. 2010, O’Reilly and Hynynen 2012). On the other hand, the MI used in this study was lower than the range of MIs used by Pelekanos and colleagues (1.6–2.7; and corresponding pressures of 0.84–1.44 MPa) (Pelekanos et al. 2018). Though we utilized similar sonication protocols as the work by Pelekanos et al. (286 kHz FF, 2 Hz PRF, TBD of 1 and 10 ms, and administration of Definity MBs), the use of a higher pressure (and MI) would have resulted in hemorrhage under our experimental protocol. This finding calls for future caution when determining the level of pressure waves required for safe application of the technique. At the pressure of 0.46 MPa (‘S1’), evidence of BBB opening was not observed despite the similar level of exposed pressure. Although we could not isolate the causes for this discrepancy, we speculate that this discrepancy may be associated with insufficient sonication duration of 1 min (while 2 min resulted in successful opening). Further studies should be done to clarify the effect of overall sonication duration, optimal range of pressure/MI, and the method of introduction of MBs (via constant rate perfusion or bolus injection as types and doses of MBs may influence the efficiency of BBB opening (McDannold et al. 2008b, O’Reilly et al. 2011)). Inclusion of passive cavitation detection (PCD) would also be helpful to optimize the pressure level used for BBB opening by monitoring the presence of inertial cavitation, which may cause hemorrhage or other mechanical damages to the brain tissue (Huang et al. 2017, McDannold et al. 2006).
Kinetic features of the gadolinium-based MR contrast agent injected after the FUS-induced BBB opening were assessed by performing PK analysis of the DCE MRI data. This method of analysis has been previously used to characterize abnormalities in BBB permeability in strokes (Kassner et al. 2009) and brain tumors (Singh et al. 2007). The Ktrans values measured in the present study (range = 5.8 × 10⁻³–9.2 × 10⁻³ min−1) were comparable to Ktrans values in a previous study using rodent models (6.1 × 10⁻³–13.6 × 10⁻³ min−1) (Chu et al. 2016), but the range of Ve (13.7 × 10⁻³–28.5 × 10⁻³) was found to be lower than that of the rodent model (28.5 × 10⁻³–78.7 × 10⁻³) (Chu et al. 2016). We conjecture that the difference in Ve values might have been attributed to the injection of a smaller amount of MR contrast agent (0.2 mL/kg) used in our work compared to the amount used in the rodent study (0.3 mL/kg). It is possible that the discrepancy could also be caused by other factors, such as differences in sonication parameters or species-dependent differences in anatomical/vascular structure of the brain. The optimal acoustic pressure level to induce BBB permeability without tissue damage will vary depending on many experimental variables and will require further refinement. In this regard, we note that the detection sensitivity of SWI on hemorrhage can be heavily affected by the choice of slice thickness and field strength (Nandigam et al. 2009). Considering the image resolution and the field strength of MRI used in the present study (0.7 × 0.7 × 2.0 mm3 and 3 Tesla scanner), SWI may only reveal the macroscopic presentation of hemorrhaging. Although we did not find hemorrhages based on our histological analysis of the samples having negative SWI findings, caution should be exercised that negative SWI does not always preclude the presence of micro-hemorrhaging that evades its detection.
The area of increased BBB permeability was located near the sulcus and surrounding gray matter in the acoustic focus, not in the white matter (see the fourth row of Fig. 3). This observation is in agreement with observations from non-human primate studies where the extravasation of the MR contrast agents was more evident in the gray matter and sulcal regions than in the white matter (Samiotaki et al. 2017, Wu et al. 2018). We initially anticipated that the white matter adjacent to the acoustic focus would also show signs of BBB opening as experiments on small animal models have shown that the disruptions occurred in both white and gray matter structures (Chu et al. 2016, Kobus et al. 2016). We hypothesize that species-dependent differences in cerebral vascular anatomy and the relative size of the acoustic focus compared to the size of the brain might have contributed to the different observations, as the size of the vasculature and the diameter of the MBs play an important role in BBB opening (Downs et al. 2015a, Tung et al. 2011). It is also possible that the amount of contrast agents extravasated into the white matter was not sufficient enough to be detected by the T1-weighted MRI. The study on disrupting BBB in rhesus macaques (McDannold et al. 2012) seems to support this hypothesis, where significant MR signal enhancement was detected in the gray matter around the sulcus while indistinct enhancement was observed in the white matter. They identified, through histological analysis using an IV injection of trypan blue, that BBB disruption did occur at white matter areas but to a smaller extent compared to the gray matter. Further studies are needed to examine the different degrees of BBB permeability that may occur through a FUS-mediated procedure depending on the different locations of the brain, including the deep brain regions.
During the characterization of the volume of the BBB opening (VBBB), the ∆SI map showed spurious signal enhancement patterns across the brain, particularly from the vasculatures (as shown in the bottom row of Fig. 4). This phenomenon is quite common among CE MRI studies (Hynynen et al. 2006, Kobus et al. 2016, Liu et al. 2008, McDannold et al. 2008a), and an ROI is delineated to evaluate the area of localized MR signal enhancement (Carpentier et al. 2016, Horodyckid et al. 2017, Hynynen et al. 2005, Liu et al. 2010, Liu et al. 2008, McDannold et al. 2008a). In this study, ICA was applied to DCE MRI data to characterize the temporal and spatial response of the FUS-induced BBB opening, all without the need for setting an ROI. ICA, which enables the unsupervised analysis of dynamic signal behaviors without prior knowledge of the temporal features of the signal, has been previously applied to the analysis of functional MRI and CE characterization of breast cancers (Lee et al. 2008, Yoo et al. 2002). The ICA yielded an estimated VBBB of 154.4 mm3, which was similar to the size of the acoustic focus (142.3 mm3 estimated at 90%-maximum of pressure profile). Thus, the ICA technique may confer an automatic and algorithm-driven analysis of the DCE MRI data in the characterization of drug delivery via BBB opening, in conjunction with existing data analysis techniques such as evaluation of ΔSI map and PK analysis. We also found that regardless of the analysis techniques, the volume of estimated BBB opening was much smaller than the focal area that is conventionally defined at full width at half maximum (i.e., 1675.5 mm3), as least through the ovine model. It supports that the BBB opening takes place in the vicinity of brain regions that are exposed to the peak acoustic pressure (as calibrated at its maximum); however, it calls for further investigation on finding the detailed relationship between the BBB opening and the definition of acoustic focal geometry.
This study had limitations. First, FUS-induced BBB opening was only performed once per animal. Disease treatments, such as chemotherapy for brain tumors or immunotherapy for Alzheimer’s disease, would require therapeutic agents to be administered over periods of several weeks or months (Duffner et al. 1993, van Dyck 2018). In addition, a second CE MRI session, for example, performed one day after the FUS procedure, would have provided additional information on the degree of BBB closure. Future work should confirm the closure of the FUS-induced BBB opening and examine the effects caused by repeated BBB opening sessions over a prolonged period. The T1-weighted images for the DCE used in the present study were restricted to image the area encompassing the acoustic focal region to attain sufficient temporal resolution (i.e., 18 sec). Additional acquisition of a post-contrast, high-resolution T1-weighted MR image would be helpful to assess the area of potential BBB opening covering the entire brain. Another limitation of our study was that only one focal area in the brain was sonicated. The volume of BBB opening from sonicating a single focal region would not be sufficient for any meaningful anti-tumor drug delivery (for example, the volume of brain tumors are typically greater than the size of a single acoustic focus (Joe et al. 1999)). Image-guidance combined with FUS beam-steering (Naor et al. 2016) will help to enable expedited sonication of multiple brain regions to cover a wider area.
Nonetheless, the present study successfully demonstrated that an image-guided transcranial FUS system can be used to induce a localized BBB opening without causing adverse damage in the ovine model. We found a rather narrow range of pressure that induced a BBB opening without causing hemorrhage. Since therapeutic agents have different molecular weights (e.g., chemotherapeutic drugs such as cyclophosphamide and cisplatin (~300 Da), neurotrophins (~20 kDa) (Baseri et al. 2012), antibodies (~150 kDa) (Jordao et al. 2013), and gene vectors (~4000 kDa) (Huang et al. 2012)) and the BBB permeability toward these agents would vary, further investigation on the delivery of various therapeutic agents is necessary to serve as supportive information in translating this technique to clinical human applications.
Supplementary Material
Acknowledgments
This study was supported by the NIH (R01 MH111763, to SS Yoo). We acknowledge Dr. Yongzhi Zhang for supporting tissue extraction, Ms. Linda B. Xu for editorial support, and Dr. Christine G. Lian for her contribution in histological analysis. We thank Dana-Farber/Harvard Cancer Center in Boston, MA, for the use of the Specialized Histopathology Core, which provided histology and immunohistochemistry service. Dana-Farber/Harvard Cancer Center is supported in part by an NCI Cancer Center Support Grant # NIH 5 P30 CA06516.
Footnotes
Publisher's Disclaimer: This is a PDF file of an unedited manuscript that has been accepted for publication. As a service to our customers we are providing this early version of the manuscript. The manuscript will undergo copyediting, typesetting, and review of the resulting proof before it is published in its final citable form. Please note that during the production process errors may be discovered which could affect the content, and all legal disclaimers that apply to the journal pertain.
References
- Abbott NJ, Patabendige AA, Dolman DE, Yusof SR, Begley DJ. Structure and function of the blood-brain barrier. Neurobiol Dis 2010;37:13–25. [DOI] [PubMed] [Google Scholar]
- Abbott NJ, Romero IA. Transporting therapeutics across the blood-brain barrier. Mol Med Today 1996;2:106–13. [DOI] [PubMed] [Google Scholar]
- Ahearn TS, Staff RT, Redpath TW, Semple SIK. The use of the Levenberg–Marquardt curve-fitting algorithm in pharmacokinetic modelling of DCE-MRI data. Phys Med Biol 2005;50:N85–92. [DOI] [PubMed] [Google Scholar]
- Bartels AL, Willemsen AT, Kortekaas R, de Jong BM, de Vries R, de Klerk O, van Oostrom JC, Portman A, Leenders KL. Decreased blood-brain barrier P-glycoprotein function in the progression of Parkinson’s disease, PSP and MSA. J Neural Transm (Vienna) 2008;115:1001–9. [DOI] [PMC free article] [PubMed] [Google Scholar]
- Baseri B, Choi JJ, Deffieux T, Samiotaki G, Tung YS, Olumolade O, Small SA, Morrison B, Konofagou EE. Activation of signaling pathways following localized delivery of systemically administered neurotrophic factors across the blood-brain barrier using focused ultrasound and microbubbles. Phys Med Biol 2012;57:N65–81. [DOI] [PMC free article] [PubMed] [Google Scholar]
- Bell AJ, Sejnowski TJ. An information-maximization approach to blind separation and blind deconvolution. Neural Comput 1995;7:1129–59. [DOI] [PubMed] [Google Scholar]
- Bloembergen N. Proton relaxation times in paramagnetic solutions. J Chem Phys 1957;27:572–3. [Google Scholar]
- Boltze J, Forschler A, Nitzsche B, Waldmin D, Hoffmann A, Boltze CM, Dreyer AY, Goldammer A, Reischauer A, Hartig W, Geiger KD, Barthel H, Emmrich F, Gille U. Permanent middle cerebral artery occlusion in sheep: a novel large animal model of focal cerebral ischemia. J Cereb Blood Flow Metab 2008;28:1951–64. [DOI] [PubMed] [Google Scholar]
- Buckley DL, Parker GJM. Measuring contrast agent concentration in T1-weighted dynamic contrast-enhanced MRI, In: Jackson A, Buckley DL, and Parker GJM, eds. Dynamic contrast-enhanced magnetic resonance imaging in oncology Berlin: Springer, 2005. pp. 69–79. [Google Scholar]
- Burgess A, Shah K, Hough O, Hynynen K. Focused ultrasound-mediated drug delivery through the blood–brain barrier. Expert Rev Neurother 2015;15:477–91. [DOI] [PMC free article] [PubMed] [Google Scholar]
- Calhoun V, Adali T, Pearlson G, Pekar J. Group ICA of functional MRI data: separability, stationarity, and inference. Proc Int Conf on ICA and BSS, San Diego, CA, 2001a. [Google Scholar]
- Calhoun VD, Adali T, Pearlson GD, Pekar J. A method for making group inferences from functional MRI data using independent component analysis. Hum Brain Mapp 2001b;14:140–51. [DOI] [PMC free article] [PubMed] [Google Scholar]
- Cammalleri A, Croce P, Lee W, Yoon K, Yoo SS. Therapeutic potentials of localized blood-brain barrier disruption by non-invasive transcranial focused ultrasound: A technical review. J Clin Neurophysiol 2018;In press. [DOI] [PMC free article] [PubMed]
- Carpentier A, Canney M, Vignot A, Reina V, Beccaria K, Horodyckid C, Karachi C, Leclercq D, Lafon C, Chapelon JY, Capelle L, Cornu P, Sanson M, Hoang-Xuan K, Delattre JY, Idbaih A. Clinical trial of blood-brain barrier disruption by pulsed ultrasound. Sci Transl Med 2016;8:343re2. [DOI] [PubMed] [Google Scholar]
- Chen Y, Liu L. Modern methods for delivery of drugs across the blood-brain barrier. Adv Drug Deliv Rev 2012;64:640–65. [DOI] [PubMed] [Google Scholar]
- Choi JJ, Feshitan JA, Baseri B, Wang S, Tung YS, Borden MA, Konofagou EE. Microbubble-size dependence of focused ultrasound-induced blood-brain barrier opening in mice in vivo. IEEE Trans Biomed Eng 2010;57:145–54. [DOI] [PMC free article] [PubMed] [Google Scholar]
- Chopra R, Vykhodtseva N, Hynynen K. Influence of exposure time and pressure amplitude on blood-brain-barrier opening using transcranial ultrasound exposures. ACS Chem Neurosci 2010;1:391–8. [DOI] [PMC free article] [PubMed] [Google Scholar]
- Chu PC, Chai WY, Tsai CH, Kang ST, Yeh CK, Liu HL. Focused ultrasound-induced blood-brain barrier opening: association with mechanical index and cavitation index analyzed by dynamic contrast-enhanced magnetic-resonance imaging. Sci Rep 2016;6:33264. [DOI] [PMC free article] [PubMed] [Google Scholar]
- Dorovini-Zis K, Bowman PD, Betz AL, Goldstein GW. Hyperosmotic arabinose solutions open the tight junctions between brain capillary endothelial cells in tissue culture. Brain Res 1984;302:383–6. [DOI] [PubMed] [Google Scholar]
- Downs ME, Buch A, Karakatsani ME, Konofagou EE, Ferrera VP. Blood-brain barrier opening in behaving non-human primates via focused ultrasound with systemically administered microbubbles. Sci Rep 2015a;5:15076. [DOI] [PMC free article] [PubMed] [Google Scholar]
- Downs ME, Buch A, Sierra C, Karakatsani ME, Teichert T, Chen S, Konofagou EE, Ferrera VP. Long-term safety of repeated blood-brain barrier opening via focused ultrasound with microbubbles in non-human primates performing a cognitive task. PLoS One 2015b;10:e0125911. [DOI] [PMC free article] [PubMed] [Google Scholar]
- Duffner PK, Horowitz ME, Krischer JP, Friedman HS, Burger PC, Cohen ME, Sanford RA, Mulhern RK, James HE, Freeman CR, Seidel FG. Postoperative chemotherapy and delayed radiation in children less than three years of age with malignant brain tumors. N Engl J Med 1993;328:1725–31. [DOI] [PubMed] [Google Scholar]
- Elias WJ, Huss D, Voss T, Loomba J, Khaled M, Zadicario E, Frysinger RC, Sperling SA, Wylie S, Monteith SJ, Druzgal J, Shah BB, Harrison M, Wintermark M. A pilot study of focused ultrasound thalamotomy for essential tremor. N Engl J Med 2013;369:640–8. [DOI] [PubMed] [Google Scholar]
- Ellingson BM, Harris RJ, Woodworth DC, Leu K, Zaw O, Mason WP, Sahebjam S, Abrey LE, Aftab DT, Schwab GM, Hessel C, Lai A, Nghiemphu PL, Pope WB, Wen PY, Cloughesy TF. Baseline pretreatment contrast enhancing tumor volume including central necrosis is a prognostic factor in recurrent glioblastoma: evidence from single and multicenter trials. Neuro Oncol 2017;19:89–98. [DOI] [PMC free article] [PubMed] [Google Scholar]
- Fitzpatrick JM, West JB, Maurer CR. Predicting error in rigid-body point-based registration. IEEE Trans Med Imaging 1998;17:694–702. [DOI] [PubMed] [Google Scholar]
- Goldwirt L, Canney M, Horodyckid C, Poupon J, Mourah S, Vignot A, Chapelon JY, Carpentier A. Enhanced brain distribution of carboplatin in a primate model after blood-brain barrier disruption using an implantable ultrasound device. Cancer Chemother Pharmacol 2016;77:211–6. [DOI] [PubMed] [Google Scholar]
- Haase A, Frahm J, Matthaei D, Hanicke W, Merboldt K-D. FLASH imaging. rapid NMR imaging using low flip-angle pulses. J Magn Reson 1986;67:258–66. [DOI] [PubMed] [Google Scholar]
- Hatzoglou V, Yang TJ, Omuro A, Gavrilovic I, Ulaner G, Rubel J, Schneider T, Woo KM, Zhang Z, Peck KK, Beal K, Young RJ. A prospective trial of dynamic contrast-enhanced MRI perfusion and fluorine-18 FDG PET-CT in differentiating brain tumor progression from radiation injury after cranial irradiation. Neuro Oncol 2016;18:873–80. [DOI] [PMC free article] [PubMed] [Google Scholar]
- Heisen M, Fan X, Buurman J, van Riel NA, Karczmar GS, ter Haar Romeny BM. The influence of temporal resolution in determining pharmacokinetic parameters from DCE-MRI data. Magn Reson Med 2010;63:811–6. [DOI] [PMC free article] [PubMed] [Google Scholar]
- Horodyckid C, Canney M, Vignot A, Boisgard R, Drier A, Huberfeld G, Francois C, Prigent A, Santin MD, Adam C, Willer JC, Lafon C, Chapelon JY, Carpentier A. Safe long-term repeated disruption of the blood-brain barrier using an implantable ultrasound device: a multiparametric study in a primate model. J Neurosurg 2017;126:1351–61. [DOI] [PubMed] [Google Scholar]
- Hosseinkhah N, Goertz DE, Hynynen K. Microbubbles and blood-brain barrier opening: a numerical study on acoustic emissions and wall stress predictions. IEEE Trans Biomed Eng 2015;62:1293–304. [DOI] [PMC free article] [PubMed] [Google Scholar]
- Huang Q, Deng J, Wang F, Chen S, Liu Y, Wang Z, Wang Z, Cheng Y. Targeted gene delivery to the mouse brain by MRI-guided focused ultrasound-induced blood-brain barrier disruption. Exp Neurol 2012;233:350–6. [DOI] [PubMed] [Google Scholar]
- Huang Y, Alkins R, Schwartz ML, Hynynen K. Opening the blood-brain barrier with MR imaging-guided focused ultrasound: preclinical testing on a trans-human skull porcine model. Radiology 2017;282:123–30. [DOI] [PMC free article] [PubMed] [Google Scholar]
- Hynynen K, Clement GT, McDannold N, Vykhodtseva N, King R, White PJ, Vitek S, Jolesz FA. 500-element ultrasound phased array system for noninvasive focal surgery of the brain: a preliminary rabbit study with ex vivo human skulls. Magn Reson Med 2004;52:100–7. [DOI] [PubMed] [Google Scholar]
- Hynynen K, McDannold N, Sheikov NA, Jolesz FA, Vykhodtseva N. Local and reversible blood-brain barrier disruption by noninvasive focused ultrasound at frequencies suitable for trans-skull sonications. Neuroimage 2005;24:12–20. [DOI] [PubMed] [Google Scholar]
- Hynynen K, McDannold N, Vykhodtseva N, Jolesz FA. Noninvasive MR imaging-guided focal opening of the blood-brain barrier in rabbits. Radiology 2001;220:640–6. [DOI] [PubMed] [Google Scholar]
- Hynynen K, McDannold N, Vykhodtseva N, Raymond S, Weissleder R, Jolesz FA, Sheikov N. Focal disruption of the blood-brain barrier due to 260-kHz ultrasound bursts: a method for molecular imaging and targeted drug delivery. J Neurosurg 2006;105:445–54. [DOI] [PubMed] [Google Scholar]
- Joe BN, Fukui MB, Meltzer CC, Huang QS, Day RS, Greer PJ, Bozik ME. Brain tumor volume measurement: comparison of manual and semiautomated methods. Radiology 1999;212:811–6. [DOI] [PubMed] [Google Scholar]
- Jones RM, Deng L, Leung K, McMahon D, O’Reilly MA, Hynynen K. Three-dimensional transcranial microbubble imaging for guiding volumetric ultrasound-mediated blood-brain barrier opening. Theranostics 2018;8:2909–26. [DOI] [PMC free article] [PubMed] [Google Scholar]
- Jordao JF, Ayala-Grosso CA, Markham K, Huang Y, Chopra R, McLaurin J, Hynynen K, Aubert I. Antibodies targeted to the brain with image-guided focused ultrasound reduces amyloid-beta plaque load in the TgCRND8 mouse model of Alzheimer’s disease. PLoS One 2010;5:e10549. [DOI] [PMC free article] [PubMed] [Google Scholar]
- Jordao JF, Thevenot E, Markham-Coultes K, Scarcelli T, Weng YQ, Xhima K, O’Reilly M, Huang Y, McLaurin J, Hynynen K, Aubert I. Amyloid-beta plaque reduction, endogenous antibody delivery and glial activation by brain-targeted, transcranial focused ultrasound. Exp Neurol 2013;248:16–29. [DOI] [PMC free article] [PubMed] [Google Scholar]
- Karakatsani MEM, Samiotaki GM, Downs ME, Ferrera VP, Konofagou EE. Targeting effects on the volume of the focused ultrasound-induced blood-brain barrier opening in nonhuman primates in vivo. IEEE Trans Ultrason Ferroelectr Freq Control 2017;64:798–810. [DOI] [PMC free article] [PubMed] [Google Scholar]
- Kassner A, Roberts TP, Moran B, Silver FL, Mikulis DJ. Recombinant tissue plasminogen activator increases blood-brain barrier disruption in acute ischemic stroke: an MR imaging permeability study. AJNR Am J Neuroradiol 2009;30:1864–9. [DOI] [PMC free article] [PubMed] [Google Scholar]
- Kim H, Chiu A, Park S, Yoo SS. Image-guided navigation of single-element focused ultrasound transducer. Int J Imaging Syst Technol 2012;22:177–84. [DOI] [PMC free article] [PubMed] [Google Scholar]
- Kiyatkin EA, Sharma HS. Permeability of the blood-brain barrier depends on brain temperature. Neuroscience 2009;161:926–39. [DOI] [PMC free article] [PubMed] [Google Scholar]
- Kobus T, Vykhodtseva N, Pilatou M, Zhang Y, McDannold N. Safety validation of repeated blood-brain barrier disruption using focused ultrasound. Ultrasound Med Biol 2016;42:481–92. [DOI] [PMC free article] [PubMed] [Google Scholar]
- Kyriakou A, Neufeld E, Werner B, Szekely G, Kuster N. Full-wave acoustic and thermal modeling of transcranial ultrasound propagation and investigation of skull-induced aberration correction techniques: a feasibility study. J Ther Ultrasound 2015;3:11. [DOI] [PMC free article] [PubMed] [Google Scholar]
- Laure B, Petraud A, Sury F, Tranquart F, Goga D. Resistance of the sheep skull after a monocortical cranial graft harvest. J Craniomaxillofac Surg 2012;40:261–5. [DOI] [PubMed] [Google Scholar]
- Lee JH, Lee TW, Jolesz FA, Yoo SS. Independent vector analysis (IVA): multivariate approach for fMRI group study. Neuroimage 2008;40:86–109. [DOI] [PubMed] [Google Scholar]
- Lee W, Lee SD, Park MY, Foley L, Purcell-Estabrook E, Kim H, Fischer K, Maeng LS, Yoo SS. Image-guided focused ultrasound-mediated regional brain stimulation in sheep. Ultrasound Med Biol 2016;42:459–70. [DOI] [PubMed] [Google Scholar]
- Lee W, Lee SD, Park MY, Yang J, Yoo SS. Evaluation of polyvinyl alcohol cryogel as an acoustic coupling medium for low‐ intensity transcranial focused ultrasound. Int J Imaging Syst Technol 2014;24:332–8. [Google Scholar]
- Lin CY, Hsieh HY, Pitt WG, Huang CY, Tseng IC, Yeh CK, Wei KC, Liu HL. Focused ultrasound-induced blood-brain barrier opening for non-viral, non-invasive, and targeted gene delivery. J Control Release 2015;212:1–9. [DOI] [PubMed] [Google Scholar]
- Lipsman N, Meng Y, Bethune AJ, Huang Y, Lam B, Masellis M, Herrmann N, Heyn C, Aubert I, Boutet A. Blood–brain barrier opening in Alzheimer’s disease using MR-guided focused ultrasound. Nat Commun 2018;9:2336. [DOI] [PMC free article] [PubMed] [Google Scholar]
- Liu HL, Fan CH, Ting CY, Yeh CK. Combining microbubbles and ultrasound for drug delivery to brain tumors: current progress and overview. Theranostics 2014;4:432–44. [DOI] [PMC free article] [PubMed] [Google Scholar]
- Liu HL, Hua MY, Chen PY, Chu PC, Pan CH, Yang HW, Huang CY, Wang JJ, Yen TC, Wei KC. Blood-brain barrier disruption with focused ultrasound enhances delivery of chemotherapeutic drugs for glioblastoma treatment. Radiology 2010;255:415–25. [DOI] [PubMed] [Google Scholar]
- Liu HL, Wai YY, Chen WS, Chen JC, Hsu PH, Wu XY, Huang WC, Yen TC, Wang JJ. Hemorrhage detection during focused-ultrasound induced blood-brain-barrier opening by using susceptibility-weighted magnetic resonance imaging. Ultrasound Med Biol 2008;34:598–606. [DOI] [PubMed] [Google Scholar]
- Maes F, Collignon A, Vandermeulen D, Marchal G, Suetens P. Multimodality image registration by maximization of mutual information. IEEE Trans Med Imaging 1997;16:187–98. [DOI] [PubMed] [Google Scholar]
- Marquardt DW. An algorithm for least-squares estimation of nonlinear parameters. SIAM J Appl Math 1963;11:431–41. [Google Scholar]
- Martin E, Jeanmonod D, Morel A, Zadicario E, Werner B. High-intensity focused ultrasound for noninvasive functional neurosurgery. Ann Neurol 2009;66:858–61. [DOI] [PubMed] [Google Scholar]
- McBride SD, Morton AJ. Indices of comparative cognition: assessing animal models of human brain function. Exp Brain Res 2018;236:3379–90. [DOI] [PMC free article] [PubMed] [Google Scholar]
- McDannold N, Arvanitis CD, Vykhodtseva N, Livingstone MS. Temporary disruption of the blood-brain barrier by use of ultrasound and microbubbles: safety and efficacy evaluation in rhesus macaques. Cancer Res 2012;72:3652–63. [DOI] [PMC free article] [PubMed] [Google Scholar]
- McDannold N, Vykhodtseva N, Hynynen K. Targeted disruption of the blood-brain barrier with focused ultrasound: association with cavitation activity. Phys Med Biol 2006;51:793–807. [DOI] [PubMed] [Google Scholar]
- McDannold N, Vykhodtseva N, Hynynen K. Blood-brain barrier disruption induced by focused ultrasound and circulating preformed microbubbles appears to be characterized by the mechanical index. Ultrasound Med Biol 2008a;34:834–40. [DOI] [PMC free article] [PubMed] [Google Scholar]
- McDannold N, Vykhodtseva N, Hynynen K. Effects of acoustic parameters and ultrasound contrast agent dose on focused-ultrasound induced blood-brain barrier disruption. Ultrasound Med Biol 2008b;34:930–7. [DOI] [PMC free article] [PubMed] [Google Scholar]
- McKeown MJ, Makeig S, Brown GG, Jung TP, Kindermann SS, Bell AJ, Sejnowski TJ. Analysis of fMRI data by blind separation into independent spatial components. Hum Brain Mapp 1998;6:160–88. [DOI] [PMC free article] [PubMed] [Google Scholar]
- Montagne A, Barnes SR, Sweeney MD, Halliday MR, Sagare AP, Zhao Z, Toga AW, Jacobs RE, Liu CY, Amezcua L, Harrington MG, Chui HC, Law M, Zlokovic BV. Blood-brain barrier breakdown in the aging human hippocampus. Neuron 2015;85:296–302. [DOI] [PMC free article] [PubMed] [Google Scholar]
- Nandigam RN, Viswanathan A, Delgado P, Skehan ME, Smith EE, Rosand J, Greenberg SM, Dickerson BC. MR imaging detection of cerebral microbleeds: effect of susceptibility-weighted imaging, section thickness, and field strength. AJNR Am J Neuroradiol 2009;30:338–43. [DOI] [PMC free article] [PubMed] [Google Scholar]
- Naor O, Krupa S, Shoham S. Ultrasonic neuromodulation. J Neural Eng 2016;13:031003. [DOI] [PubMed] [Google Scholar]
- O’Reilly MA, Waspe AC, Ganguly M, Hynynen K. Focused-ultrasound disruption of the blood-brain barrier using closely-timed short pulses: influence of sonication parameters and injection rate. Ultrasound Med Biol 2011;37:587–94. [DOI] [PMC free article] [PubMed] [Google Scholar]
- O’Reilly MA, Hynynen K. Blood-brain barrier: real-time feedback-controlled focused ultrasound disruption by using an acoustic emissions–based controller. Radiology 2012;263:96–106. [DOI] [PMC free article] [PubMed] [Google Scholar]
- Obermeier B, Daneman R, Ransohoff RM. Development, maintenance and disruption of the blood-brain barrier. Nat Med 2013;19:1584–96. [DOI] [PMC free article] [PubMed] [Google Scholar]
- Opdam HI, Federico P, Jackson GD, Buchanan J, Abbott DF, Fabinyi GC, Syngeniotis A, Vosmansky M, Archer JS, Wellard RM, Bellomo R. A sheep model for the study of focal epilepsy with concurrent intracranial EEG and functional MRI. Epilepsia 2002;43:779–87. [DOI] [PubMed] [Google Scholar]
- Ortuño JE, Ledesma-Carbayo MJ, Simões RV, Candiota AP, Arús C, Santos A. DCE@ urLAB: a dynamic contrast-enhanced MRI pharmacokinetic analysis tool for preclinical data. BMC Bioinformatics 2013;14:316. [DOI] [PMC free article] [PubMed] [Google Scholar]
- Pardridge WM. Blood-brain barrier drug targeting: the future of brain drug development. Mol Interv 2003;3:90–105, 51. [DOI] [PubMed] [Google Scholar]
- Pardridge WM. The blood-brain barrier: bottleneck in brain drug development. NeuroRx 2005;2:3–14. [DOI] [PMC free article] [PubMed] [Google Scholar]
- Pardridge WM. Drug transport across the blood-brain barrier. J Cereb Blood Flow Metab 2012;32:1959–72. [DOI] [PMC free article] [PubMed] [Google Scholar]
- Pelekanos M, Leinenga G, Odabaee M, Odabaee M, Saifzadeh S, Steck R, Götz J. Establishing sheep as an experimental species to validate ultrasound-mediated blood-brain barrier opening for potential therapeutic interventions. Theranostics 2018;8:2583–602. [DOI] [PMC free article] [PubMed] [Google Scholar]
- Pluim JP, Maintz JB, Viergever MA. Mutual-information-based registration of medical images: a survey. IEEE Trans Med Imaging 2003;22:986–1004. [DOI] [PubMed] [Google Scholar]
- Reid SJ, McKean NE, Henty K, Portelius E, Blennow K, Rudiger SR, Bawden CS, Handley RR, Verma PJ, Faull RLM, Waldvogel HJ, Zetterberg H, Snell RG. Alzheimer’s disease markers in the aged sheep (Ovis aries). Neurobiol Aging 2017;58:112–9. [DOI] [PubMed] [Google Scholar]
- Samiotaki G, Karakatsani ME, Buch A, Papadopoulos S, Wu SY, Jambawalikar S, Konofagou EE. Pharmacokinetic analysis and drug delivery efficiency of the focused ultrasound-induced blood-brain barrier opening in non-human primates. Magn Reson Imaging 2017;37:273–81. [DOI] [PMC free article] [PubMed] [Google Scholar]
- Sanovich E, Bartus RT, Friden PM, Dean RL, Le HQ, Brightman MW. Pathway across blood-brain barrier opened by the bradykinin agonist, RMP-7. Brain Res 1995;705:125–35. [DOI] [PubMed] [Google Scholar]
- Singh A, Haris M, Rathore D, Purwar A, Sarma M, Bayu G, Husain N, Rathore RK, Gupta RK. Quantification of physiological and hemodynamic indices using T(1) dynamic contrast-enhanced MRI in intracranial mass lesions. J Magn Reson Imaging 2007;26:871–80. [DOI] [PubMed] [Google Scholar]
- Solomon I. Relaxation processes in a system of two spins. Phys Rev 1955;99:559–65. [Google Scholar]
- Stypulkowski PH, Stanslaski SR, Jensen RM, Denison TJ, Giftakis JE. Brain stimulation for epilepsy--local and remote modulation of network excitability. Brain Stimul 2014;7:350–8. [DOI] [PubMed] [Google Scholar]
- Suzuki T, Kohno H, Sakurada T, Tadano T, Kisara K. Intracranial injection of thyrotropin releasing hormone (TRH) suppresses starvation-induced feeding and drinking in rats. Pharmacol Biochem Behav 1982;17:249–53. [DOI] [PubMed] [Google Scholar]
- Tofts PS. Modeling tracer kinetics in dynamic Gd-DTPA MR imaging. J Magn Reson Imaging 1997;7:91–101. [DOI] [PubMed] [Google Scholar]
- Tofts PS, Brix G, Buckley DL, Evelhoch JL, Henderson E, Knopp MV, Larsson HB, Lee TY, Mayr NA, Parker GJ, Port RE, Taylor J, Weisskoff RM. Estimating kinetic parameters from dynamic contrast-enhanced T(1)-weighted MRI of a diffusable tracer: standardized quantities and symbols. J Magn Reson Imaging 1999;10:223–32. [DOI] [PubMed] [Google Scholar]
- Treat LH, McDannold N, Vykhodtseva N, Zhang Y, Tam K, Hynynen K. Targeted delivery of doxorubicin to the rat brain at therapeutic levels using MRI-guided focused ultrasound. Int J Cancer 2007;121:901–7. [DOI] [PubMed] [Google Scholar]
- Tung YS, Vlachos F, Feshitan JA, Borden MA, Konofagou EE. The mechanism of interaction between focused ultrasound and microbubbles in blood-brain barrier opening in mice. J Acoust Soc Am 2011;130:3059–67. [DOI] [PMC free article] [PubMed] [Google Scholar]
- van Dyck CH. Anti-amyloid-beta monoclonal antibodies for Alzheimer’s disease: pitfalls and promise. Biol Psychiatry 2018;83:311–19. [DOI] [PMC free article] [PubMed] [Google Scholar]
- West JB, Maurer CR Jr. Designing optically tracked instruments for image-guided surgery. IEEE Trans Med Imaging 2004;23:533–45. [DOI] [PubMed] [Google Scholar]
- Wohlfart S, Gelperina S, Kreuter J. Transport of drugs across the blood-brain barrier by nanoparticles. J Control Release 2012;161:264–73. [DOI] [PubMed] [Google Scholar]
- Wu SY, Aurup C, Sanchez CS, Grondin J, Zheng W, Kamimura H, Ferrera VP, Konofagou EE. Efficient blood-brain barrier opening in primates with neuronavigation-guided ultrasound and real-time acoustic mapping. Sci Rep 2018;8:7978. [DOI] [PMC free article] [PubMed] [Google Scholar]
- Yoo SS, Bystritsky A, Lee JH, Zhang Y, Fischer K, Min BK, McDannold NJ, Pascual-Leone A, Jolesz FA. Focused ultrasound modulates region-specific brain activity. Neuroimage 2011;56:1267–75. [DOI] [PMC free article] [PubMed] [Google Scholar]
- Yoo SS, Choi BG, Han JY, Kim HH. Independent component analysis for the examination of dynamic contrast-enhanced breast magnetic resonance imaging data: preliminary study. Invest Radiol 2002;37:647–54. [DOI] [PubMed] [Google Scholar]
- Yoon K, Lee W, Croce P, Cammalleri A, Yoo SS. Multi-resolution simulation of focused ultrasound propagation through ovine skull from a single-element transducer. Phys Med Biol 2018;63:105001. [DOI] [PMC free article] [PubMed] [Google Scholar]
- Zlokovic BV, Begley DJ, Chain-Eliash DG. Blood-brain barrier permeability to leucine-enkephalin, D-alanine2-D-leucine5-enkephalin and their N-terminal amino acid (tyrosine). Brain Res 1985a;336:125–32. [DOI] [PubMed] [Google Scholar]
- Zlokovic BV, Segal MB, Begley DJ, Davson H, Rakic L. Permeability of the blood-cerebrospinal fluid and blood-brain barriers to thyrotropin-releasing hormone. Brain Res 1985b;358:191–9. [DOI] [PubMed] [Google Scholar]
Associated Data
This section collects any data citations, data availability statements, or supplementary materials included in this article.