Abstract
Purpose
p53 and Ki67 status can be relevant to the management of glioblastoma. The goal of this study is to determine whether tumor morphology and bulk depicted on MRI correlate with p53 and Ki67 in glioblastoma.
Methods
A retrospective review of 223 patients with glioblastoma and corresponding p53 or Ki67 status, along with T1-weighted post-contrast MR images was performed. Enhancing tumors were outlined for determining surface regularity, tumor bulk, and necrotic volume. The median value of 0.1 was chosen for p53 and 0.2 for Ki67 to separate each data set into two classes. T-tests and receiver operating characteristic analysis were performed to determine separation of the classes and the predicting power of each feature.
Results
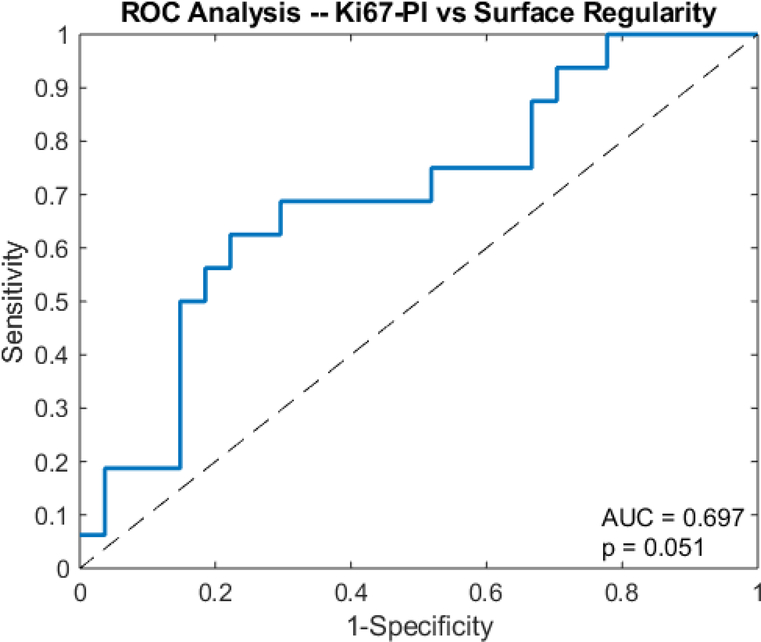
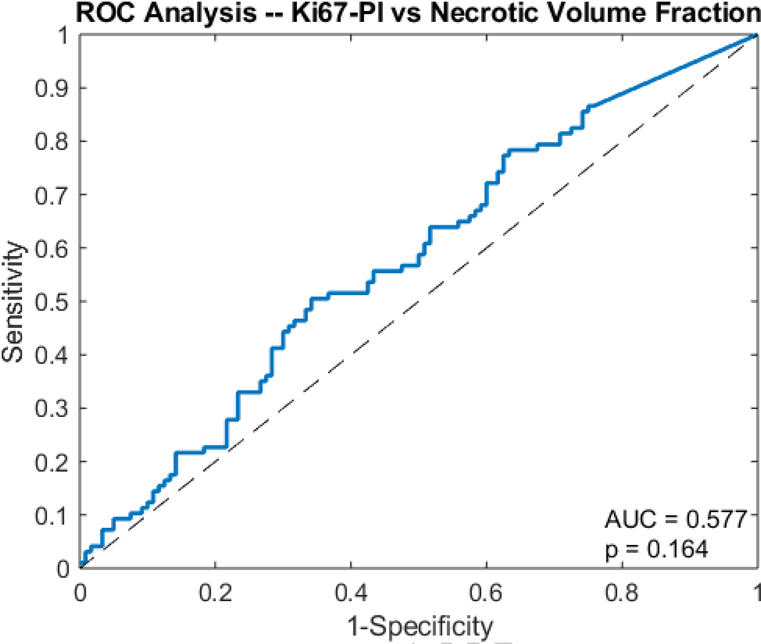
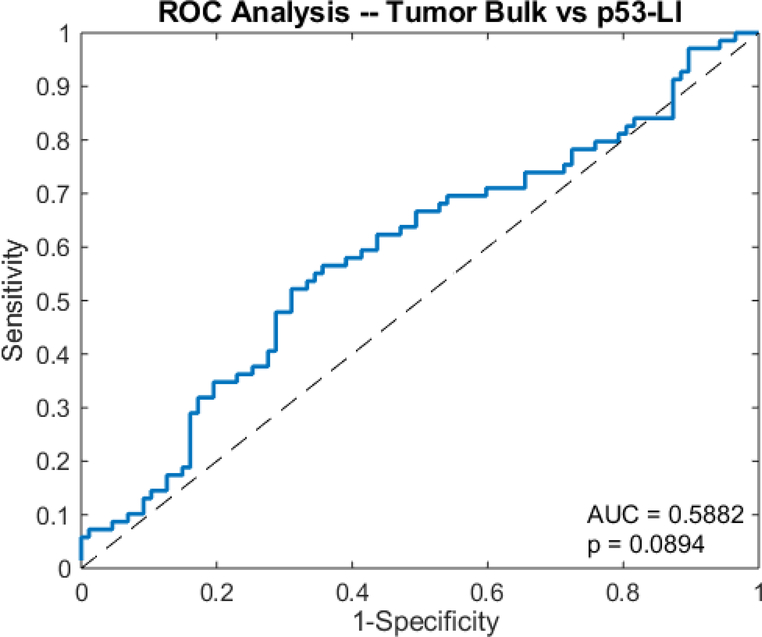
There were significant differences between tumor surface regularity (p=0.01) and necrotic volume (p=0.0429) according to Ki67 levels, although neither had statistically significant predictive power (AUC = 0.697, p = 0.0506 and AUC = 0.577, p = 0.164, respectively). There were also significant differences between tumor bulk (p=0.0239) and necrotic volume (p=0.0200) according to p53 levels, but again no significant predictive power was found using ROC analysis (AUC = 0.5882, p = 0.0894 and AUC = 0.567, p = 0.155, respectively).
Conclusion
Quantitative morphological tumor characteristics on post-contrast T1-weighted MRI can to a certain degree provide insights regarding Ki67 and p53 status in patients with glioblastoma.
Keywords: Glioblastoma, Ki67, p53, surface regularity, tumor bulk, necrotic volume
Introduction
Molecular classification of glioblastoma has been increasingly used to guide personalized treatment via targeted therapy [1,2]. Furthermore, several molecular glioma markers, such as isocitrate dehydrogenase 1 (IDH1) mutation, amplification of the epidermal growth factor receptor (EGFR), and methylation of the O6-methylguanine-DNA methyltransferase (MGMT) promoter are associated with glioblastoma treatment response, survival, and imaging biomarkers [3].
Tumor suppressor p53 mutations are common in glioblastoma and their expression correlates with a worse prognosis [5,6]. Thus, p53 mutations are potentially important markers and targets for glioblastoma therapy [5]. Indeed, p53 targeted-gene therapy and vaccinations have reached phase I clinical trials [6]. In addition, the Ki67 proliferative index (PI) is correlated with postoperative survival in gliomas and with the time to recurrence in primary glioblastomas [7]. However, there is limited information regarding quantitative MRI tumor characteristics related to p53 and Ki67 in glioblastoma. Thus, the goal of this study is to determine whether tumor morphology and bulk depicted on MRI correlate with p53 and Ki67 in glioblastoma.
Methods and Materials
Patients
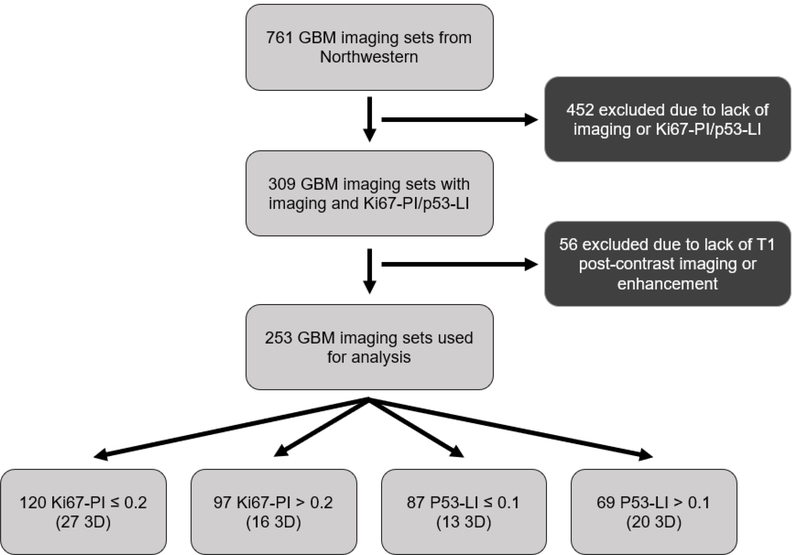
Retrospective review of consecutive patients with pathology-proven glioblastoma tumors treated at a single institution from 2000 to 2015 was performed. Only patients with a diagnosis of grade IV glioblastoma were selected. The MR images were de-identified and imported to image analysis software. The inclusion criteria consisted of availability of relevant MR imaging sequences with corresponding p53 and Ki67 data (Fig 1). A cohort of 223 patients (131 males, 92 females; average age of 57.8 ± 14.4 years) with available p53 or Ki67 data via immunohistochemistry and T1-weighted post-contrast MRI was ultimately included in the analysis. All tumors were resected or biopsied by a neurosurgeon and were diagnosed by a pathologist. This study obtained Institutional Review Board approval.
Fig 1.
Flow chart of inclusion criteria.
Imaging
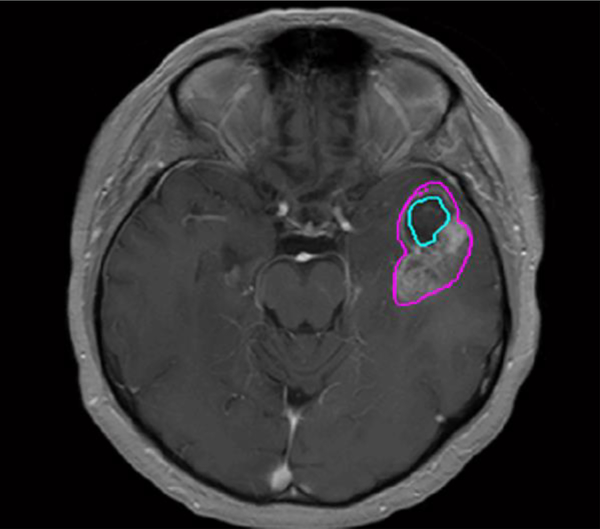
Post-contrast T1-weighted images were obtained using a variety of MRI scanners manufacturers and magnet strengths (Table 1). Regions of interest (ROIs) were drawn in MATLAB using inhouse developed software on all image slices depicting the tumor. A trained operator outlined the enhancing tumors on axial T1-weighted post-contrast images, along with necrotic areas, if present (Fig 2).
Table 1:
MRI scanners used in the study
| Philips Gyroscan NT 1.5T | 2 |
| Siemens Aera 1.5T | 1 |
| Siemens Avanto 1.5T | 102 |
| Siemens Espree 1.5T | 19 |
| Siemens NUMARIS/4 3D 1.5T | 5 |
| Siemens Skyra 3T | 29 |
| Siemens Sonata 1.5T | 8 |
| Siemens Symphony 1.5T | 31 |
| Siemens Verio 3T | 26 |
Fig 2.
Axial post-contrast T1-weighted MRI shows a left temporal lobe glioblastoma with a whole tumor ROI (pink) and necrotic area ROI (blue).
Tumor Shape Analysis
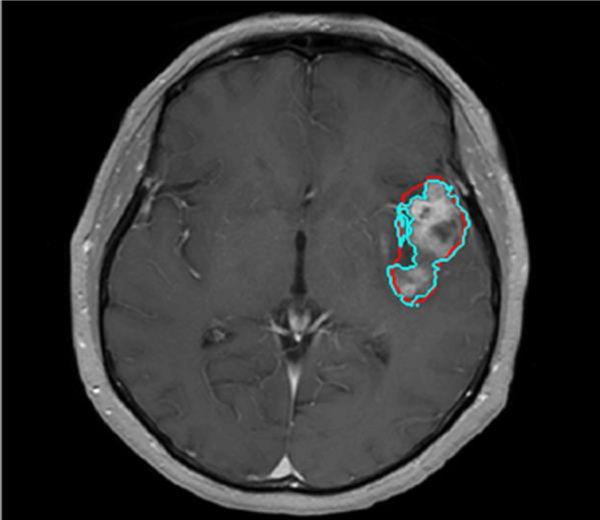
The contrast-enhanced outlines were then slightly modified by dilation, followed by gray level thresholding in order to more accurately conform to the outline of the contrast-enhanced region. We refer to this tumor segmentation algorithm of “shrink-wrapping” (Fig 3). This shrink-wrapping algorithm was validated using two separate trained operators on twenty randomly selected cases. The accuracy of the technique was evaluated through direct comparison with Regions of Interest (ROIs) under the supervision of a board certified neuroradiologist.
Fig 3.
Axial post-contrast T1-weighted MRI shows a left temporal lobe glioblastoma with whole tumor the ROI drawn by user (red) and the refitted outline based on dilation and gray level thresholding method (blue).
The outlines for the entire data set were drawn and reviewed by a single operator and visually inspected by the same neuroradiologist for accuracy. The resulting ROIs were entered into an image processing algorithm that determined surface irregularity, as well as tumor bulk. For surface regularity, the ROIs were further constructed to form a 3D image of the tumor.
In order to obtain the tumor bulk, defined as the contrast-enhanced region and the associated necrosis, the outlines were smoothed in the axial direction to reduce the sharp steps from slice-to-slice. Tumor bulk then was calculated for each imaging set by summing the volumes of truncated pyramids (Eq 1), where h is the slice thickness and An is the area of the tumor bulk on the nth slice.
| Eq 1 |
Similarly, the volume of the non-enhancing region or necrotic core can also be calculated. This value was converted into fractional necrotic volume for analysis by normalizing with the corresponding tumor bulk.
Tumor surface regularity was calculated for each imaging set by creating a dimensionless ratio where TV is the segmented tumor volume (in cubic centimeters) and where TS is the surface area (in square centimeters) of the tumor being analyzed (Eq 2). Since this calculation is dependent on the surface area, only 3D scans were included in the analysis of surface regularity.
| Eq 2 |
Ki67 and p53 Class Separation
The p53 and Ki67 data sets were treated as independent after no relationship was determined between the two genes. For the imaging sets with reported Ki67-PI, the data was separated into two classes based on the median Ki67 (median = 0.2), an approach commonly used in the literature for similar analyses [8]. Tumors that had less than or equal to 20 percent of their cells expressing the Ki67 protein were classified in the “Low Ki67” and tumors that had greater than 20 percent of their cells expressing the Ki67 protein were classified as in the “High Ki67” group. This resulted in 120 cases of Low Ki67 tumors (27 3D scans) and 97 High Ki67 tumors (16 3D scans). A similar process was conducted with analysis of the p53 data. For imaging sets with reported p53 labeling indices (LI), the data was separated into two classes based on the median p53-LI (median = 0.1). Tumors that had less than or equal to 10% of their cells expressing the p53 protein were classified in the “Low p53” and tumors that had greater than 10% of their cells expressing the p53 protein were classified as in the “High p53” group. This resulted in 87 cases of Low p53 tumors (13 3D scans) and 69 cases of High p53 tumors (20 3D scans).
Data Analysis
Accuracy was quantified based on the Dice Similarity Coefficient of the two sets of ROIs from the two blinded independent, operators. Unpaired Student’s t-tests were performed on the two classes to determine if there was a significant difference between imaging biomarkers, and receiving operator characteristic (ROC) curves were developed by varying the selected imaging biomarker threshold for classification into either the high or low class (Ki67 or p53). ROCnanalysis was performed by varying the threshold of an imaging biomarker for classification into one of the two groups. For example, the ROC curve for surface regularity as a predictor of the Ki67 subgroup was achieved by stepping through surface regularity threshold from 0 to 1 in steps of 0.0001, classifying anything above the selected threshold as the “high Ki67-PI” subgroup and below as the “low Ki67-PI” subgroup. These classifications were then compared to the true classification to construct the ROC curve. The data were statistically calculated using the Statistical Package for the Social Sciences, Version 22.0 (SPSS Inc., Chicago, IL, USA). A p value < 0.05 was considered significant.
Results
Ki67
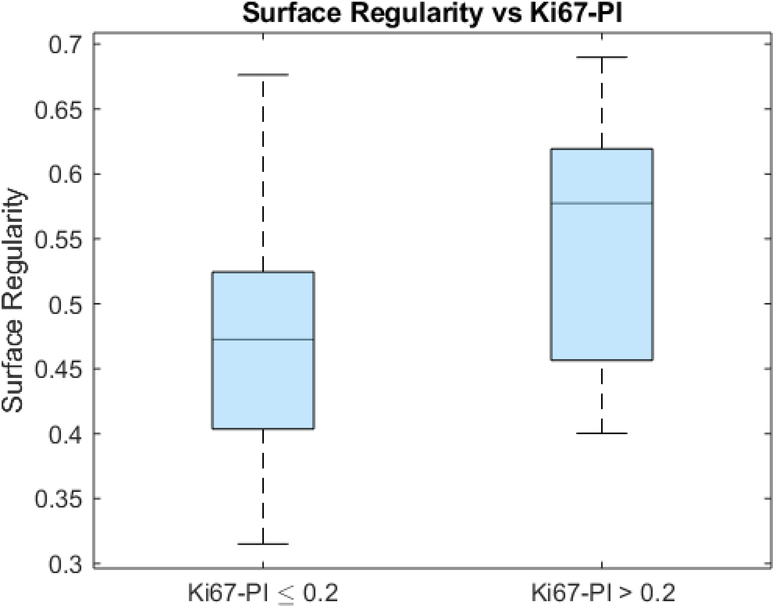
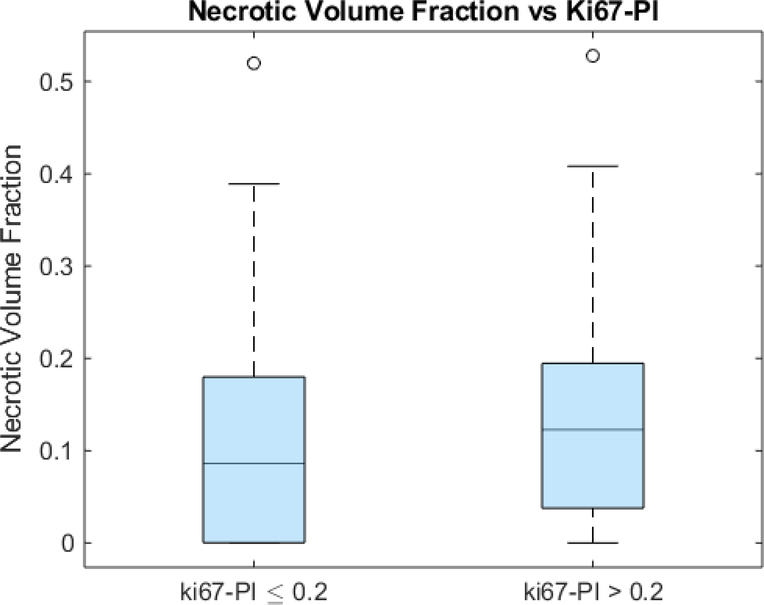
An unpaired t-test showed that the surface regularity of the high Ki67 subgroup (0.553 ± 0.098) was significantly higher than that of the low Ki67 subgroup (0.480 ± 0.095) (p=0.01) (Fig 4). ROC analysis yielded an area under the curve (AUC) of 0.697 (p=0.0506) (Fig 5). The high Ki67 subgroup (0.135 ± 0.115) had a significantly higher necrotic volume fraction than the low Ki67 subgroup (0.108 ± 0.111) (p=0.0429) (Fig 6). However, ROC analysis yielded an AUC insignificantly larger than the guessing line (AUC = 0.577, p=0.164) (Fig 7), meaning the necrotic volume fraction has no significant predictive power. Finally, there were no significant differences in the tumor bulks of the two classes (p=0.064).
Fig 4.
Box and whisker plot of surface regularity and Ki67-PI glioblastoma subgroups (p=0.0025).
Fig 5.
Receiver operator curve analysis shows the AUC of surface regularity for predicting Ki67-PI in glioblastoma.
Fig 6.
Box and whisker plot of necrotic volume fraction and Ki67-PI glioblastoma subgroups (p=0.0200).
Fig 7.
Receiver operator curve analysis shows the AUC of necrotic volume fraction for predicting Ki67-PI in glioblastoma.
p53
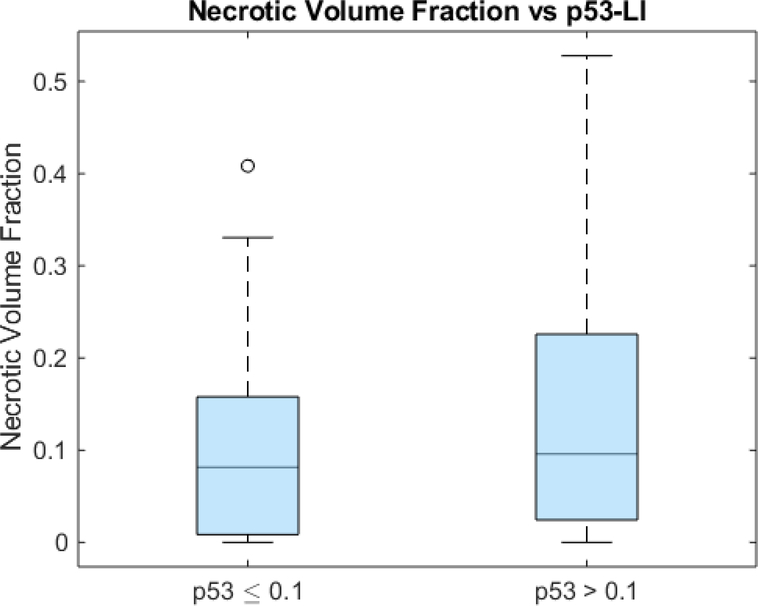
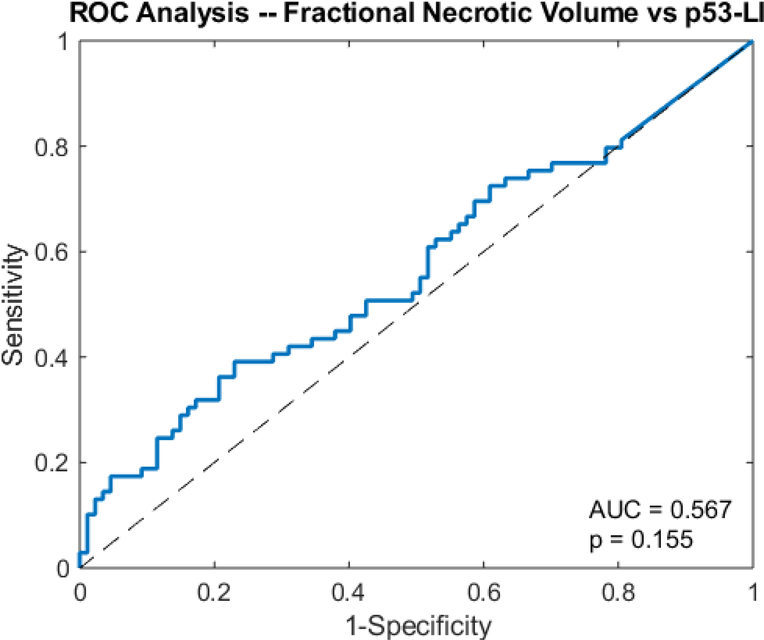
The unpaired t-test showed that the tumor bulk of the high p53 subgroup (76.7 cm3 ± 52.0) was significantly larger than that of the low p53 subgroup (61.0 cm3 ± 42.9) (p=0.0239) (Fig 8). However, ROC analysis yielded an AUC of 0.5882, which was insignificantly larger than that of the guessing line (p=0.0894) (Fig 9). As with Ki67, the two subgroups had significantly different necrotic volume fractions, in which the high p53 group (0.137 ± 0.133) had a larger necrotic volume fraction than the low p53 group (0.981 ± 0.966) (p=0.0200) (Fig 10). However, ROC analysis yielded an insignificant AUC of 0.567 (p=0.155) (Fig 11). Finally, there were no significant differences in the tumor bulks of the two classes (p=0.162).
Fig 8.
Box and whisker plot of tumor bulk and p53-LI glioblastoma subgroups (p=0.0239).
Fig 9.
Receiver operator curve analysis shows the AUC of tumor bulk for predicting p53-LI in glioblastoma.
Fig 10.
Box and whisker plot of necrotic volume fraction and p53-LI glioblastoma subgroups (p=0.0200).
Fig 11.
Receiver operator curve analysis shows the AUC of necrotic volume fraction for predicting p53-LI in glioblastoma.
Discussion
Morphologic characteristics of tumors derived from high-resolution contrast-enhanced pretreatment volumetric T1-weighted MR images can have implications on the management and survival in patients with glioblastoma. In particular, glioblastomas with irregular surfaces do not benefit from total over subtotal resection as opposed to those with regular surfaces [9]. Furthermore, MRI volumetric features, such as tumor bulk of glioblastomas provide information regarding biological processes that determine patient outcomes [10].
The results of this study demonstrate that tumor surface regularity can be an effective quantitative MRI biomarker in differentiating glioblastomas with high versus low Ki67. The association between high Ki67 and a more regular surface may be attributable to surface tension effects created by the cohesion of the cells comprising the tumor [11]. Thus, as the tumor continues to grow, in order to reduce the surface tension, the tumor grows into a shape with the smallest possible area, a sphere.
Ki67 can also be used for further classifying glioblastoma. For example, the Classical subtype is one of the four main subtypes that have been identified in glioblastoma and has certain distinguishing characteristics. High Ki67 could be linked to patients with the Classical subtype of glioblastoma [12]. This has potential clinical implications in that the Classical subtype also was found to respond the best to aggressive treatment, which includes surgery, radiation, and chemotherapy [12]. By extension, surface regularity could allow for rapid determination of Classical versus non-Classical glioblastomas and help determine the optimal treatment plan.
The mutated p53 protein has a longer half-life; therefore, a high p53 labelling index is indicative of a p53 mutation [13]. The normal p53 protein serves as an important regulator of the cell through its effects on antiproliferative pathways within the cell. Mutations in the p53 allow for cancer cells to avoid apoptosis and senescence, which ultimately allows for uncontrolled growth of the cancerous tumors. Therefore, this phenomenon could account for the the observation that glioblastomas with high p53 tend to have higher tumor bulk than low p53 tumors in this study.
Similar to Ki67, p53 can be used in further classifying glioblastomas. High p53 has been linked to the Proneural subtype of glioblastoma [12]. The Proneural subtype has been shown to be associated with younger patients and does not respond to aggressive treatment, among other unique features. Therefore, the results of this study suggest that tumor bulk could potentially be used to distinguish Proneural from non-Proneural glioblastomas thus helping physicians more accurately determine prognosis and the optimal treatment option for the patient.
It has been previously reported that glioblastoma tumor necrotic volume on pre-treatment MRI is a strong prognostic variable [14]. In particular, patients with little or no necrosis on pre-treatment MRI generally survive longer than patients with greater amounts of necrosis. Thus, the relationships between tumor necrotic volume and the different levels of p53 and Ki67 found in this study further supports the role of these biomarkers and corresponding post-contrast MRI in the management of patients with glioblastoma. Automated segmentation software can be implemented to facilitate reproducible quantification of tumor necrosis volumes and other imaging biomarkers for personalized treatment [15].
Although this study is intended to be a proof of principle for using morphological imaging features as biomarkers for Ki67 and p53 in glioblastoma, it is limited by the number of samples in the data set. Due to the small number of samples, particularly the 3D volumes necessary for an accurate surface regularity measurement, cross validation was not performed. Another limitation of this study it that since the genetic information is generally derived from a single biopsy sample, this may not be representative of the entire tumor, particularly if it is heterogeneous in this respect. In addition, given the retrospective nature of this study, many patients could not be included due to the lack of a complete set of markers and imaging. Finally, the large variation in the p53 measurements may be attributable to the variable time until patients presented with symptoms.
Conclusion
This study suggests that post-contrast T1-weighted MRI surface regularity, tumor bulk, and necrotic volume correlate with Ki67 and p53 in patients with glioblastoma. Further evaluation of how these quantitative morphological imaging features may influence management is warranted.
Acknowledgments
Funding: This work is supported, in part, by the National Institute of Biomedical Imaging and Bioengineering of the National Institutes of Health under grant number T32 EB002103.
Footnotes
Conflict of Interest: The authors declare that they have no conflict of interest.
Compliance with ethical standards
Ethical approval: For this type of study formal consent is not required.
Informed consent: For this type of study formal consent is not required.
Publisher's Disclaimer: This Author Accepted Manuscript is a PDF file of a an unedited peer-reviewed manuscript that has been accepted for publication but has not been copyedited or corrected. The official version of record that is published in the journal is kept up to date and so may therefore differ from this version.
References
- 1.Olar A, Aldape KD (2014) Using the molecular classification of glioblastoma to inform personalized treatment. J Pathol 232:165–77. [DOI] [PMC free article] [PubMed] [Google Scholar]
- 2.Touat M, Idbaih A, Sanson M, Ligon KL (2017) Glioblastoma targeted therapy: updated approaches from recent biological insights. Ann Oncol 28:1457–1472. [DOI] [PMC free article] [PubMed] [Google Scholar]
- 3.Bosnyák E, Michelhaugh SK, Klinger NV, et al. (2017) Prognostic Molecular and Imaging Biomarkers in Primary Glioblastoma. Clin Nucl Med 42:341–347. [DOI] [PMC free article] [PubMed] [Google Scholar]
- 4.Korfiatis P, Kline TL, Coufalova L, et al. (2016) MRI texture features as biomarkers to predict MGMT methylation status in glioblastomas. Med Phys 43:2835–2844. [DOI] [PMC free article] [PubMed] [Google Scholar]
- 5.Zhang Y, Dube C, Gibert M Jr (2018) The p53 Pathway in Glioblastoma. Cancers (Basel) 10 pii: E297. [DOI] [PMC free article] [PubMed] [Google Scholar]
- 6.England B, Huang T, Karsy M (2013) Current understanding of the role and targeting of tumor suppressor p53 in glioblastoma multiforme. Tumour Biol 34:2063–74. [DOI] [PubMed] [Google Scholar]
- 7.Schröder R, Feisel KD, Ernestus RI (2002) Ki-67 labeling is correlated with the time to recurrence in primary glioblastomas. J Neurooncol 56:127–32. [DOI] [PubMed] [Google Scholar]
- 8.de Azambuja E, Cardoso F, de Castro G, et al. (2007) Ki-67 as prognostic marker in early breast cancer: a meta-analysis of published studies involving 12,155 patients. Br J Cancer 96:1504–13. [DOI] [PMC free article] [PubMed] [Google Scholar]
- 9.Pérez-Beteta J, Molina-García D, Ortiz-Alhambra JA, et al. (2018) Tumor Surface Regularity at MR Imaging Predicts Survival and Response to Surgery in Patients with Glioblastoma. Radiology 288:218–225. [DOI] [PubMed] [Google Scholar]
- 10.Grossmann P, Gutman DA, Dunn WD Jr, Holder CA, Aerts HJ (2016) Imaging-genomics reveals driving pathways of MRI derived volumetric tumor phenotype features in Glioblastoma. cBMC Cancer 16:611. [DOI] [PMC free article] [PubMed] [Google Scholar]
- 11.Dechristé G, Fehrenbach J, Griseti E, Lobjois V, Poignard C (2018) Viscoelastic modeling of the fusion of multicellular tumor spheroids in growth phase. J Theor Biol 454:102–109. [DOI] [PubMed] [Google Scholar]
- 12.Verhaak RGW, Hoadley KA, Purdom E, et al. (2010) An integrated genomic analysis identifies clinically relevant subtypes of glioblastoma characterized by abnormalities in PDGFRA, IDH1, EGFR and NF1. Cancer Cell 17:98. [DOI] [PMC free article] [PubMed] [Google Scholar]
- 13.Balogh GA, Mailo D, Nardi H, et al. (2010) Serological levels of mutated p53 protein are highly detected at early stages in breast cancer patients. Exp Ther Med 1:357–361. [DOI] [PMC free article] [PubMed] [Google Scholar]
- 14.Hammoud MA, Sawaya R, Shi W, Thall PF, Leeds NE (1996) Prognostic significance of preoperative MRI scans in glioblastoma multiforme. J Neurooncol 27:65–73. [DOI] [PubMed] [Google Scholar]
- 15.Rios Velazquez E, Meier R, Dunn WD Jr, et al. (2015) Fully automatic GBM segmentation in the TCGA-GBM dataset: Prognosis and correlation with VASARI features. Sci Rep 5:16822. [DOI] [PMC free article] [PubMed] [Google Scholar]


