Abstract
Wilms’ tumor is the most common type of childhood kidney cancer. To improve risk stratification and identify novel therapeutic targets for patients with Wilms’ tumor, we used high-resolution mass spectrometry proteomics to identify urine tumor markers associated with Wilms’ tumor relapse. We determined the urine proteomes at diagnosis of 49 patients with Wilms’ tumor, non–Wilms’ tumor renal tumors, and age-matched controls, leading to the quantitation of 6520 urine proteins. Supervised analysis revealed specific urine markers of renal rhabdoid tumors, kidney clear cell sarcomas, renal cell carcinomas as well as those detected in patients with cured and relapsed Wilms’ tumor. In particular, urine prohibitin was significantly elevated at diagnosis in patients with relapsed as compared with cured Wilms’ tumor. In a validation cohort of 139 patients, a specific urine prohibitin ELISA demonstrated that prohibitin concentrations greater than 998 ng/mL at diagnosis were significantly associated with ultimate Wilms’ tumor relapse. Immunohistochemical analysis revealed that prohibitin was highly expressed in primary Wilms’ tumor specimens and associated with disease stage. Using functional genetic experiments, we found that prohibitin was required for the growth and survival of Wilms’ tumor cells. Overexpression of prohibitin was sufficient to block intrinsic mitochondrial apoptosis and to cause resistance to diverse chemotherapy drugs, at least in part by dysregulating factors that control apoptotic cytochrome c release from mitochondrial cristae. Thus, urine prohibitin may improve therapy stratification, noninvasive monitoring of treatment response, and early disease detection. In addition, therapeutic targeting of chemotherapy resistance induced by prohibitin dysregulation may offer improved therapies for patients with Wilms’ and other relapsed or refractory tumors.
Keywords: Cell Biology, Oncology
Keywords: Apoptosis, Cancer
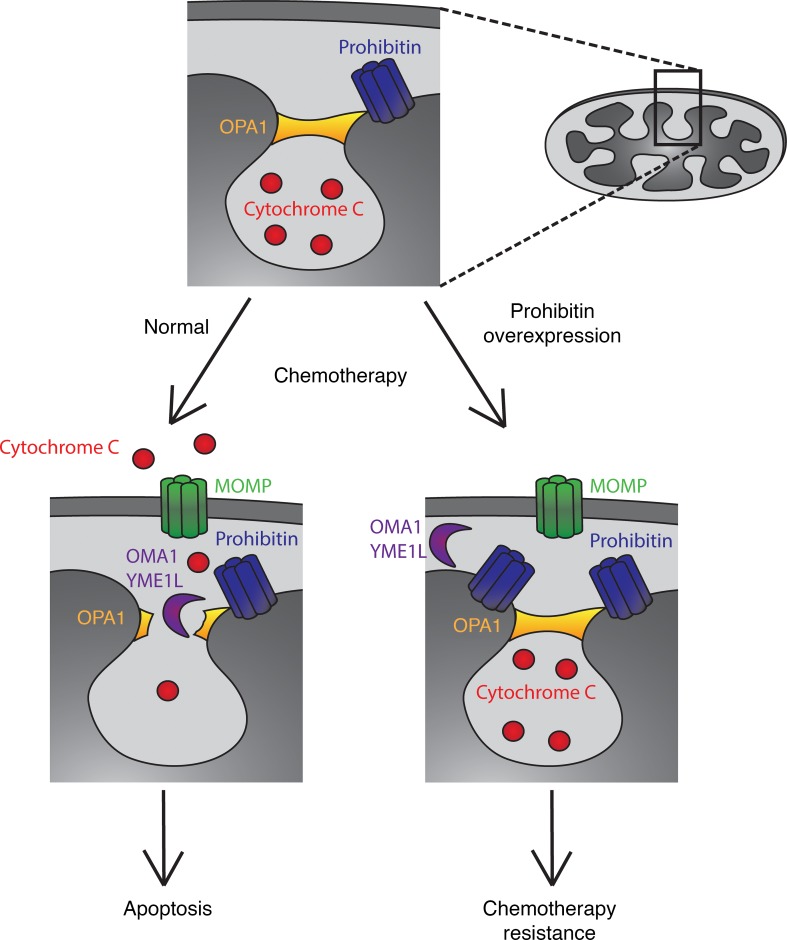
Prohibitin overexpression dysregulates mitochondrial apoptotic signaling, leading to chemotherapy resistance and Wilms tumor relapse, which can be predicted using urine prohibitin measurements in patients.
Introduction
Wilms’ tumor is the most common type of childhood kidney cancer. With current stratification and a combination of surgery, chemotherapy, and radiotherapy, more than 90% of patients with low-risk disease can now be cured (1). Treatment of patients with advanced, anaplastic, or relapsed disease remains challenging, however, with inadequate curative therapies and substantial long-term effects (1, 2).
Although anaplastic histology Wilms’ tumor, most frequently due to inactivating mutations of TP53, is associated with unacceptably poor survival rates, distinct subsets of patients with favorable-histology Wilms’ tumor also suffer disease relapse with current therapies (1, 3, 4). Loss of heterozygosity at 1p and 16q was found to be associated with inferior prognosis of favorable-histology Wilms’ tumor (4, 5). This discovery led to new clinical trials to investigate whether intensification of therapy for patients with tumor loss of heterozygosity of 1p and 16q could be used to improve survival. Additional biomarkers of adverse prognosis, therapy resistance, and disease relapse will be needed, however, for improved stratification of existing therapies and development of new therapies that are precise, curative, and safe. For renal tumors in particular, urine biomarkers offer the ability to monitor disease and therapy response noninvasively.
Neuron-specific enolase, basic fibroblast growth factor (bFGF), and hyaluronidase have been reported to be enriched in the urine of patients with Wilms’ tumor (6–9). In particular, elevation of urinary bFGF was correlated with Wilms’ tumor disease stage (7). Although its specificity and sensitivity were not sufficient to permit clinical use, continued elevation of urinary bFGF in a subset of patients with Wilms’ tumor who developed persistent or relapsed disease suggests that urine profiling may reveal prognostic biomarkers and improved therapeutic targets for patients with Wilms’ tumor and other kidney tumors.
We and others used high-resolution mass spectrometry proteomics to profile urine in order to identify improved disease biomarkers (10–13). Here, we profiled urine proteomes of patients with diverse childhood kidney tumors as compared with age-matched controls. By comparing initial urine proteomes of patients who relapsed with those who were cured, we identified elevated urinary prohibitin (PHB) at diagnosis as a prognostic biomarker of relapse in favorable-histology Wilms’ tumor. Urinary PHB elevation was significantly associated with Wilms’ tumor relapse in an independent patient cohort, with tumor PHB overexpression associated with Wilms’ tumor disease stage. Using a battery of functional studies, we found that PHB overexpression regulates mitochondrial apoptosis and induces resistance to diverse chemotherapy drugs. These findings should enable improved Wilms’ tumor therapy stratification and future strategies to overcome chemotherapy resistance to increase patients’ cure rates.
Results
Comparative urine proteomics of Wilms’ tumor, kidney rhabdoid tumor, kidney clear cell sarcoma, and renal cell carcinoma reveals biomarkers.
In previous studies, we optimized methods for the analysis of clinical urine proteomes, including protein isolation, fractionation, and high-resolution mass spectrometry (10–13). For this study of childhood kidney tumors, we assembled a cohort of specimens collected at diagnosis from 49 patients, including 16 with favorable-histology Wilms’ tumor, 6 with rhabdoid tumor of the kidney, 9 with clear cell sarcoma of the kidney, and 2 with renal cell carcinoma. For comparison, we included 16 age-matched control specimens collected from 10 healthy children and 6 children with acute abdominal pain who were evaluated as part of our prior study of acute appendicitis, and whose symptoms resolved spontaneously (11). Mass spectrometric proteomic analysis of all specimens led to the identification of 6520 urine proteins, detected with at least 2 potentially unique peptides at the false discovery rate threshold of 1% (Figure 1A). As expected, supervised analysis of all kidney tumor specimens versus the age-matched controls revealed that urine tumor proteomes are dominated by markers of tissue injury and hematuria, consistent with kidney and blood vessel invasion (Supplemental Figure 1A; supplemental material available online with this article; https://doi.org/10.1172/jci.insight.127098DS1).
Figure 1. High-accuracy mass spectrometry to profile the urine proteomes of childhood kidney tumors reveals markers of relapse and chemoresistance.
(A) Venn diagram demonstrates the distribution of proteins identified in the children without renal tumors (blue) compared with those with tumors (red) (n = 6520 proteins). (B) Heat map of top 20 proteins most highly enriched in Wilms’ tumor that relapsed (n = 56 samples). CCSK, clear cell sarcoma of the kidney; RCC, renal cell carcinoma; RTK, rhabdoid tumor of the kidney.
Importantly, supervised analysis of distinct tumor specimens revealed potentially new tumor markers, such as PGBD5 (Supplemental Figure 1B), which we recently validated as an oncogenic DNA transposase and therapeutic target in rhabdoid tumors (14–17). In the case of favorable-histology Wilms’ tumor, we identified the most abundant proteins specifically detected in Wilms’ tumor as compared with other non–Wilms’ tumor kidney tumor urine specimens (Supplemental Figures 1, B–E). Finally, we stratified patients with Wilms’ tumor based on clinical outcome and identified urine proteins detected specifically in cases of relapsed favorable-histology Wilms’ tumor as compared with favorable-histology Wilms’ tumor (Figure 1B). These included the β-catenin antagonist DACT2 and mitochondrial regulators DAD1 and PHB, among others. Thus, comparative urine proteomics can be used to identify urine biomarkers, including new tumor markers that may represent improved biomarkers and therapeutic targets.
Urine prohibitin is a prognostic marker of Wilms’ tumor relapse.
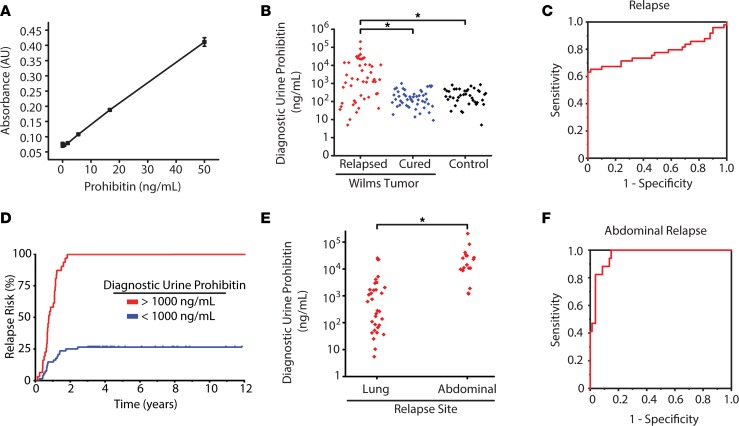
To validate their prognostic significance and identify improved therapeutic targets of relapsed Wilms’ tumor, we assembled an independent cohort of 139 specimens, including 99 favorable-histology Wilms’ tumor specimens, and 40 age- and sex-matched healthy controls (Supplemental Table 1). First, we used ELISA to measure protein concentration of candidate Wilms’ tumor markers in clinical urine specimens. We used commercially available antibodies to measure the top 3 urine markers enriched in patients with relapsed Wilms’ tumor. Although we could not develop specific ELISAs for DACT2 and DAD1 due to the limitations of commercially available antibodies, we confirmed that the ELISA for PHB provided accurate measurements of urine PHB, with a linear signal response in the ng/mL range, as determined using purified recombinant PHB (Figure 2A). Thus, we measured the urine concentration of PHB, as compared with urine creatinine (Cr) as a control for overall urine concentration (Supplemental Figure 2). We found that urine PHB was significantly enriched in diagnostic urine specimens from patients who ultimately relapsed (median, 1672 ng/mL), as compared with those from patients who were ultimately cured (median, 131 ng/mL) or age-matched controls (median, 218 ng/mL). Using logistic regression, we determined that the PHB urine concentration of 998 ng/mL was significantly associated with Wilms’ tumor relapse (OR, 153; Figure 2B). Both urine PHB concentration and urine PHB concentration normalized to urine Cr were statistically significant predictors of relapse, independent of stage and therapy (Figure 2 and Supplemental Figure 2). Similarly, receiver-operating characteristic curve analysis showed that urine PHB in patients with Wilms’ tumor relapse had the prognostic AUC of 0.78 (95% CI, 0.68–1.0; Figure 2C). Almost all patients with elevated urine PHB at diagnosis developed Wilms’ tumor relapse within 2 years of diagnosis (Figure 2D). We confirmed that urine PHB elevation was not due to overall urine concentration, as evident by the lack of statistically significant differences in urine Cr concentration (Supplemental Figure 2, A–C). We found that urine PHB was significantly elevated in patients with abdominal as compared with lung Wilms’ tumor relapse (Figure 2E). Urine PHB exhibited a near-perfect prognostic performance for abdominal Wilms’ tumor relapse, with the receiver-operating characteristic AUC of 0.96 (95% CI, 0.91–1.0; Figure 2F). In all, these results indicate that urine PHB is a significant prognostic marker of Wilms’ tumor relapse.
Figure 2. Elevated urine prohibitin at diagnosis is a specific biomarker of relapse in favorable-histology Wilms’ tumor.
(A) ELISA comparing known prohibitin levels (ng/mL) with measured absorbance via ELISA. (B) Diagnostic urine prohibitin levels (ng/mL) in patients with Wilms’ tumor who have favorable histology and relapsed (red, n = 49) are compared with those who were cured (blue, n = 50) and normal controls (black, n = 40). Exploratory simple logistic regression models determined that 998 ng/mL was the optimal cutoff point for urine prohibitin. Using Fisher’s exact test for distribution differences in dichotomized PHB among the 3 patient groups (relapsed, cured, control) revealed a statistically increased number of relapsed Wilms’ tumor with this cutoff threshold. OR of relapse for patients with diagnostic urine prohibitin greater than 998 ng/mL = 153 (95% CI, 19.6–1,000). (C) A receiver-operating characteristic curve demonstrates the prognostic power of diagnostic urine prohibitin to predict relapse in favorable-histology Wilms’ tumor at different sensitivity and specificity with an AUC of 0.78 (95% CI, 0.68–1.0). (D) Risk of relapse in patients with favorable-histology Wilms’ tumor are stratified by those with a diagnostic urine prohibitin greater than 998 ng/mL (red, n = 31) compared with those with a diagnostic urine prohibitin less than 998 ng/mL (blue, n = 68). (E) Diagnostic urine prohibitin levels in relapsed patients with favorable-histology Wilms’ tumor are stratified by site of relapse. (F) A receiver-operating characteristic curve demonstrates the prognostic power of diagnostic urine prohibitin to predict abdominal relapse in favorable-histology Wilms’ tumor at different sensitivity and specificity with an AUC of 0.96 (95% CI, 0.91–1.0).
Prohibitin is overexpressed in Wilms’ tumor cells and correlates with tumor stage.
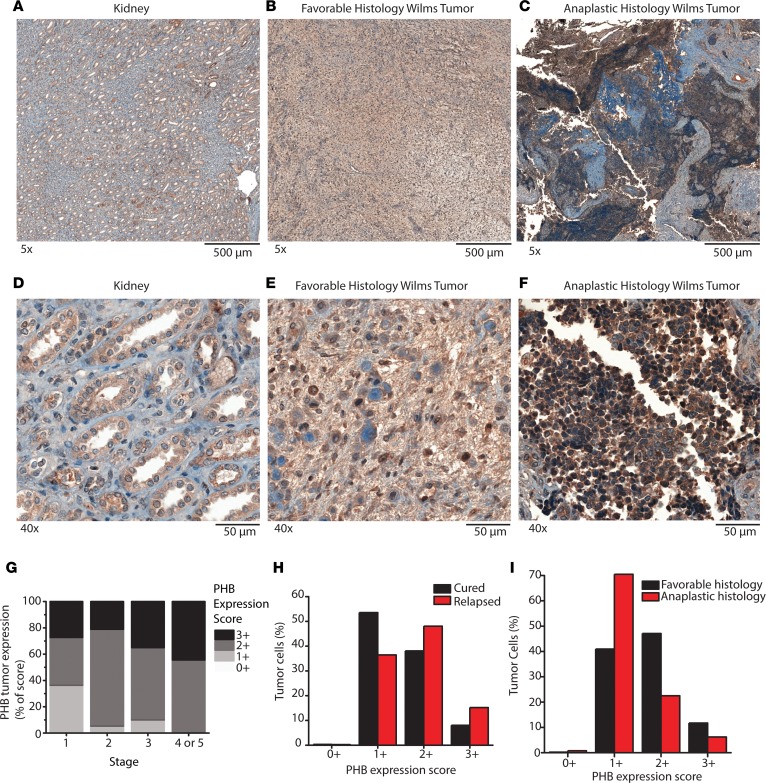
To determine whether elevated PHB in Wilms’ tumor patient urine samples was due to the increased expression of PHB in Wilms’ tumor cells, we used immunohistochemistry (IHC) of formalin-fixed paraffin-embedded primary patient Wilms’ tumor specimens, as compared with adjacent normal kidney tissue. We found that PHB was highly expressed in both favorable-histology Wilms’ tumor (Figure 3, B and E) as well as diffusely anaplastic Wilms’ tumor (Figure 3, C and F). In agreement with prior studies, we also observed PHB expression in normal kidney tubules (Figure 3, A and D, and ref. 18). We assembled a cohort of 59 primary favorable-histology Wilms’ tumor specimens and 10 control non–Wilms’ tumor benign and malignant renal samples, uniformly stained for PHB (Supplemental Table 2). We scored IHC PHB expression in a blinded manner on a scale from 0 to 3+. Representative images of score levels are shown in Supplemental Figure 3. Notably, all Wilms’ tumors expressed PHB from 1+ to 3+ (Supplemental Figures 3D–F). Consistent with the specific detection of PHB in Wilms’ tumor but not other kidney tumors (Figure 1B), we found no detectable PHB expression in premalignant nephrogenic rests (Supplemental Figure 3A), embryonal rhabdomyosarcoma (Supplemental Figure 3B), and clear cell sarcoma of the kidney (Supplemental Figure 3C). We found that PHB expression in patients with Wilms’ tumor correlated with higher tumor stage and increased percentage of tumors with higher PHB expression (Figure 3G).
Figure 3. Prohibitin is highly expressed in primary Wilms’ tumor samples.
(A–F) PHB IHC staining was performed on formalin-fixed paraffin-embedded primary Wilms’ tumor samples and compared with adjacent normal kidneys. Original magnification, ×5 (A–C); ×40 (D–F). A and D include normal kidney. B and E include favorable-histology Wilms’ tumor. C and F include anaplastic histology Wilms’ tumor. (G) IHC was performed on a tissue microarray containing 59 primary Wilms’ tumor samples and graded from 0+ to 3+ in a blinded manner. Quantification of IHC from the tissue microarray is shown and stratified by initial tumor stage. (H and I) A second cohort of 38 patients with primary Wilms’ tumor was assessed (15 cured, 16 relapsed, 7 no information; 24 favorable, 14 anaplastic Wilms’ tumor). The expression of PHB was evaluated on a cell-by-cell basis using Halo imaging analysis software. A total of 24,862,509 cells were counted and scored from 0+ to 3+ based on PHB expression. In H, PHB expression in the cells of Wilms’ tumor that ultimately relapsed are compared with those that were cured. Whereas in I, PHB expression in the cells of Wilms’ tumor that had favorable histology are compared with those with anaplastic histology.
We further validated PHB expression using quantitative image densitometry in a second cohort of 38 patients with primary Wilms’ tumor, including both favorable-histology and anaplastic Wilms’ tumor (Supplemental Table 4). We observed increased PHB expression in favorable-histology Wilms’ tumor cells of specimens that ultimately relapsed, as compared with those cured by surgery and chemotherapy (Figure 3H). On a per-cell basis, PHB expression was increased in favorable-histology Wilms’ tumor as compared with anaplastic histology Wilms’ tumor (Figure 3I). We did not observe a statistically significant correlation between PHB mRNA expression and TP53 mutations in diffusely anaplastic Wilms’ tumor samples (Supplemental Figure 4). Likewise, we did not find recurrent mutations or amplification of PHB in a recently analyzed cohort of 117 patient Wilms’ tumor specimens (19). Although we found cellular PHB expression was similar between Wilms’ tumor and some normal kidney cells (Supplemental Figure 5A), we found that Wilms’ tumor cells were on average 12% smaller, with 27% smaller cytoplasm and 11% larger nuclei, as compared with normal kidney cells (Supplemental Figure 5B). These findings suggest that Wilms’ tumor cells overexpress PHB in specific subcellular compartments, presumably through posttranscriptional mechanisms.
PHB is required for the growth and survival of Wilms’ tumor cells by regulating mitochondrial functions.
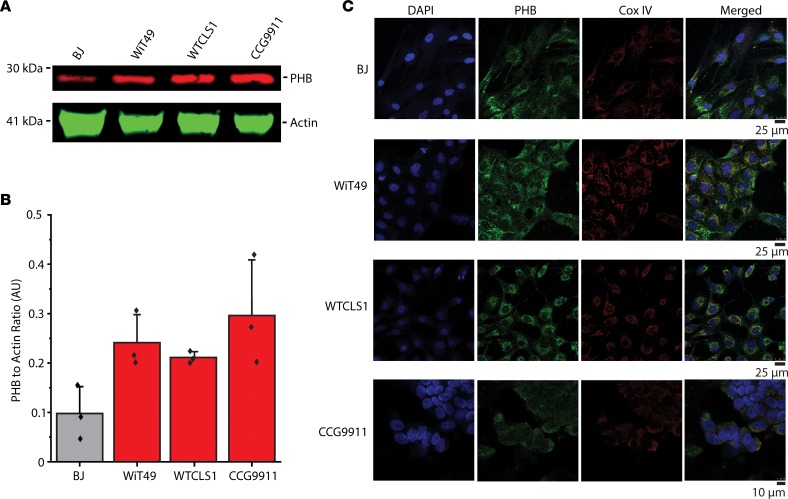
Relative overexpression of PHB in Wilms’ tumor cells suggests that PHB may contribute to their growth and survival. To assess this hypothesis, we examined PHB expression and subcellular localization in WiT49 and CCG9911 Wilms’ tumor cell lines. We also evaluated immortalized human BJ fibroblasts and WT-CLS1, previously reported to be a Wilms’ tumor cell line, but recently recharacterized as a malignant rhabdoid tumor of the kidney due to the presence of disease-defining SMARCB1 mutation (20). Using quantitative fluorescent Western blot immunoassays, we found that PHB is more highly expressed in renal tumor cell lines, as compared with BJ fibroblasts (Figure 4A). Normalized to cellular actin, PHB expression was an average 2.9-, 2.7-, and 3.3-fold higher in the WiT49, WT-CLS1, and CCG9911 cells, respectively, as compared with normal BJ fibroblasts (Figure 4B).
Figure 4. Prohibitin exhibits largely mitochondrial expression in Wilms’ tumor cell lines.
(A) Our in vitro studies of PHB included a control fibroblast cell line (BJ) as well as renal tumor cell lines (WiT49, WT-CLS1, and CCG9911). Endogenous PHB expression in the renal tumor cell line is shown with actin as a loading control. (B) PHB expression is compared in the different cell lines normalized to actin in Western blot triplicates. (C) Confocal fluorescence microscopy demonstrates that most cellular PHB (green) colocalizes with the inner mitochondrial membrane marker CoxIV (red) but not the nuclear marker DAPI (blue) in paraformaldehyde-fixed cells.
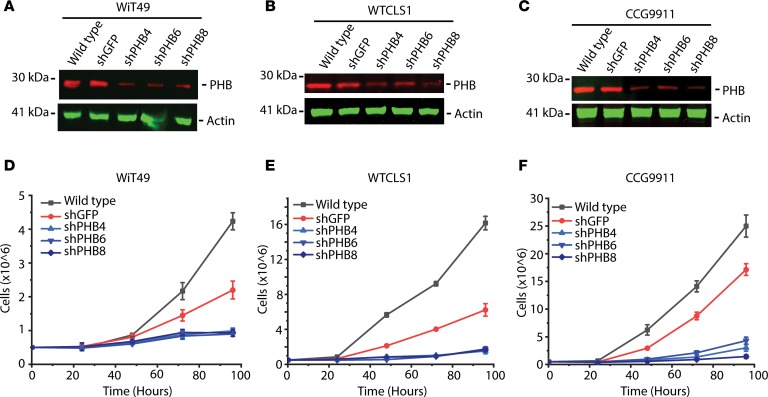
Relative overexpression of PHB in Wilms’ tumor cells and their relatively smaller size as compared with normal cells suggests that tumor PHB overexpression may be due to its increased expression in specific subcellular compartments, such as mitochondria (21). Compelled by the finding of PHB staining in the cytoplasm of Wilms’ tumor cells (Figure 3), we used confocal immunofluorescence microscopy to define the subcellular localization of PHB in Wilms’ tumor cell lines. PHB has been variously described as either a predominantly nuclear or predominantly mitochondrial protein, with reportedly disparate roles based on subcellular localization (21). We observed that most, but not all, of cellular PHB colocalized with the specific mitochondrial inner membrane marker CoxIV rather than the nuclear marker DAPI (Figure 4C). These findings are consistent with prior studies that identified PHB heterodimerization with PHB2 in association with the inner mitochondrial membrane to regulate mitochondrial morphogenesis (22–27). Thus, we reasoned that PHB overexpression may contribute to the growth or survival of Wilms’ tumor cells. To test this hypothesis, we used 3 independent shRNA interference lentiviral constructs to deplete PHB and compared cell growth with the control shRNA targeting the GFP, which is not expressed (Figure 5, A–C). We confirmed PHB depletion using Western immunoblotting (Figure 5, A–C). Consistently, cells depleted of PHB exhibited significantly decreased proliferation, as compared with WT cells or those expressing the control GFP-targeting shRNA (Figure 5, D–F) indicating that PHB is required for cell growth or survival.
Figure 5. Prohibitin is required for Wilms’ tumor growth and survival.
(A–C) Western blots of WT renal tumor cells (A, WiT49; B, WT-CLS1; C, CCG9911) as well as a nontargeting green fluorescence protein (shGFP) and 3 different shRNA hairpins targeting the PHB 3′UTR (shPHB4) and CDS (shPHB6 and shPHB8). Actin is used for whole cell loading control. (D–F) Cell growth over time in renal tumor cells (D, WiT49; E, WT-CLS1; F, CCG9911), which are WT (black), compared with those transduced with nontargeting shGFP (red) and the 3 PHB targeting shRNA (blue).
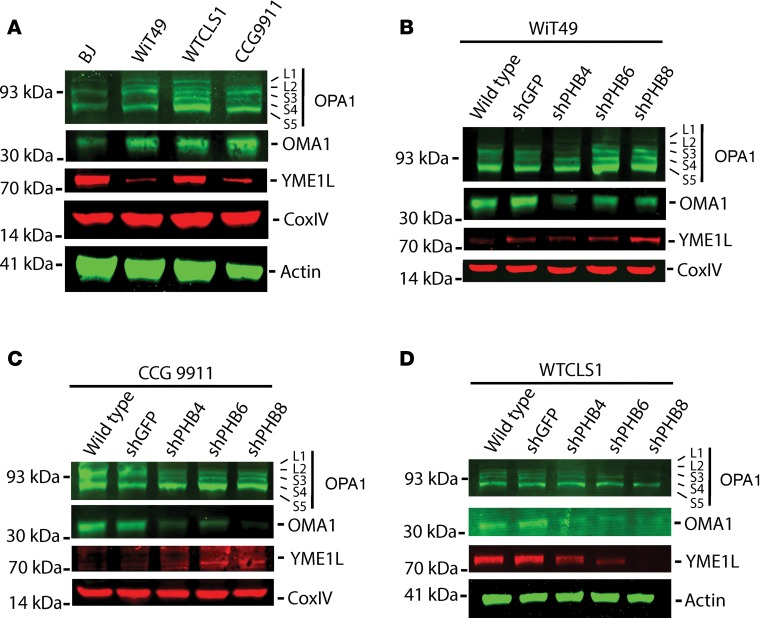
PHB has been reported to regulate mitochondrial morphology by interacting with the OPA1 GTPase, and the YME1L and OMA1 proteases that proteolytically process OPA1 that can control the release of cytochrome c from mitochondrial cristae during apoptosis (22, 23, 28–33). We found that renal tumor cells have elevated levels of OMA1 relative to BJ fibroblasts, whereas BJ and WT-CLS1 cells had much higher levels of YME1L than Wilms’ tumor cells (Figure 6A). Consistent with the putative interaction of PHB with OPA1, depletion of PHB was associated with apparent reduction of OMA1 in all cell lines tested, but not in control cells transduced with GFP-targeting controls (Figure 6, B–D). Because YME1L and OMA1 can proteolytically cleave OPA1, we analyzed apparent OPA1 isoforms by Western immunoblotting (31, 34). We found that in WT-CLS1 cells, which have relatively elevated endogenous YME1L, depletion of PHB was associated with a reduction of YME1L and the S4 isoform of OPA1, the byproduct of YME1L-mediated proteolysis (Figure 6D). Conversely, in Wilms’ tumor cells with relatively low endogenous YME1L, depletion of PHB increased YME1L and the S4 OPA1 isoform (Figures 6, B and C). In all, these findings indicate that PHB directly or indirectly interacts with the mitochondrial intermembrane proteases OMA1 and YME1L, which are expressed at varying levels in different tumor types and may cooperatively process OPA1.
Figure 6. Depletion of prohibitin results in alterations in mitochondrial intermembrane proteases and structural proteins involved in apoptosis and mitochondrial morphogenesis.
(A) Western blot of endogenous expression of OPA1, OMA1, and YME1L with CoxIV and actin as mitochondrial and whole cellular loading controls, respectively. (B–D) Western blots of OPA1, OMA1, and YME1L in renal tumor cells (B, WiT49; C, WT-CLS1; D, CCG9911) comparing WT cells with nontargeting shGFP and 3 different shRNA hairpins targeting the PHB 3′UTR (shPHB4) and CDS (shPHB6 and shPHB8). Loading controls as shown.
PHB overexpression causes resistance to mitochondrial apoptosis and diverse chemotherapy drugs.
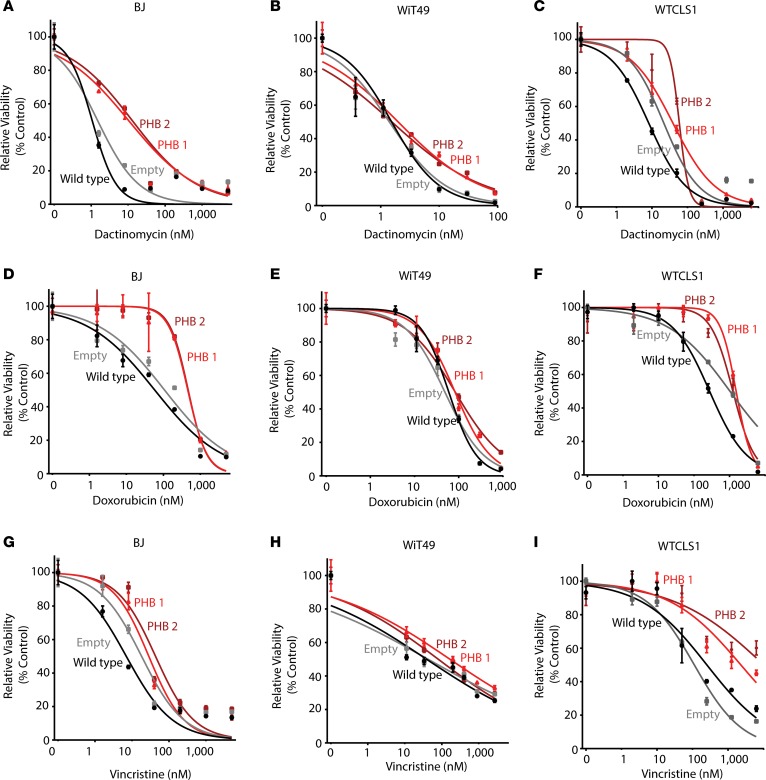
PHB-mediated control of OPA1 processing that can regulate apoptotic cytochrome c release raises the possibility that PHB overexpression in patients with Wilms’ tumor may impair mitochondrial apoptosis and cause chemotherapy resistance. To test this hypothesis, we ectopically overexpressed PHB in Wilms’ tumor cell line WiT49 as well as WT-CLS1 rhabdoid tumor and BJ fibroblasts using lentiviral transduction and confirmed transgene expression by Western immunoblotting of PHB and its V5 epitope tag in 2 independent clones (Figure 7). Although we found relatively modest overexpression of PHB compared with its endogenous levels, all PHB-overexpressing cells exhibited significantly increased resistance to vincristine, doxorubicin, and dactinomycin, as compared with WT cells or control cells transduced with empty vectors (Figure 8). This effect was generalized but more pronounced in BJ fibroblasts and WT-CLS1 rhabdoid tumor cells, as compared with WiT49 Wilms’ tumor cells (Figure 4).
Figure 7. Overexpression of prohibitin in Wilms’ tumor and control cell lines.
(A–C) Western blots of PHB and V5 in control (A, BJ) and renal tumor cells (B, WiT49; C, WT-CLS1) comparing WT cells and those transduced with an empty vector with 2 different clones transduced with a PHB-expressing vector containing a V5 tag. Colors were reversed in V5 and bottom actin blots.
Figure 8. Overexpression of prohibitin results in resistance to diverse chemotherapy drugs in both Wilms’ tumor and control cells.
Dose response curve of BJ (A, D, and G), WiT49 (B, E, and H), and WT-CLS1 (C, F, and I) cells treated with dactinomycin (A–C), doxorubicin (D–F), or vincristine (G–I) for 72 hours comparing WT cells (black), empty vector transduced cells (gray), as well as PHB-transduced cells (red, dark red).
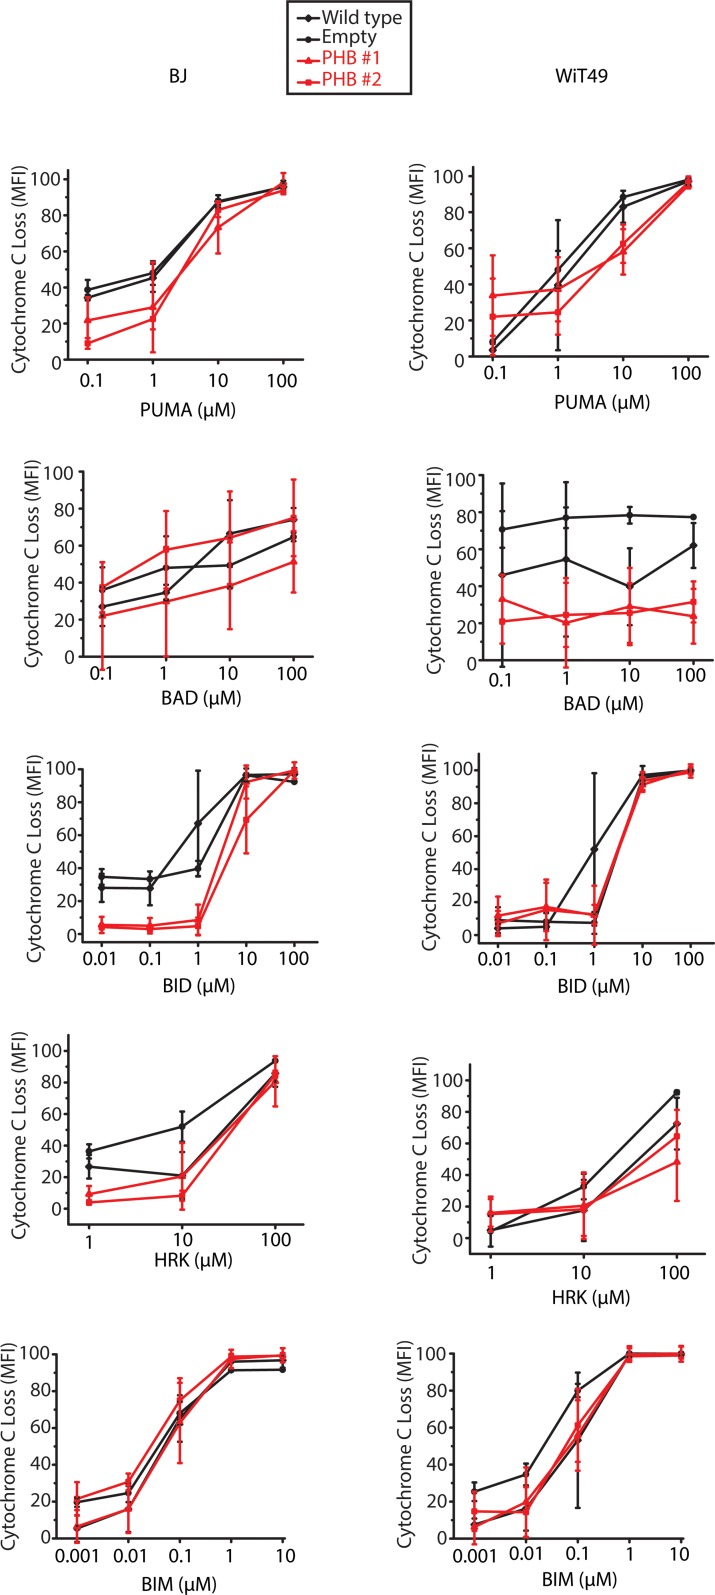
Overexpression of PHB in patient Wilms’ tumor and urine, its requirement for enhanced Wilms’ tumor cell growth, control of OPA1 and other factors that can regulate mitochondrial cytochrome c release, and sufficiency to cause resistance to chemotherapy drugs with diverse mechanisms of action in several cell types suggested that PHB overexpression may contribute to Wilms’ tumor therapy failure and relapse by blocking intrinsic mitochondrial apoptosis. To test this prediction, we used BH3 profiling, a dynamic assay of mitochondrial apoptotic function, of WiT49 Wilms’ tumor and BJ fibroblast cells (Figure 9 and Supplemental Figure 6), as optimized to specifically measure mitochondrial cytochrome c release using flow cytometry (35). Upon activation of mitochondrial apoptosis, we observed that PHB overexpression caused increased resistance to many different synthetic BH3 apoptotic activators, including PUMA, BAD, and BID (Figure 9 and Supplemental Figure 6).
Figure 9. BH3 profiling reveals globally decreased apoptotic priming in response to PHB overexpression.
Cytochrome c loss in response to treatment with different proapoptotic peptides comparing WT (black diamond), with empty (black circles), and 2 PHB overexpressing cell lines (red triangle, red square) in both BJ control fibroblasts and WiT49 Wilms’ tumor.
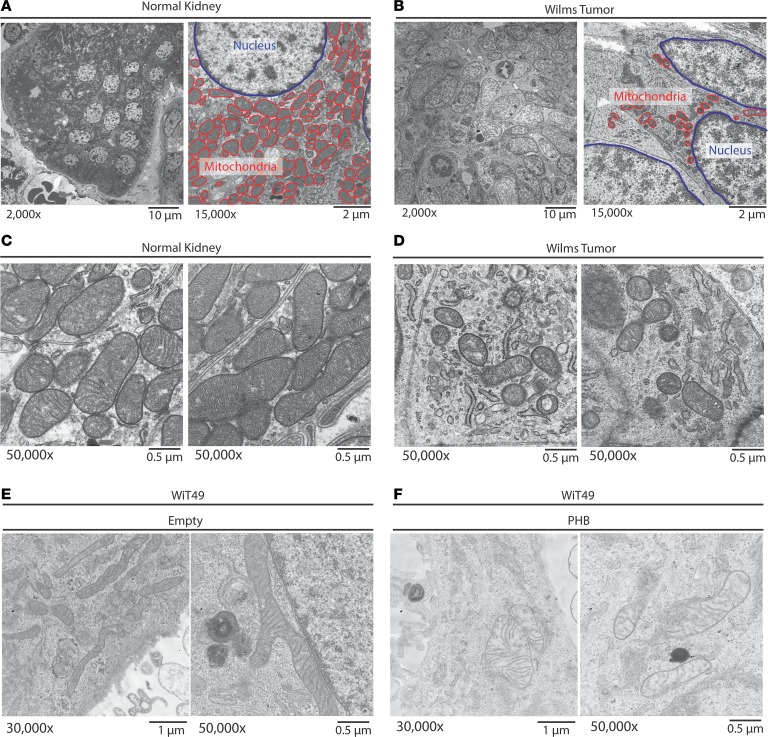
To further elucidate mitochondrial abnormalities in patients with Wilms’ tumor, we used transmission electron microscopy to determine the mitochondrial structure of newly diagnosed favorable-histology Wilms’ tumor immediately following nephrectomy. We observed that Wilms’ tumor cells exhibited smaller mitochondria with blunted cristae and reduced matrix density, as compared with normal kidney tissue (Figure 10, A–C). This finding is consistent with abnormal mitochondrial fission in Wilms’ tumor, in agreement with aberrant mitochondrial morphogenesis induced by PHB overexpression and prior ultrastructural studies of Wilms’ tumor (36). Thus, PHB overexpression causes intrinsic mitochondrial apoptosis resistance, thereby promoting chemotherapy resistance and Wilms’ tumor therapy failure.
Figure 10. Primary Wilms’ tumor samples exhibit fewer mitochondria and predominantly a mitochondrial fission phenotype, as compared with adjacent normal kidneys.
(A–D) Untreated favorable-histology Wilms’ tumor was immediately fixed following nephrectomy and imaged using a transmission electron microscope to evaluate mitochondrial morphology. The normal kidney (original magnification, ×2,000 [A, left]; ×50,000 [C]) is compared with the Wilms’ tumor (original magnification, ×2,000 [B, left]; ×50,000 [D]). A and B also highlight (original magnification, ×15,000, right) the size and number of the mitochondria (red) as compared with the nucleus (blue). (E and F) Characteristic mitochondria of Wilms’ tumor cells (WiT49) treated with an empty vector (E) compared with a PHB overexpressing vector (F).
Discussion
Pathogenesis of childhood solid tumors remains poorly understood (15). In particular, distinct renal tumors remain difficult to treat, with limited knowledge of prognostic biomarkers and therapeutic targets. In the case of Wilms’ tumor, the most common type of childhood kidney cancer, subsets of patients remain incurable, with no effective means to monitor therapy response, stratify existing therapies, or identify improved therapeutic targets. In this context, our findings are significant for several reasons. First, reported urine proteome profiles of diverse kidney tumors provide a valuable source of potential tumor biomarkers and therapeutic targets. Our recent study of PGBD5, identified in the proteomic profiles of renal rhabdoid tumors, revealed an unanticipated mechanism of human tumor pathogenesis and molecular target for improved therapy (15–17).
In the case of Wilms’ tumor, we found that overexpression of PHB at diagnosis is a significant prognostic marker of Wilms’ tumor relapse. Levels of urinary PHB above 998 ng/mL were found to be significantly associated with relapse in independent cohorts of patients with Wilms’ tumor (Figures 1 and 2). PHB overexpression was found to be elevated not only in urine but also in tumor tissue samples in both favorable and anaplastic histology Wilms’ tumor and primarily localized to the mitochondria (Figures 3 and 4). We found that PHB was required for the growth and survival of Wilms’ tumor cells, at least in part by regulating mitochondrial function and apoptosis (Figures 5 and 6). Importantly, ectopic overexpression of PHB was sufficient to cause resistance to diverse chemotherapy drugs used for clinical treatment of Wilms’ tumor. PHB overexpression blocked cytochrome c release from mitochondria, an essential step in the initiation of intrinsic mitochondrial apoptosis (Figures 7–9), at least in part by dysregulating mitochondrial cristae (Figure 10). Thus, we propose that PHB overexpression can impair mitochondrial morphogenesis and apoptotic priming, thereby causing chemotherapy resistance, which can be monitored noninvasively by urine PHB measurements (Figure 11).
Figure 11. PHB overexpression leads to failure to release cytochrome c from cristae junctions despite the presence of a MOMP complex.
Prohibitin (blue) forms a complex along the mitochondrial inner membrane that interacts with several key regulators of apoptosis, including the OPA1 complex (orange) located at cristae junctional openings. The majority of cytochrome c (red) is sequestered within these cristae and in response to apoptotic stimuli such as chemotherapy, the MOMP complex consisting of BAX and BAK is inserted into the mitochondrial outer membrane. Upon proteolysis of the OPA1 complex, generally via OMA1 or other intermembrane proteases (purple), cytochrome c is released into the cytosol where it results in the apoptotic cascade. Our model proposes that due to the overexpression of PHB, in response to apoptotic stimuli, intermembrane proteases are no longer able to access the OPA1 complex, thereby resulting in resistance to chemotherapy despite the presence of a MOMP pore in the outer mitochondrial membrane, ultimately resulting in failure to undergo apoptosis and chemotherapy resistance.
Overexpression of PHB has been described in other tumors, such as breast carcinomas, where somatic amplifications of the PHB gene have been reported in a subset of tumors (37–39). Larger chromosomal gains on 17q are classically seen in patients with high-risk neuroblastoma where PHB promotes tumor proliferation and mediates dedifferentiation (40). We did not observe any cases of Wilms’ tumor with PHB mutations or amplifications, suggesting that Wilms’ tumor overexpression of PHB may involve posttranscriptional mechanisms. PHB expression has been found to be regulated by miR-27a in other tissues (41–44), and miR-27a is significantly downregulated in chemotherapy-resistant blastemal Wilms’ tumor (45). Because several miRNA-processing genes are recurrently mutated in subsets of Wilms’ tumor, it is possible that PHB overexpression is caused by miRNA dysregulation, potentially including miR-27a. Future studies will be needed to determine the mechanisms of potential regulation of PHB expression by miRNAs and causes of its pathogenic overexpression. Likewise, additional studies will be needed to determine the prevalence and function of PHB in patients with highly chemotherapy-resistant anaplastic Wilms’ tumor.
We found urine PHB to be elevated in the majority of patients with favorable-histology Wilms’ tumor whose disease ultimately relapsed (Figure 2B). These diagnostic urine PHB levels were generally orders of magnitude higher in patients with ultimately relapsed Wilms’ tumor as compared with cured patients (Figure 2B). In primary tumor tissue samples, however, PHB was significantly but modestly overexpressed in patients with relapsed Wilms’ tumor as compared with those who had cured Wilms’ tumor and normal kidney tissue (Figure 3 and Supplemental Figure 5). Thus, urine PHB elevation may be due to increased Wilms’ tumor cell invasion and PHB release into renal tubules, as suggested by the increased invasiveness of colorectal and lung carcinomas with PHB overexpression (46–48). This possibility is further supported by the relatively higher frequency of abdominal Wilms’ tumor relapse in patients with elevated urine PHB (Figure 2E). Additional studies will be needed to establish the mechanisms and significance of this possible phenomenon and its relationship with abnormal mitochondrial structure and function induced by PHB overexpression. If PHB overexpression causes increased Wilms’ tumor cell invasion, however, then augmenting local control measures such as additional lymph node dissection and radiation therapy may be helpful.
Our findings implicate the interaction between PHB and the mitochondrial proteases OMA1 and YMEL1 in the dysregulation of mitochondrial cristae function and apoptotic cytochrome c release. It is possible that the ring complex formed by PHB and PHB2 affects the OPA1 GTPase that remodels mitochondrial cristae by sequestering the inner mitochondrial membrane OMA1 and YMEL1 proteases within microdomains, which are unable to access OPA1 (22, 49). As a result, PHB overexpression would impair the release of cytochrome c from mitochondrial cristae, blocking the initiation of mitochondrial apoptosis, as well as altering the dynamics of mitochondrial morphogenesis, which could further contribute to alterations in apoptosis or other cellular functions (29–31, 34, 50). First, although the PHB complex is associated with the inner mitochondrial membrane, it has been shown to interact with BAX and BAK that comprise the apoptotic mitochondrial outer membrane permeabilization (MOMP) pore (21, 51). Second, in addition to modulating cytochrome c release at crista junctions, PHB overexpression may also impair the formation or function of the MOMP pore. Third, PHB overexpression may impair apoptosis because the properties of the mitochondrial outer membrane govern the ability of the predominantly cytosolic BAX to insert into the mitochondrial outer membrane as well as its ability for subsequent activation by BH3-only proteins (52, 53). Notably, this impaired BAX membrane insertion would be expected in smaller, hyperfragmented mitochondria produced as a result of mitochondrial fission (52). Finally, PHB overexpression can also affect the energetic and metabolic mitochondrial functions, as well as its other cellular functions, such as regulation of cytosolic signaling. For example, PHB has been reported to interact with the mitochondrial respiratory machinery, and therefore, it is also possible that PHB-mediated overexpression co-opts mitochondrial respiration (27). An analogous mechanism was described wherein inhibitory factor 1 mediated a decrease in OMA1 proteolysis and resulted in impaired OPA1 cleavage by maintaining ATP levels thereby reducing glutathione consumption and inactivating peroxiredoxin 3 during apoptosis (54). Importantly, given that rocaglamides and aurilide can interact with PHB, it is possible that their derivatives can be developed to specifically interfere with the oncogenic functions of PHB (55–58). Finally, as PHB is overexpressed in other tumors and we revealed that PHB overexpression is sufficient to cause resistance to chemotherapy not only in patients with Wilms’ tumor but also in rhabdoid tumors and immortalized fibroblasts, developing therapies to target PHB overexpression may be broadly applicable to a variety of cancers.
In all, PHB-mediated evasion of apoptosis through dysregulation of mitochondrial cristae function represents a previously unanticipated mechanism by which Wilms’ tumor cells resist cell death, thereby causing therapy failure and Wilms’ tumor relapse. Noninvasive monitoring of urine prohibitin offers an immediately accessible biomarker to identify and treat patients at risk for Wilms’ tumor relapse, which should be investigated in future prospective clinical trials.
Methods
Mass spectrometry.
Urine specimens were fractionated, and the protein composition of the fractions was identified by using high-resolution mass spectrometry as described previously (13). Briefly, individual 5-mL urine aliquots were fractionated using ultracentrifugation, protein precipitation, and denaturing polyacrylamide gel electrophoresis, and protein fractions were reduced, alkylated, and trypsin digested. Urine protein fractions were subjected to liquid chromatography tandem mass spectrometry using a nanoflow HPLC system (Eksigent) coupled to the hybrid linear ion trap Fourier transform ion cyclotron resonance mass spectrometer (LTQ FT Ultra, Thermo Scientific). Resultant spectra were processed to extract the 200 most intense peaks and searched against the human International Protein Index database (version 3.69) by using MASCOT version 2.1.04 (Matrix Science). Assessment of identification accuracy was carried out by searching a decoy database composed of reversed protein sequences of the target IPI database. Only proteins identified on the basis of 2 or more unique peptides were included in the analysis, at a false discovery rate of less than 1% at the peptide level. Mass spectrometry data are openly available at PeptideAtlas (http://www.peptideatlas.org/PASS/PASS00248).
PHB ELISA.
ELISA against human PHB was constructed using the sandwich capture method. The capture antibody was a rabbit polyclonal antibody against the C-terminal domain, and the detection antibody was a mouse monoclonal antibody paired with the capture antibody and labeled with biotin. The blocking buffer was composed of 1% bovine serum albumin in PBS. Recombinant human prohibitin was produced in E. coli as a single, nonglycosylated His-tagged protein. Streptavidin-horseradish peroxidase with tetramethylbenzidine as a substrate was used for detection, as available from Novatein Biosciences (BG-HUM11702).
Immunohistochemistry and immunofluorescence.
Immunohistochemistry was performed using established methods as described previously (59). Images were analyzed using the Halo imaging analysis software (Indica Labs). A total of 24,862,509 cells were counted and scored from 0+ to 3+ based on PHB expression. Confocal immunofluorescence microscopy was performed using cells plated in 4-well glass Millicell EZ slides fixed in 4% paraformaldehyde and washed with PBS prior to imaging. PHB and CoxIV antibodies used are listed in the Western blotting section (information to follow) and were stained at 2.5 and 1.2 μg/mL, respectively. Images were acquired using the Leica TCS SP5 II (Leica Microsystems Inc.).
Cell culture.
HEK293T and BJ cells were obtained from the ATCC. WT-CLS1 cells were obtained from the Leibniz Institute Deutsche Sammlung von Mikroorganismen und Zellkulturen (Braunschweig, Germany). CCG-9911 cells were a gift from Benjamin Tycko at Columbia University (New York, New York, USA). WiT49 cells were a gift from Herman Yeger at University of Toronto (Toronto, Ontario, Canada). The identity of all cell lines was verified by STR analysis, and lack of mycoplasma contamination was confirmed by Genetica DNA Laboratories. BJ cells were cultured in DMEM, WT-CLS1 and CCG-9911 cells were cultured in IMDM, and WiT49 cells were cultured in DMEM F-12. All media included 10% FBS, 100 U/mL penicillin, 100 μg/mL streptomycin, and 1% glutamine, as maintained in a humidified atmosphere at 37oC and 5% CO2.
Plasmids.
For RNA interference, pLKO.1 vectors targeting PHB were obtained from the RNAi Consortium: TRCN0000029204 (referred to as shPHB4), TRCN0000029206 (referred to as shPHB6), and TRCN0000029208 (referred to as shPHB8). PHB was overexpressed using pLX304 vector, as obtained from the DNASU repository. All plasmids were verified by restriction endonuclease mapping and Sanger sequencing and are available from Addgene (https://www.addgene.org/Alex_Kentsis).
Lentivirus transduction.
Lentivirus particles were produced using HEK293T cells with the psPAX2 and pMD2.G packaging plasmids, as described previously (16). Cell transduction was performed using the multiplicity of infection of 10 in the presence of 8 μg/mL hexadimethrine bromide. Transduced cells were selected using puromycin (3 μg/mL) for the pLKO.1 vectors or with blasticidin (3 μg/mL) for the pLX304 vectors. Transduced cells were cloned using limiting dilution.
Western blotting.
Western blotting was carried out as described previously (14). The following antibodies were used: The PHB antibody used was a rabbit polyclonal antibody (1:1000, H-80) from Santa Cruz Biotechnology. The OMA1 antibody used was a mouse monoclonal antibody (1:1000, H-11) from Santa Cruz Biotechnology. The YME1L antibody used was a rabbit polyclonal antibody (1:1000, AP4882a) from Abgent. The OPA1 antibody used was a mouse monoclonal antibody (1:1000, 18/Opa-1) from BD Biosciences. The V5 antibody used was a mouse monoclonal antibody (1:1000, R960-25) obtained from Thermo Scientific. For loading controls, β-actin mouse monoclonal antibody (1:5000, 8H10D10), β-actin rabbit monoclonal antibody (1:5000, 4970), and CoxIV rabbit polyclonal antibody (1:1000, 4844) (all from Cell Signaling Technology) were used. The secondary antibodies used in this study include IRDye 680RD goat anti-rabbit and IRDye 800CW goat anti-mouse secondary antibodies, both at 1:15,000 dilution and obtained from Li-Cor. Imaging and quantification were performed using the Li-Cor Odyssey Imaging System.
Electron microscopy.
Fresh 1-cm3 pieces of tissue were fixed in 2.5% glutaraldehyde, 4% paraformaldehyde, 0.02% picric acid in 0.1-M sodium cacodylate buffer overnight at 4oC, washed, and then post-fixed with osmium tetroxide reduced with potassium ferricyanide for 1 hour at room temperature, washed, and dehydrated in graded ethanol. Blocks generated using Embed 812 (Electron Microscopy Sciences) resin were cut at 65 nm and mounted on copper grids, stained with uranyl acetate and lead citrate, and imaged using the JEM-1400 electron microscope (JEOL) as described previously (60).
Statistics.
Exploratory simple logistic regression models were fit to determine the optimal cutoff point for urine PHB and normalized PHB, which was the ratio of PHB and urine concentrations of Cr, at which the odds of having relapse was maximized. We also used the Youden index, aimed at maximizing the sensitivity and specificity simultaneously, to find an optimal cutoff point. The Youden index is the maximum of (sensitivity + specificity – 1) over all threshold values of PHB and normalized PHB and allows evaluation of a diagnostic test with respect to its true positive and true negative rates (61).
Based on the results of these 2 criteria, 2 series of logistic regression models were used to evaluate whether PHB and normalized PHB (dichotomized by the optimal cutoff point) could predict Wilms’ tumor relapse. The first series was performed for the entire sample, considering either of the 2 PHB variables only. The second series was performed for patients with Wilms’ tumor. In addition to the PHB variables, 3 possible confounders were also included in the multivariate logistic regression models: stage (I, II, or III), histology (blastema, favorable-histology Wilms’, mixed-cell Wilms’, or epithelial), and therapy (none vs. any chemotherapy). Backward selection was used to determine the most parsimonious model.
Fisher’s exact tests were also applied to assess if the PHB or normalized PHB values categorized by the optimal cutoff point differed significantly among the 3 groups and the different relapse sites.
All statistical analyses and figures were performed using SAS version 9.2, origin version 9.1, and Graph Pad version 7.01. A P value less than 0.05 was considered significant.
Study approval.
Urine and tumor specimens were obtained from the Children’s Oncology Group (Monrovia, California, USA) and Memorial Sloan Kettering Cancer Center, as part of institutional review board–approved research studies, with informed subject consent.
Author contributions
MO contributed to the study design, data collection, experiments, and interpretation of results. AK, SA, MB, AH, IM, SG, LG, GB, and JR performed experiments. TH, YH, AN, YYC, PC, and SG assisted with data analysis. MLQ, TH, JD, EP, EM, and HS contributed to the interpretation of results. EM, HS, and AK contributed to the study design, data analysis, and interpretation. AK and MO wrote the manuscript, with contributions from other authors.
Supplementary Material
Acknowledgments
We thank the Children’s Oncology Group Renal Tumor Committee for their support of this project. This study was supported by the Harvard Catalyst, Rally Foundation, Pablove Foundation, Hyundai Hope on Wheels, the Pediatric Cancer Research Foundation, Met Life Foundation, Family and Friends of Caroline Bhatt, the Kristen Ann Carr Fund, Cannonball Kids’ cancer, and the NCI K12 CA184746, R01 CA214812, U10 CA180899, and P30 CA008748. AK acknowledges the support of the St. Baldrick’s Foundation, Damon Runyon–Richard Lumsden Foundation, Josie Robertson Investigator Program, Burroughs Wellcome Fund, Cycle for Survival, and the Rita Allen Foundation. We thank Lee Cohen-Gould and Juan Pablo Jimenez for technical assistance, and Joseph Olechnowicz for comments on the manuscript.
Version 1. 08/08/2019
Electronic publication
Funding Statement
In addition, this study was supported by the Harvard Catalyst, Rally Foundation, Pablove Foundation, Hyundai Hope on Wheels, the Pediatric Cancer Research Foundation, Family and Friends of Caroline Bhatt, the Kristen Ann Carr Fund, and Met Life Foundation.
Footnotes
Conflict of interest: AK is a consultant for Novartis.
Copyright: © 2019, American Society for Clinical Investigation.
Reference information: JCI Insight. 2019;4(15):e127098. https://doi.org/10.1172/jci.insight.127098.
Contributor Information
Saima Ahmed, Email: Saima.Ahmed@childrens.harvard.edu.
Lyvia Gaewsky, Email: gaewsky.lyvia@gmail.com.
Gary Bradwin, Email: Gary.Bradwin@childrens.harvard.edu.
Jeremy Ryan, Email: Jeremy_Ryan@DFCI.HARVARD.EDU.
Anthony Letai, Email: anthony_letai@dfci.harvard.edu.
Ying He, Email: donotwaithe@gmail.com.
Arlene Naranjo, Email: anaranjo@cog.ufl.edu.
Yueh-Yun Chi, Email: yychi@ufl.edu.
Michael LaQuaglia, Email: laquaglm@mskcc.org.
Paolo Cifani, Email: cifanip@mskcc.org.
Samantha Gadd, Email: SGadd@luriechildrens.org.
Elizabeth Mullen, Email: Elizabeth_Mullen@dfci.harvard.edu.
Hanno Steen, Email: hanno.steen@childrens.harvard.edu.
Alex Kentsis, Email: kentsisresearchgroup@gmail.com.
References
- 1.Dome JS, et al. Advances in Wilms tumor treatment and biology: progress through international collaboration. J Clin Oncol. 2015;33(27):2999–3007. doi: 10.1200/JCO.2015.62.1888. [DOI] [PMC free article] [PubMed] [Google Scholar]
- 2.Termuhlen AM, et al. Twenty-five-year follow-up of childhood Wilms tumor: a report from the Childhood Cancer Survivor Study. Pediatr Blood Cancer. 2011;57(7):1210–1216. doi: 10.1002/pbc.23090. [DOI] [PMC free article] [PubMed] [Google Scholar]
- 3.Ooms AH, et al. Significance of TP53 mutation in Wilms tumors with diffuse anaplasia: a report from the children’s oncology group. Clin Cancer Res. 2016;22(22):5582–5591. doi: 10.1158/1078-0432.CCR-16-0985. [DOI] [PMC free article] [PubMed] [Google Scholar]
- 4.Grundy PE, et al. Loss of heterozygosity for chromosomes 1p and 16q is an adverse prognostic factor in favorable-histology Wilms tumor: a report from the National Wilms Tumor Study Group. J Clin Oncol. 2005;23(29):7312–7321. doi: 10.1200/JCO.2005.01.2799. [DOI] [PubMed] [Google Scholar]
- 5.Grundy PE, Telzerow PE, Breslow N, Moksness J, Huff V, Paterson MC. Loss of heterozygosity for chromosomes 16q and 1p in Wilms’ tumors predicts an adverse outcome. Cancer Res. 1994;54(9):2331–2333. [PubMed] [Google Scholar]
- 6.Stern M, Longaker MT, Adzick NS, Harrison MR, Stern R. Hyaluronidase levels in urine from Wilms’ tumor patients. J Natl Cancer Inst. 1991;83(21):1569–1574. doi: 10.1093/jnci/83.21.1569. [DOI] [PubMed] [Google Scholar]
- 7.Lin RY, Argenta PA, Sullivan KM, Adzick NS. Diagnostic and prognostic role of basic fibroblast growth factor in Wilms’ tumor patients. Clin Cancer Res. 1995;1(3):327–331. [PubMed] [Google Scholar]
- 8.Lin RY, Argenta PA, Sullivan KM, Stern R, Adzick NS. Urinary hyaluronic acid is a Wilms’ tumor marker. J Pediatr Surg. 1995;30(2):304–308. doi: 10.1016/0022-3468(95)90578-2. [DOI] [PubMed] [Google Scholar]
- 9.Coppes MJ. Serum biological markers and paraneoplastic syndromes in Wilms tumor. Med Pediatr Oncol. 1993;21(3):213–221. doi: 10.1002/mpo.2950210311. [DOI] [PubMed] [Google Scholar]
- 10.Kentsis A, et al. Discovery and validation of urine markers of acute pediatric appendicitis using high-accuracy mass spectrometry. Ann Emerg Med. 2010;55(1):62–70.e4. doi: 10.1016/j.annemergmed.2009.04.020. [DOI] [PMC free article] [PubMed] [Google Scholar]
- 11.Kentsis A, et al. Detection and diagnostic value of urine leucine-rich α-2-glycoprotein in children with suspected acute appendicitis. Ann Emerg Med. 2012;60(1):78–83.e1. doi: 10.1016/j.annemergmed.2011.12.015. [DOI] [PMC free article] [PubMed] [Google Scholar]
- 12.Kentsis A, et al. Urine proteomics for discovery of improved diagnostic markers of Kawasaki disease. EMBO Mol Med. 2013;5(2):210–220. doi: 10.1002/emmm.201201494. [DOI] [PMC free article] [PubMed] [Google Scholar]
- 13.Kentsis A, Monigatti F, Dorff K, Campagne F, Bachur R, Steen H. Urine proteomics for profiling of human disease using high accuracy mass spectrometry. Proteomics Clin Appl. 2009;3(9):1052–1061. doi: 10.1002/prca.200900008. [DOI] [PMC free article] [PubMed] [Google Scholar]
- 14.Henssen AG, et al. Genomic DNA transposition induced by human PGBD5. Elife. 2015;4:e10565. doi: 10.7554/eLife.10565. [DOI] [PMC free article] [PubMed] [Google Scholar]
- 15.Henssen AG, Kentsis A. Emerging functions of DNA transposases and oncogenic mutators in childhood cancer development. JCI Insight. 2018;3(20):123172. doi: 10.1172/jci.insight.123172. [DOI] [PMC free article] [PubMed] [Google Scholar]
- 16.Henssen AG, et al. PGBD5 promotes site-specific oncogenic mutations in human tumors. Nat Genet. 2017;49(7):1005–1014. doi: 10.1038/ng.3866. [DOI] [PMC free article] [PubMed] [Google Scholar]
- 17.Henssen AG, et al. Therapeutic targeting of PGBD5-induced DNA repair dependency in pediatric solid tumors. Sci Transl Med. 2017;9(414):eaam9078. doi: 10.1126/scitranslmed.aam9078. [DOI] [PMC free article] [PubMed] [Google Scholar]
- 18.Guo W, et al. Prohibitin suppresses renal interstitial fibroblasts proliferation and phenotypic change induced by transforming growth factor-beta1. Mol Cell Biochem. 2007;295(1-2):167–177. doi: 10.1007/s11010-006-9286-4. [DOI] [PubMed] [Google Scholar]
- 19.Gadd S, et al. A Children’s Oncology Group and TARGET initiative exploring the genetic landscape of Wilms tumor. Nat Genet. 2017;49(10):1487–1494. doi: 10.1038/ng.3940. [DOI] [PMC free article] [PubMed] [Google Scholar]
- 20.Stroup EK, et al. WT-CLS1 is a rhabdoid tumor cell line and can be inhibited by miR-16. Cancer Rep. 2019;2(3):e1110. doi: 10.1002/cnr2.1110. [DOI] [Google Scholar]
- 21.Peng YT, Chen P, Ouyang RY, Song L. Multifaceted role of prohibitin in cell survival and apoptosis. Apoptosis. 2015;20(9):1135–1149. doi: 10.1007/s10495-015-1143-z. [DOI] [PMC free article] [PubMed] [Google Scholar]
- 22.Merkwirth C, et al. Prohibitins control cell proliferation and apoptosis by regulating OPA1-dependent cristae morphogenesis in mitochondria. Genes Dev. 2008;22(4):476–488. doi: 10.1101/gad.460708. [DOI] [PMC free article] [PubMed] [Google Scholar]
- 23.Merkwirth C, Langer T. Prohibitin function within mitochondria: essential roles for cell proliferation and cristae morphogenesis. Biochim Biophys Acta. 2009;1793(1):27–32. doi: 10.1016/j.bbamcr.2008.05.013. [DOI] [PubMed] [Google Scholar]
- 24.Osman C, Merkwirth C, Langer T. Prohibitins and the functional compartmentalization of mitochondrial membranes. J Cell Sci. 2009;122(Pt 21):3823–3830. doi: 10.1242/jcs.037655. [DOI] [PubMed] [Google Scholar]
- 25.Sato S, et al. Marine natural product aurilide activates the OPA1-mediated apoptosis by binding to prohibitin. Chem Biol. 2011;18(1):131–139. doi: 10.1016/j.chembiol.2010.10.017. [DOI] [PubMed] [Google Scholar]
- 26.Semenzato M, Cogliati S, Scorrano L. Prohibitin(g) cancer: aurilide and killing by Opa1-dependent cristae remodeling. Chem Biol. 2011;18(1):8–9. doi: 10.1016/j.chembiol.2011.01.001. [DOI] [PubMed] [Google Scholar]
- 27.Thuaud F, Ribeiro N, Nebigil CG, Désaubry L. Prohibitin ligands in cell death and survival: mode of action and therapeutic potential. Chem Biol. 2013;20(3):316–331. doi: 10.1016/j.chembiol.2013.02.006. [DOI] [PMC free article] [PubMed] [Google Scholar]
- 28.Scorrano L, et al. A distinct pathway remodels mitochondrial cristae and mobilizes cytochrome c during apoptosis. Dev Cell. 2002;2(1):55–67. doi: 10.1016/S1534-5807(01)00116-2. [DOI] [PubMed] [Google Scholar]
- 29.Anand R, et al. The i-AAA protease YME1L and OMA1 cleave OPA1 to balance mitochondrial fusion and fission. J Cell Biol. 2014;204(6):919–929. doi: 10.1083/jcb.201308006. [DOI] [PMC free article] [PubMed] [Google Scholar]
- 30.Frezza C, et al. OPA1 controls apoptotic cristae remodeling independently from mitochondrial fusion. Cell. 2006;126(1):177–189. doi: 10.1016/j.cell.2006.06.025. [DOI] [PubMed] [Google Scholar]
- 31.Mishra P, Carelli V, Manfredi G, Chan DC. Proteolytic cleavage of Opa1 stimulates mitochondrial inner membrane fusion and couples fusion to oxidative phosphorylation. Cell Metab. 2014;19(4):630–641. doi: 10.1016/j.cmet.2014.03.011. [DOI] [PMC free article] [PubMed] [Google Scholar]
- 32.Head B, Griparic L, Amiri M, Gandre-Babbe S, van der Bliek AM. Inducible proteolytic inactivation of OPA1 mediated by the OMA1 protease in mammalian cells. J Cell Biol. 2009;187(7):959–966. doi: 10.1083/jcb.200906083. [DOI] [PMC free article] [PubMed] [Google Scholar]
- 33.MacVicar T, Langer T. OPA1 processing in cell death and disease---the long and short of it. J Cell Sci. 2016;129(12):2297–2306. doi: 10.1242/jcs.159186. [DOI] [PubMed] [Google Scholar]
- 34.Song Z, Chen H, Fiket M, Alexander C, Chan DC. OPA1 processing controls mitochondrial fusion and is regulated by mRNA splicing, membrane potential, and Yme1L. J Cell Biol. 2007;178(5):749–755. doi: 10.1083/jcb.200704110. [DOI] [PMC free article] [PubMed] [Google Scholar]
- 35.Ryan J, Montero J, Rocco J, Letai A. iBH3: simple, fixable BH3 profiling to determine apoptotic priming in primary tissue by flow cytometry. Biol Chem. 2016;397(7):671–678. doi: 10.1515/hsz-2016-0107. [DOI] [PubMed] [Google Scholar]
- 36.Balsaver AM, Gibley CW, Tessmer CF. Ultrastructural studies in Wilms’s tumor. Cancer. 1968;22(2):417–427. doi: 10.1002/1097-0142(196808)22:2<417::AID-CNCR2820220220>3.0.CO;2-X. [DOI] [PubMed] [Google Scholar]
- 37.Pereira B, et al. The somatic mutation profiles of 2,433 breast cancers refines their genomic and transcriptomic landscapes. Nat Commun. 2016;7:11479. doi: 10.1038/ncomms11479. [DOI] [PMC free article] [PubMed] [Google Scholar]
- 38.Curtis C, et al. The genomic and transcriptomic architecture of 2,000 breast tumours reveals novel subgroups. Nature. 2012;486(7403):346–352. doi: 10.1038/nature10983. [DOI] [PMC free article] [PubMed] [Google Scholar]
- 39.Webster LR, et al. Prohibitin expression is associated with high grade breast cancer but is not a driver of amplification at 17q21.33. Pathology. 2013;45(7):629–636. doi: 10.1097/PAT.0000000000000004. [DOI] [PMC free article] [PubMed] [Google Scholar]
- 40.MacArthur IC, et al. Prohibitin promotes de-differentiation and is a potential therapeutic target in neuroblastoma. JCI Insight. 2019;5:127130. doi: 10.1172/jci.insight.127130. [DOI] [PMC free article] [PubMed] [Google Scholar]
- 41.Liu T, Tang H, Lang Y, Liu M, Li X. MicroRNA-27a functions as an oncogene in gastric adenocarcinoma by targeting prohibitin. Cancer Lett. 2009;273(2):233–242. doi: 10.1016/j.canlet.2008.08.003. [DOI] [PubMed] [Google Scholar]
- 42.Kang T, et al. MicroRNA-27 (miR-27) targets prohibitin and impairs adipocyte differentiation and mitochondrial function in human adipose-derived stem cells. J Biol Chem. 2013;288(48):34394–34402. doi: 10.1074/jbc.M113.514372. [DOI] [PMC free article] [PubMed] [Google Scholar]
- 43.Savulescu D, et al. Gonadotropin-releasing hormone-regulated prohibitin mediates apoptosis of the gonadotrope cells. Mol Endocrinol. 2013;27(11):1856–1870. doi: 10.1210/me.2013-1210. [DOI] [PMC free article] [PubMed] [Google Scholar]
- 44.Fletcher CE, Dart DA, Sita-Lumsden A, Cheng H, Rennie PS, Bevan CL. Androgen-regulated processing of the oncomir miR-27a, which targets Prohibitin in prostate cancer. Hum Mol Genet. 2012;21(14):3112–3127. doi: 10.1093/hmg/dds139. [DOI] [PubMed] [Google Scholar]
- 45.Watson JA, et al. miRNA profiles as a predictor of chemoresponsiveness in Wilms’ tumor blastema. PLoS ONE. 2013;8(1):e53417. doi: 10.1371/journal.pone.0053417. [DOI] [PMC free article] [PubMed] [Google Scholar]
- 46.Ho MY, Liang CM, Liang SM. MIG-7 and phosphorylated prohibitin coordinately regulate lung cancer invasion/metastasis. Oncotarget. 2015;6(1):381–393. doi: 10.18632/oncotarget.2804. [DOI] [PMC free article] [PubMed] [Google Scholar] [Retracted]
- 47.Ma LL, et al. Prohibitin, relocated to the front ends, can control the migration directionality of colorectal cancer cells. Oncotarget. 2017;8(44):76340–76356. doi: 10.18632/oncotarget.19394. [DOI] [PMC free article] [PubMed] [Google Scholar]
- 48.Cao Y, et al. Prohibitin overexpression predicts poor prognosis and promotes cell proliferation and invasion through ERK pathway activation in gallbladder cancer. J Exp Clin Cancer Res. 2016;35:68. doi: 10.1186/s13046-016-0346-7. [DOI] [PMC free article] [PubMed] [Google Scholar]
- 49.McBride H, Soubannier V. Mitochondrial function: OMA1 and OPA1, the grandmasters of mitochondrial health. Curr Biol. 2010;20(6):R274–R276. doi: 10.1016/j.cub.2010.02.011. [DOI] [PubMed] [Google Scholar]
- 50.Senft D, Ronai ZA. Regulators of mitochondrial dynamics in cancer. Curr Opin Cell Biol. 2016;39:43–52. doi: 10.1016/j.ceb.2016.02.001. [DOI] [PMC free article] [PubMed] [Google Scholar]
- 51.Chowdhury I, Thompson WE, Welch C, Thomas K, Matthews R. Prohibitin (PHB) inhibits apoptosis in rat granulosa cells (GCs) through the extracellular signal-regulated kinase 1/2 (ERK1/2) and the Bcl family of proteins. Apoptosis. 2013;18(12):1513–1525. doi: 10.1007/s10495-013-0901-z. [DOI] [PMC free article] [PubMed] [Google Scholar]
- 52.Luna-Vargas MP, Chipuk JE. The deadly landscape of pro-apoptotic BCL-2 proteins in the outer mitochondrial membrane. FEBS J. 2016;283(14):2676–2689. doi: 10.1111/febs.13624. [DOI] [PMC free article] [PubMed] [Google Scholar]
- 53.Renault TT, et al. Mitochondrial shape governs BAX-induced membrane permeabilization and apoptosis. Mol Cell. 2015;57(1):69–82. doi: 10.1016/j.molcel.2014.10.028. [DOI] [PMC free article] [PubMed] [Google Scholar]
- 54.Faccenda D, et al. Control of mitochondrial remodeling by the ATPase inhibitory factor 1 unveils a pro-survival relay via OPA1. Cell Rep. 2017;18(8):1869–1883. doi: 10.1016/j.celrep.2017.01.070. [DOI] [PubMed] [Google Scholar]
- 55.Iwasaki S, Floor SN, Ingolia NT. Rocaglates convert DEAD-box protein eIF4A into a sequence-selective translational repressor. Nature. 2016;534(7608):558–561. doi: 10.1038/nature17978. [DOI] [PMC free article] [PubMed] [Google Scholar]
- 56.Basmadjian C, Thuaud F, Ribeiro N, Désaubry L. Flavaglines: potent anticancer drugs that target prohibitins and the helicase eIF4A. Future Med Chem. 2013;5(18):2185–2197. doi: 10.4155/fmc.13.177. [DOI] [PubMed] [Google Scholar]
- 57.Polier G, et al. The natural anticancer compounds rocaglamides inhibit the Raf-MEK-ERK pathway by targeting prohibitin 1 and 2. Chem Biol. 2012;19(9):1093–1104. doi: 10.1016/j.chembiol.2012.07.012. [DOI] [PubMed] [Google Scholar]
- 58.Pan L, Woodard JL, Lucas DM, Fuchs JR, Kinghorn AD. Rocaglamide, silvestrol and structurally related bioactive compounds from Aglaia species. Nat Prod Rep. 2014;31(7):924–939. doi: 10.1039/C4NP00006D. [DOI] [PMC free article] [PubMed] [Google Scholar]
- 59.Kentsis A, et al. Autocrine activation of the MET receptor tyrosine kinase in acute myeloid leukemia. Nat Med. 2012;18(7):1118–1122. doi: 10.1038/nm.2819. [DOI] [PMC free article] [PubMed] [Google Scholar]
- 60.Cohen-Gould L. Handling cell culture monolayers for transmission electron microscopy. Microscopy Today. 2013;21(2):36–39. [Google Scholar]
- 61.Youden WJ. Index for rating diagnostic tests. Cancer. 1950;3(1):32–35. doi: 10.1002/1097-0142(1950)3:1<32::AID-CNCR2820030106>3.0.CO;2-3. [DOI] [PubMed] [Google Scholar]
Associated Data
This section collects any data citations, data availability statements, or supplementary materials included in this article.


