Abstract
Self-floating hollow glass microspheres (HGMS) modified with tumor-specific antibodies have been developed for capture of circulating tumor cells (CTCs), and have demonstrated effective cell isolation and good viability of isolated cancer cells. However, the capture efficiency decreases dramatically if the spiked cell concentration is low, possibly due to insufficient interactions between cancer cells and the HGMS’ surface. In order to apply the HGMS-based CTC isolation to clinically relevant samples, it is desirable to create nanostructures on the surface of HGMS to enhance cell-surface interactions. Nevertheless, current microfabrication methods cannot generate nanostructured-surface on the microspheres. The authors have developed a new HGMS with controlled nanotopographical surface structure (NSHGMS), and demonstrated isolation and recovery of rare cancer cells. NSHGMS is achieved by applying layer-by-layer (LbL) assembly of negatively charged SiO2 nanoparticles and positively charged poly-L-arginine molecules, then sheathing the surface with an enzymatically degradable LbL film made from biotinylated alginate and poly-L-arginine, and capping with anti-EpCAM antibodies and anti-fouling PEG molecules. Compared to smooth-surfaced HGMS, NSHGMS showed shorter isolation time (20 min.), enhanced capture efficiency (93.6 ± 4.9 %) and lower detection limit (30 cells/mL) for commonly used cancer cell lines (MCF7, SK-BR-3, PC-3, A549 and CCRF-CEM). This NSHGMS-based CTC isolation method does not require specialized lab equipment or an external power source, and thus, can be used for separation of targeted cells from blood or other body fluid in a resource-limited environment.
Keywords: Circulating Tumor Cells (CTCs), Layer-by-layer Assembly (LbL), biodegradable, Nanostructure, Hollow Glass Microspheres (HGMS)
Table of Contents
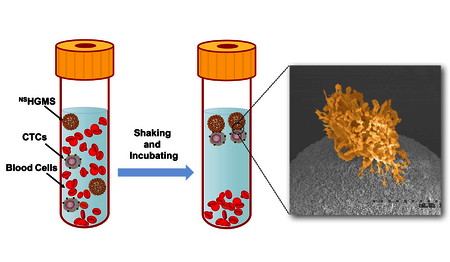
NSHGMS can isolate and recover circulating tumor cells in blood with shorter processing time, enhanced capture efficiency and lower detection limit.
1. Introduction
Circulating tumor cells (CTCs), derived from primary tumor sites, can travel through the bloodstream to distant organs, causing metastasis and cancer-related death.1 Therefore, isolation and analysis of CTCs in peripheral blood, (liquid biopsy), has attracted attention because it can be used for cancer prognosis and allow personalized treatment for cancer patients.2, 3 However, it is still a challenge to capture CTCs effectively with high purity due to their rare number (1–100 in 109 blood cells).1 By taking advantage of specific cancer cell surface markers, such as the epithelial cell adhesion molecule (EpCAM), CTCs can be isolated by maximizing the adhesion of CTCs with antibody-modified surface.4–13 Microfluidic devices are widely used for CTC isolation, owing to the precise fluidic manipulation coupled with high surface-to-volume ratio.14 Generally, blood samples continuously flow at a relatively low flow rate through microfluidic devices; there, CTCs are collected by antibodies modified on channel surface and blood cells are allowed to pass. As an alternative to microfluidic devices, immunomicro/nano-bead-based CTC isolation methods are relatively simple for both production and application. For example, CellSearch is the first and only FDA approved product for CTC application, where CTCs are attached with antibody-conjugated nanomagnetic particles, and separated by a magnetic field.15 However, this approach requires large quantity of magnetic nanoparticles in cell isolation, which could compromise the purity of enriched cells.16, 17 Further, viability of the isolated CTCs drops due to internalization of magnetic nanoparticles.18–20 Although larger microparticles could be used to enhance cell viability, it was found that beads with sizes larger than six microns are less effective in capturing cancer cells due to the beads’ lower surface area. 21
Recent studies indicate that nanotopography of the substrates underneath the antibody molecules demonstrates significant effect on CTC adhesion.2, 3, 22–26 Microchips with inner surfaces modified with nanostructures (such as nanopillars, nanodots, nanofibers, and nanofractals) showed enhanced capture performance.12, 27–33 Recently, self-floating hollow glass microspheres (HGMS) modified with tumor-specific antibodies have been developed in our lab for capture of CTCs in resource-limited settings; these have demonstrated effective cell isolation and good viability of isolated cancer cells when the concentration of spiked cells is larger than several thousand per milliliter.6 However, capture efficiency dramatically decreases if the spiked cell concentration in blood is below 1000 cells/mL, probably due to insufficient interactions between cancer cells and the HGMS surface. In order to apply the HGMS approach for CTC isolation to clinically relevant samples with concentrations from a few to several hundred cells/mL, it is desirable to create nanostructures on the HGMS surface and enhance cell-surface interactions.34 Nonetheless, current microfabrication methods for generating nanostructured-surface (i.e., chemical etching, chemical vapor deposition, electrochemical deposition, or electrospinning) are not feasible for surface coating of microparticles. 10, 12, 28, 30
Layer-by-layer (LbL) assembly is a versatile technique for surface modification and not limited by the shape of substrates (planar and particulate substrates) or materials for deposition (polymers, proteins, lipids, nucleic acids, and nanoparticles).35–37 Generally, electrostatic interaction is the most common driving force for LbL assembly, where positively and negatively charged macromolecules are adsorbed onto substrates alternatively, allowing the incorporation of electronically charged species.36 Metal and polymer nanoparticles have also been used as building blocks and successfully embedded in the LbL films for applications in drug delivery, optical devices, and batteries. 38–41
We have developed a new type of HGMS with controlled nanotopographical structure (NSHGMS) on its surface and demonstrated advanced isolation and recovery of rare cancer cells. NSHGMS was achieved by applying LbL assembly of negatively charged SiO2 nanoparticles (NPs) and positively charged poly-L-arginine molecules. The surface was then sheathed with an enzymatically degradable LbL film made from biotinylated alginate and poly-L-arginine, and then capped with anti-EpCAM antibodies and anti-fouling molecules. Compared to HGMS with smooth surface, NSHGMS showed shorter isolation time (20 min.), enhanced capture efficiency (93.6 ± 4.9 %) and lower detection limit (30 cells/mL) for many cancer cell lines (MCF7, SK-BR-3, PC3, A549, CCRF-CEM). The NSHGMS-based CTC isolation method does not require specialized lab equipment or an external power source, making it possible to rapidly perform separation of targeted cells from blood or other body fluids in a surgical room or other resource-limited environments.
2. Experimental
2.1. Materials
Alginate (ALG) (Pronova UPMVG, 60% guluronate, 40% mannuronate, Mw = 120,000) was purchased from Novamatrix, Norway. Poly-L-arginine (PARG, Mw = 15,000–70,000) was purchased from Sigma-Aldrich and used without further purification. Poly(ethylene glycol) 2-aminoethyl ether biotin (NH2-PEG-biotin, Mw = 20,000)(PEG20 000) was purchased from Nanocs Inc. Neutravidin (Mw = 60,000), NeutrAvidin-Texas Red conjugate (A-2665), 1-ethyl-3-(−3-dimethylaminopropyl) carbodiimide hydrochloride (EDC), and N-hydroxysulfosuccinimide (Sulfo-NHS) were purchased from ThermoFisher Scientific. Biotin conjugated EpCAM (CD326) monoclonal antibody was provided by Fisher Scientific. Biotin conjugated mouse antihuman CD71 was obtained from BD Bioscience. Alginate Lyase (A1603) was purchased from Sigma Aldrich. Blood from health donors was purchased from BioreclamationIVT (Westbury, NY) and used within 3 days of collection. Hollow glass microspheres (HGMS, density = 0.47 g/mL and diameter range of 20–27 μm) were obtained from Cospheric LLC. Silica nanoparticles (SiO2 NPs) (with nm size of 20, 40, 80, 120, and 200) were purchased from General Engineering & Research. All other reagents were purchased from Sigma Aldrich, USA, and used as received.
2.2. Biotin modification of ALG (BALG)
Alginate was modified with biotin hydrazide (Sigma B7639) using standard EDC reaction as reported in previous works.42, 43 Briefly, 2-ethanesulfonic acid (MES) buffer (pH = 6.1) was used to prepare 1.0 wt.% of ALG solution. Then 0.16 wt.% biotin hydrazide, 0.72 wt.% EDC, and 0.41 wt.% Sulfo-NHS were added to the ALG solution and reacted for 3 h. Then the solution was dialyzed against deionized H2O for 48 h and lyophilized to recover biotin modified alginate (BALG).
2.3. Preparation of NSHGMS
PARG and BALG were dissolved in deionized water (DI water) at a concentration of 2 mg/mL. SiO2 NPs were dispersed in DI water to prepare a 10 wt.% suspension. The LbL deposition process involves the repeated sequential incubation of HGMS into aqueous solutions of positively and negatively charged materials, with a washing step in between. PARG and SiO2 NP solutions were first used to modify HGMS surface. After two cycles of deposition, PARG and BALG solutions were used to form two bilayers of LbL film.
2.4. Quartz crystal microbalance with dissipation (QCM-D) monitoring
LbL film assembly was examined by a quartz-crystal microbalance with dissipation monitoring (QCM-D) (Q-Sense, E4 model, Sweden) and recorded at different overtones (n = 3th, 5th, 7th, 9th, 11th and 13th). SiO2 QCM-D (Q-sense, QSX 303) crystals were used as substrates and cleaned by a plasma cleaner for 5 min before experiment. To monitor LbL film adsorption process, PARG and SiO2 NP solutions were introduced into the QCM-D flow cell for 5 min with 5 min rinse steps in between. After two repeats of deposition, PARG and BALG solutions were pumped in the QCM-D flow cell to perform another two cycles of adsorption according to the previous protocol. The flow rate for all liquids was 0.15 mL/min.
The QCM-D results were analyzed with QTools (version: 3.1.30.624) to estimate adsorption mass based on the Voigt-based model as following:44
where, for a total of k viscoelastic layers under a bulk Newtonian fluid, ρ0 and h0 are the density and thickness of the quartz crystal, η3 is the viscosity of the bulk fluid, δ3 is the viscous penetration depth of the shear wave in the bulk fluid, ρ3 is the density of liquid, μ is the elastic shear modulus of an overall layer, and ω is the angular frequency of the oscillation. 0.0088 Pa·s was assumed as liquid viscosity. 1010 kg·m−3, 1050 kg·m−3 and 2650 kg·m−3 were used to estimate liquid, polymer film and SiO2 densities. Calculation used six overtones: 3th, 5th, 7th, 9th, 11th and 13th.
2.5. Cell culture and counting
A human breast cancer cell line, MCF7 (ATCC HTB-22), was cultured at 37 °C in DMEM medium containing 10% fetal bovine serum (FBS) and 1% penicillin/streptomycin. A human breast cancer cell line, SK-BR-3 (ATCC HTB-30), was cultured at 37 °C in RPMI-1640 medium containing 10% fetal bovine serum (FBS) and 1% penicillin/streptomycin. A human prostate cancer cell line, PC-3 (ATCC CRL-1453), and a human lung cancer cell line, A549 (ATCC CCL-185), were cultured at 37 °C in F-12K growth medium containing 10% FBS and 1% penicillin/streptomycin. A human primary prostate cell line, CPTX, was cultured similar to the method mentioned above according to reported work.45 A human T lymphoblast cell line, CCRF-CEM (ATCC CRM-CCL-119), was cultured in RPMI-1640 medium with 10% fetal bovine serum (FBS) and 1% penicillin/streptomycin. Adhesion cells were released from culture flasks through incubation in 0.25% trypsin-EDTA (Invitrogen, CA) at room temperature for 5 min. Prior to spiking into blood, all cells were labeled with a fluorescent cellular dye (CellTracker™ Deep Red or CellTracker™ Blue, ThermoFisher) following the manufacturers’ protocol. The cell suspension was subsequently constructed to the desired concentration in 5x diluted blood. Concentration of cancer cells in the suspension ranged from 30 cells/mL to 1,000 cells/mL.
2.6. Cell isolation and recovery
After modifying the surface with SiO2 NPs and PARG/BALG film, the coated HGMS were incubated with a Neutravidin solution (0.05 mg/mL) for 1 h. After washing by PBS, a mixture solution (20 µg/mL biotinylated anti-EpCAM and 20 µg/mL NH2-PEG-Biotin) was employed to coat EpCAM antibody and PEG molecules on the surface of Neutravidin functionalized NSHGMS.
For cell isolation, the NSHGMS and cancer cells spiked diluted blood were mixed on a rotator at 10 rpm for 60 min at room temperature. After incubation, the HGMS were carefully harvested and incubated with 100 μL ACK lysing buffer (ThermoFisher Scientific A1049201) in a polydimethylsiloxane (PDMS) micro-well. The uncaptured blood was transferred into a 96-well plate where red blood cells were lysed by adding 200 μL ACK lysing buffer to each well. The numbers of depleted and captured cancer cells were quantified using an optical microscope (Olympus BX53). To release captured cancer cells, the top layer of PARG/BALG film was degraded by adding alginate lyase (100 μL at 1 mg/mL) for 10 mins. Capture efficiency and captured cells purity are defined as follows:
2.7. Optical fluorescence microscopy
Fluorescent images were taken with an EVOS FL microscope (Life Technologies). DAPI, GFP, Texas Red and Deep Red images were taken at nm wavelengths of 345, 488, 530, and 630, respectively.
2.8. Cell viability testing
The viability of recovered cancer cells was evaluated with a standard Live/Dead fluorescent assay (Life Technologies L3224) using manufacture’s standard protocol and compared with control cells that had not been processed with NSHGMS.
2.9. Scanning electron microscopy (SEM)
Hollow glass microspheres were characterized by scanning electron microscopy (SEM, Hitachi S-4300, Japan) at 5 kV. Cells were fixed by 2% glutaraldehyde in PBS solution for 12 h. NSHGMS were washed by DI water. All samples were gradually rinsed with 20%, 40%, 60%, 80% and 100% ethanol, and dried at room temperature for 12 h. The dried samples were gold-coated by a sputter and scanned under SEM at 300x, 1000x, 2500x and 50000x magnifications.
2.10. Statistical methods
Data analysis was performed between groups using one-way ANOVA (n=3) by software Graphpad Prism 6.0. Calculated probabilities of p<0.0001, 0.0001<p<0.001, 0.001<p<0.01, 0.01<p<0.05 and p>0.05 were represented by ****, ***, **, * and N.S., respectively.
3. Results and discussions
3.1. Rational design of NSHGMS
HGMS with smooth surfaces have been developed for capture of CTCs and have demonstrated effective cell isolation and good viability of isolated cancer cells.6 However, CTC capture was not efficient when the spiked cell concentration in blood is below several thousand per milliliter of blood, possibly due to insufficient interactions between cancer cells and HGMS’ surface. In order to improve performance for CTC isolation for clinical patient samples (normally in the range of a few to several hundred cells per mL), a potential strategy is to enhance cell-surface interaction by creating nanotopographical structures on the HGMS’ surface.24 The LbL deposition process was used to construct both nanostructures and biodegradable coating on the surface of HGMS. To build nanostructures on HGMS, SiO2 NPs were chosen because they are chemically inert, physically robust and intrinsically negatively charged. To compensate the charge, poly-L-arginine (PARG) was selected as the positively charged building block; this was used in previous work and showed good biocompatibility.6, 42 Taking advantage of the flexibility of charged materials that are introduced during each deposition, alginate (ALG) was selected as another negatively charged component to form a layer of nanofilm coating on the SiO2 nanostructures. ALG can easily conjugate with biotin molecules for further modification of the surface with antibodies to capture cancer cells. Further, PARG/ALG film can be rapidly enzymatically degraded in a mild condition, which provides a noninvasive way to quickly release capture cells and preserve high cell viability.42
The detailed fabrication process of NSHGMS is shown in Figure 1. HGMS were first incubated with PARG and SiO2 NP solutions alternatively to form nanotopographical structures on the surface of HGMS. Then, these HGMS were coated with PARG and BALG to provide degradable coating and biotin molecules for further functionalization. Next, the NSHGMS were conjugated with anti-EpCAM antibody and PEG molecules via biotin-avidin interaction. Finally, the NSHGMS were ready for cancer cell capture.
Figure 1.
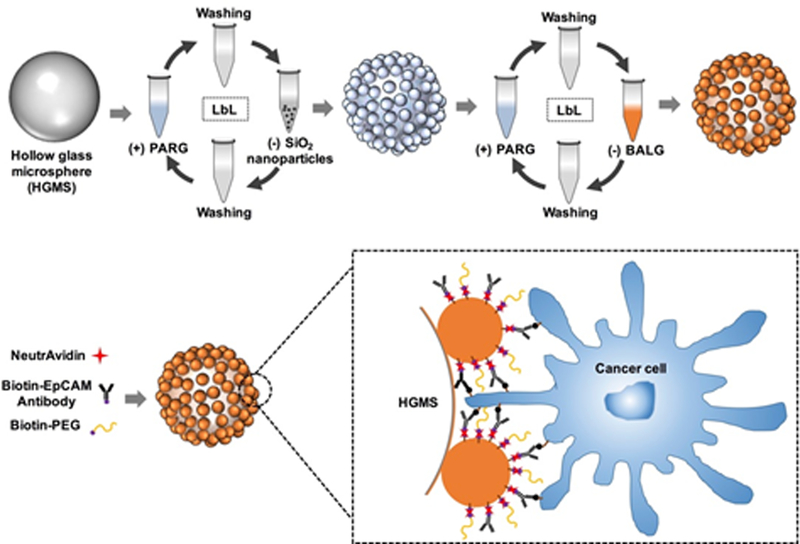
Schematic illustration of the fabrication process of hollow glass microspheres with nanotopographical structures (NSHGMS).
3.2. Surface morphology of NSHGMS
To illustrate the versatility of this method, five kinds of SiO2 NPs with different diameters (20 nm, 40 nm, 80 nm, 120 nm, and 200 nm) were used to conduct the LbL deposition process. The resulting NSHGMS were examined by SEM (Figure 2.) The HGMS modified only with PARG/BALG polymers showed smooth surfaces, while SiO2 NP-modified NSHGMS presented rough surfaces. The enlarged views (2nd and 4th rows) clearly display the nanotopographical structures of deposited SiO2 NPs. After two cycles of deposition, the surfaces of NSHGMS were uniformly covered by SiO2 NPs. The nanoscale bumps and valleys formed on the surface of NSHGMS could facilitate the contact between the surface components of the targeted cancer cells and HGMS surfaces and provide more interaction sites for cell-HGMS bonding.
Figure 2.
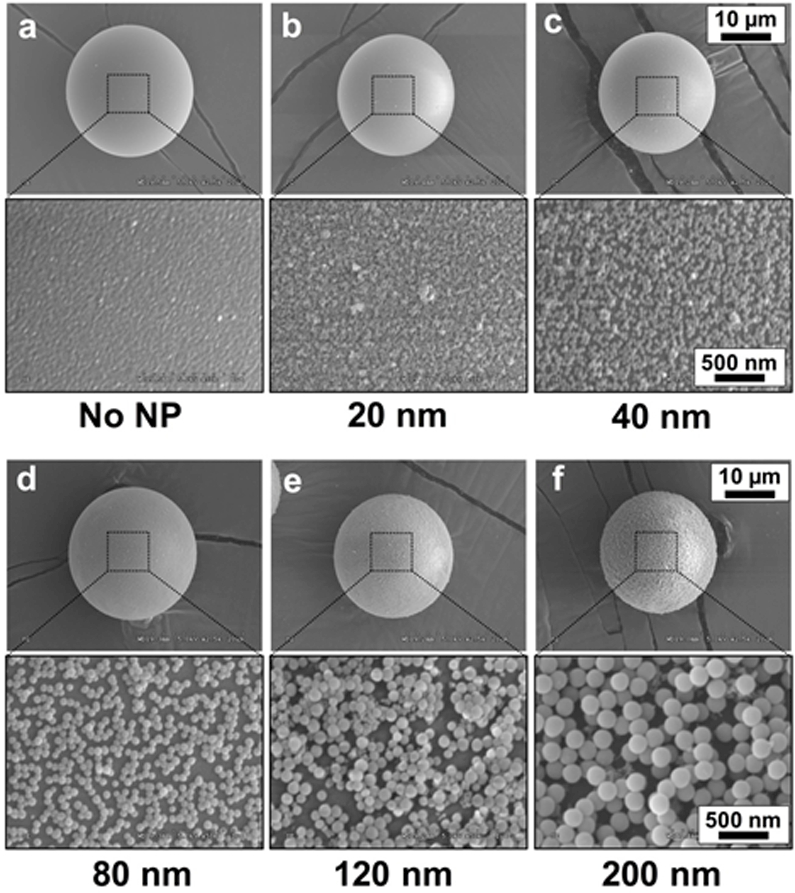
SEM images of NSHGMS. The surface of HGMS was covered by SiO2 NPs with various sizes using LbL assembly process. (a) no SiO2, (b) 20 nm, (c) 40 nm, (d) 80 nm, (e) 120 nm and (f) 200 nm. The scale bar is 10 µm in the first and third rows, and 500 nm in the second and forth rows.
3.3. LbL deposition process of NSHGMS
To best understand the LbL assembly process for creating nanotopographical structure on the surface of HGMS, QCM-D was used to monitor each of the material adsorption steps. In this experiment, a sensor placed in a QCM-D flow cell was put in contact with solutions in the same order as the LbL process for NSHGMS (Figure 3). In QCM-D, the change of resonance frequency (F) represents the mass of adsorbed or bound materials, while dissipation (D) indicates the viscoelastic stiffness of the attached molecules. The decreasing of F values suggests adsorption of molecules on the surface, while the increasing of D values implies attachment of softer molecules. Figure 3a shows a stepwise decrease of F value for the QCM sensor in the process of LbL assembly, indicating successful adsorption of designated material on the surface of the sensor. Figure 3b shows the mass of the adsorbed materials during each step, which was calculated by the change of F values from Figure 3a. During the two adsorption steps of SiO2 NPs (200 nm), mass additions of 13.3 µg/cm2 and 3.8 µg/cm2 were observed, which corresponded to 1.02*109 cm−2 and 3.43*108 cm−2 surface coverage of SiO2 NPs, respectively. A total density of SiO2 NPs covered on the surface of the QCM sensor was approximately 1.363*109 particles per cm2. Considering the desorption of SiO2 NPs off the surface of QCM sensor due to the constant shear stress applied on, this value maybe lower than the real coverage of SiO2 NPs on the surface of NSHGMS. After deposition of SiO2 NPs, adsorption of PARG and BALG molecules was repeated two times to form a thin multifunctional LbL film on the outmost surface of NSHGMS, which allows conjugation of antibody for cancer cell capture and biodegradation for cancer cell release. From the resonance frequency change shown in Figure 3a, the mass of this [PARG/BALG]2 film was approximately 4.2 µg/cm2. Successful coating of the PARG/BALG film was also confirmed from alternation of surface zeta potential after adsorption oppositely-charged polymers (Figure 3c). The values on the zeta-potential during LbL deposition were in good agreement with those from previous reported work. 46 It is noted that the outmost surface was capped by BALG molecules.
Figure 3.
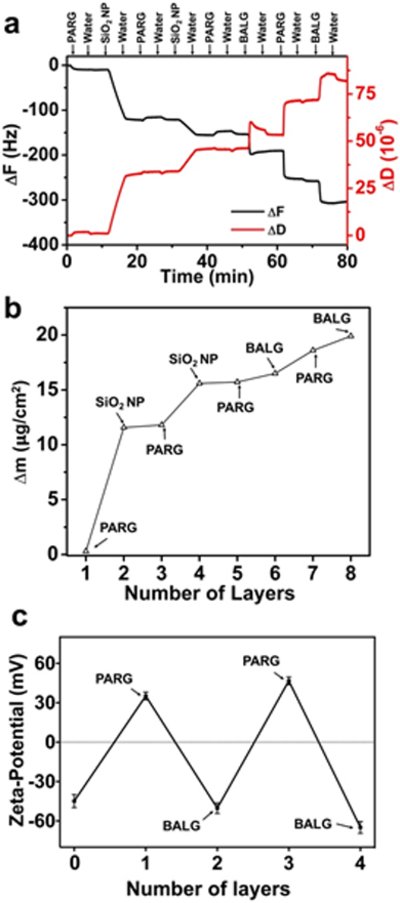
Monitoring the LbL deposition process of NSHGMS. (a) The nanostructured coating on NSHGMS was formed by stepwise adsorption of polymers and SiO2 NPs, as indicated by the change of resonant frequency of a QCM sensor. (b) Mass on the surface of NSHGMS during each deposition step, calculated from (a). (c) Zeta-potential of NSHGMS after each LbL deposition step. Layer 0 represents the surface covered by bare SiO2 NPs. Size of the SiO2 NPs was 200 nm.
3.4. Degradation of PARG/BALG film on the surface of NSHGMS
To ensure noninvasive release of captured cancer cells and to preserve the viability of released cells, it is essential that the outmost antibody-embedded film quickly degrades under mild conditions.47 Also required is that the SiO2 NPs beneath the PARG/BALG film should not peel off from the HGMS surface. Undesired peeling of SiO2 NPs may be taken up by the cancer cells and cause cell apoptosis.19, 20 Fluorescence microscopy and SEM were used to study degradation behavior of the PARG/BALG film on the surface of NSHGMS. As shown in Figures 4a and b, the degradation process was visualized by conjugating Texas Red labeled Neutravidin on the surface of NSHGMS. A strong fluorescence intensity was detected before degradation, indicating that the outermost layer of NSHGMS was covered with of the PARG/BALG film. After 10 min incubation with ALG lyase solution, an average 5 times lower fluorescent intensity was observed, suggesting a fast and effective deconstruction of the PARG/BALG film. In addition, SEM images (Figures 4c and d) showed similar surface nanostructures before and after degradation by ALG lyase, and no sign of SiO2 NPs loss was observed. These two experiments confirmed that the outmost layer of the PARG/BALG film can be rapidly degraded and its degradation does not change the nanotopographical structure on the surface of NSHGMS.
Figure 4.
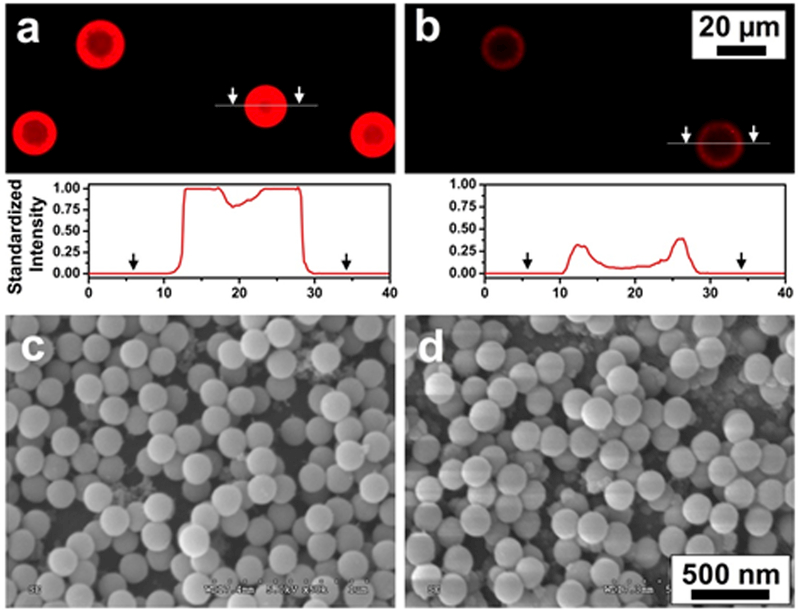
Fluorescence image and cross-sectional intensity profiles of LbL film on the outmost surface of NSHGMS before (a) and after (b) degradation by ALG lyase. Standard intensity was quantified using ImageJ and the fluorescence intensity of NSHGMS before degradation was set to 1.0. The biotin groups on NSHGMS surface were tagged with Neutravidin-Texas Red. SEM images of surface morphologies of NSHGMS before (c) and after (d) degradation by ALG lyase.
3.5. Capture and release of cancer cells using NSHGMS
To evaluate the cancer cell isolation performance of NSHGMS, an EpCAM positive cell line, MCF7 (pre-stained by CellTracker™ Deep Red), was spiked in 5x diluted blood as a model system. The cancer cell spiked blood samples were incubated and rotated with NSHGMS in a tube for 1 h to ensure sufficient contact between cells and NSHGMS. Afterwards, the blood samples stood for 5 min to allow NSHGMS to float to the tip of the collecting tube and the blood cells to settle to the lower half of the collecting tube (Figure 5a). NSHGMS (with captured cancer cells) were transferred into PDMS microwells, counted under fluorescent microscope, and a typical image was shown in Figure 5b. Cancer cells were all closely attached to 1–4 NSHGMS, and no free-floating cancer cells (i.e. not surrounding by NSHGMS) were observed. We compared the capture efficiency of NSHGMS covered with SiO2 NPs with different sizes ranging from 20–200nm. HGMS with smooth surface (no SiO2 NP modification) showed 71.2 ± 2.9 % capture efficiency, which is consistent with our previous reported work.6 By creating nanotopographical structure on the surface of HGMS, cell capture efficiency of 73.7–94.8% was achieved, which also showed an increase trend with the increasing of the size of SiO2 NPs that covered the surface (Figure 5c). NSHGMS covered with 20 nm SiO2 NPs showing the largest contact surface indicated marginal increment of capture efficiency from 71.2 ± 2.9% to 73.7 ± 1.6%. This result indicated that increasing surface area alone may not be critical in enhancing cell capture efficiency. When NSHGMS were covered with 200 nm SiO2 nanoparticles, the capture efficiency was dramatically improved to 94.8 ± 2.2%; this can be attributed to the nanotopographical structures complementary to the filopodium on the cancer cells’ surface as shown in Figure 5d. Filopodia of cancer cells are finger-like structures that let cells adhere and migrate on external substrates by aligning actin proteins to the points of contact.45 They are normally 100–300 nm in diameter and 1–3 µm in length. 48 Compared to NSHGMS modified with smaller SiO2 NPs, NSHGMS modified with 200 nm SiO2 NPs may form gaps that fit and match the filopodia structure, enhancing shaft and tip adhesion of filopodia (inset of Figure 5d), resulting in higher capture efficiency. Similar findings were previously reported. 47, 49–51 Chen et. al found higher capture efficiency was achieved by using a rough surface (150 nm) compared with less rough conditions. 49 Additionally, an improved capture performance was observed by modifying a herringbone-structured microchip with 166 nm polystyrene NPs at a 22% surface coverage.47
Figure 5.
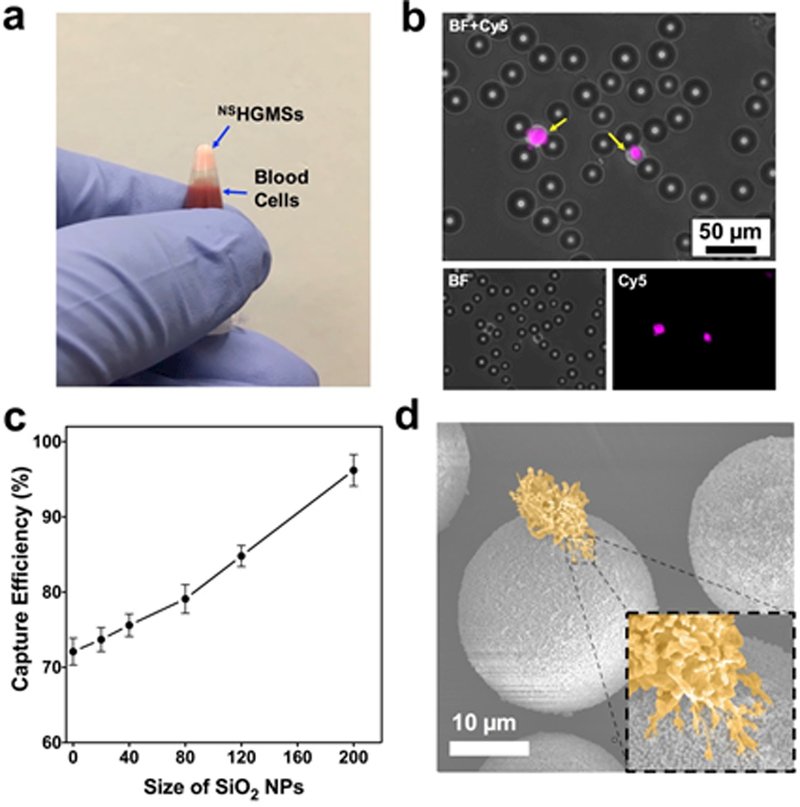
(a) A digital image of floating NSHGMS and separated blood cells in a testing tube. (b) Fluorescence images of captured MCF7 cells. MCF7 cells were stained by CellTracker™ Deep Red (presenting in pink). (c) Capture efficiency of NSHGMS covered with SiO2 NPs with different size. MCF7 cells in 5x diluted blood with 1,000 cells /mL was used in the experiment and the incubation time was 1h. (d) Pseudo colored SEM image of a captured MCF7 cell on the surface of a NSHGMS. Inset: shaft and tip adhesion of filopodia.
Processing time that allows sufficient cell capture is also essential to preserve viable CTCs for clinical research. However, although a longer time period can enhance the chance of contact between cells and HGMS, viability of the captured cells may be compromised because a long incubation process could trigger apoptosis of CTCs.52 To evaluate the minimum time required to isolate high purity cancer cells, we examined capture efficiency at different incubation times, from 10 min to 120 min. As shown in Figure 6a, maximum capture efficiency around 71.2 ± 2.9% was observed after 60 min for HGMS with a smooth surface; as a comparison, maximum capture efficiency of 92.4 ± 2.3% was observed in 20 min for NSHGMS modified with 200 nm SiO2 NPs. This suggests that surface nanostructures of NSHGMS could accelerate the adhesion process of cancer cells.
Figure 6.

(a) Capture efficiency of NSHGMS and regular HGMS at different incubation times. (b) Capture efficiency of NSHGMS and regular HGMS with respect to various spiked cell concentrations (cell/mL). (c) Capture efficiency of NSHGMS and regular HGMS for different cancer cell lines (1,000 cells/mL).
The number of CTCs in blood changes with the stages of cancer, with the detection range from a few to several hundred CTCs per milliliter of blood.14 Isolation of CTCs using smooth-surface HGMS has dramatically lower efficiency when cancer cell concentration is lower than 1,000 cells/mL.6 To evaluate the capability of NSHGMS on low-cell concentration, we studied isolation of MCF7 with cell numbers ranging from 30 to 1000 cells /mL, comparing them with in same experiments using regular HGSMs. As shown in Figure 6a, an average 93.6 ± 4.9% of the capture efficiency was obtained for NSHGMS in these ranges and decrease of cell concentration did not show significant reduction of capture efficiency. However, regular HGMS showed only 61.3 ± 4.5% of capture efficiency in the same cell concentration range. Specifically, capture efficiency decreased to 47.8 ± 7.6% for a cell concentration of 30 cells /mL. It was shown that invasive cancer cells often contain higher amount of filopodia, which express cell adhesion molecules for cell-cell adhesion, cell-extracellular matrix interaction, and probing of environment.48, 53, 54 Compared with HGMS with smooth surface, the nanostructured surface of NSHGMS could fit the finger-like structure of filopodia and enhance both shaft and tip adhesion of filopodia. Adhesion sites formed at the shaft and at the tip are mediated by integrins and are thought to be critical to promote filopodium stability and to regulate filopodia growth.55–58 Recent evidence also demonstrated that filopodia shaft adhesions can mature into focal adhesions upon lamellipodia advancement.59 Therefore, nanostructures created by SiO2 NPs could mediate faster adhesion and facilitate stronger binding between cancer cells and NSHGMS’ surface. Furthermore, during the incubation process, cancer cells may undergo dynamic adhesion/disassociation circles with HGMS, and strong bonding between NSHGMS and cancer cells could reduce the disassociation rate of the captured cells. As a result, NSHGMS have demonstrated higher capture efficiency, lower detection limit, and shorter processing time.
Next, we expanded the application of NSHGMS on isolation of other human cancer cells. We performed similar experiments on capturing four other cell lines, including A549 (a lung cancer cell line), PC-3 (a prostate cell line), SK-BR-3 (a breast cancer cell line), and CCRF-CEM (a leukemia cell line). Specifically, anti-EpCAM antibody was used to capture A549, PC-3 and SK-BR-3 cells, and anti-CD71 was used to capture CCRF-CEM cells.60 As shown in Figure 6c, NSHGMS achieved capture efficiencies of 92.7% to 98.5% for all 4 different cell lines. In contrast, only 72.2% to 77.8% capture efficiencies were observed for regular HGMS. These results demonstrate the constant and reliable cell recognition ability of NSHGMS. Furthermore, we have tested the NSHGMS method for the isolation of CPTX cells, and achieved similar results. Most of prostate cancer cell lines (PC3, LNCAP, etc.) were developed from metastatic lesions not from the primary prostate tumor, which may limit their application for studying the early development of metastasis. CPTX cell was generated from malignant epithelial cells from human fresh prostatectomy specimens and could provide a better CTC model to study progression of cancer metastasis for clinical applications.45,61–63
Finally, we investigated release efficiency and viability of released cells. After a 10 min incubation with 1 mg/mL ALG lyase PBS solution, 95.3% of captured MCF7 cells were released from the surface of NSHGMS (Figure 7a) with cell purity of 71.8 ± 3.5 %. These results were similar to the previously reported work using regular HGMS coated with PARG/BALG film, 6 which suggested that nanotopographical structures on the surface do not affect the degradation behavior of the PARG/BALG film. Furthermore, viability of the released cells was quantified with a standard Live/Dead cell viability assay. As shown in Figure 7b, the majority of released cancer cells showed vivid green fluorescence. Quantitatively, cell viability was 87.2%, similar to the control cells that did not go through the capture and release process (90.2%). Both released cells and control cells were cultured on a tissue culture plate in a standard condition for an extended period, and no differences in cell adhesion and proliferation were observed between those two groups.
Figure 7.
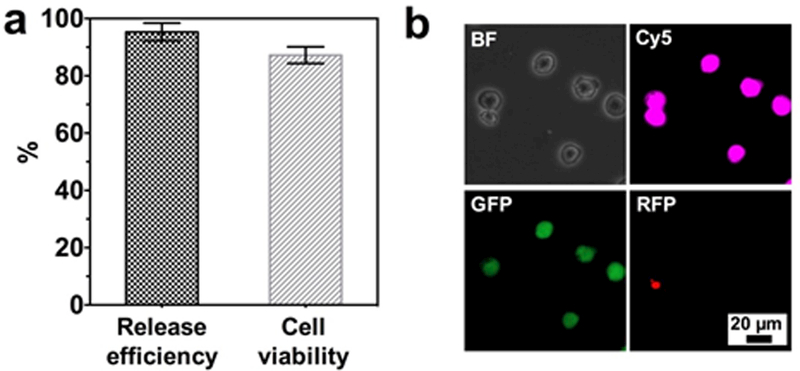
(a) Release efficiency and viability of released cancer cells from NSHGMS. (b) Live (green)/Dead (red) staining of captured and released MCF7 cells. MCF7 cells were pre-stained with CellTracker™ Deep Red before spiking into blood (1000 cells/mL). Live MCF7 cells show co-localization of pink and green fluorescent signals.
4. Conclusions
We applied an LbL assembly method to tailor surface nanostructure and function of HGMS for isolation of rare cancer cells. Compared to HGMS with smooth surface, HGMS with nanotopographical structures exhibited excellent capture efficiency (93.6 ± 4.9 %), rapid processing time (20 min), and low detection limit (30 cells/mL) for commonly used human cancer cell lines. This is attributed to the nanostructure features on the HGMS surfaces and may be complementary to the filopodia on the surface of cancer cells, which mediate faster adhesion and facilitate stronger binding with cancer cells. This highly effective platform for cell isolation does not need specific lab apparatus or any power supplies, and can be combined with other portable diagnosis tools for point-of-care applications in remote and resource-deficient areas. Further, this work expanded the application of the LbL assembly method and provides a simple and effective strategy for creating nanostructures on non-planar substrates.
Supplementary Material
Acknowledgements
W.L. acknowledges funding support from the Cancer Prevention & Research Institute of Texas (CPRIT) under Grant RP170817. X.L. acknowledges funding support from the CPRIT under Grant RP150656 and National Cancer Institute (NIH R15CA182769). D.Y. acknowledges funding from Henan Natural Science Foundation of China (No. 162102310272). D.P. acknowledges support from the CH Foundation.
Footnotes
Conflicts of Interest
There are no conflicts to declare.
References
- 1.Shen Z, Wu A and Chen X, Chemical Society Reviews, 2017, 46, 2038–2056. [DOI] [PMC free article] [PubMed] [Google Scholar]
- 2.Lin M, Chen JF, Lu YT, Zhang Y, Song J, Hou S, Ke Z and Tseng H-R, Accounts of Chemical Research, 2014, 47, 2941–2950. [DOI] [PMC free article] [PubMed] [Google Scholar]
- 3.Li YQ, Chandran BK, Lim CT and Chen X, Advanced Science, 2015, 2, 1500118. [DOI] [PMC free article] [PubMed] [Google Scholar]
- 4.Wen CY, Wu LL, Zhang ZL, Liu YL, Wei SZ, Hu J, Tang M, Sun EZ, Gong YP, Yu J and Pang DW, ACS Nano, 2014, 8, 941–949. [DOI] [PubMed] [Google Scholar]
- 5.Xu H, Aguilar ZP, Yang L, Kuang M, Duan H, Xiong Y, Wei H and Wang A, Biomaterials, 2011, 32, 9758–9765. [DOI] [PMC free article] [PubMed] [Google Scholar]
- 6.Dong Z, Ahrens CC, Yu D, Ding Z, Lim H and Li W, ACS Applied Materials & Interfaces, 2017, 9, 15265–15273. [DOI] [PubMed] [Google Scholar]
- 7.Stott SL, Hsu C-H, Tsukrov DI, Yu M, Miyamoto DT, Waltman BA, Rothenberg SM, Shah AM, Smas ME, Korir GK, Floyd FP, Gilman AJ, Lord JB, Winokur D, Springer S, Irimia D, Nagrath S, Sequist LV, Lee RJ, Isselbacher KJ, Maheswaran S, Haber DA and Toner M, Proceedings of the National Academy of Sciences, 2010, 107, 18392–18397. [DOI] [PMC free article] [PubMed] [Google Scholar]
- 8.Nagrath S, Sequist LV, Maheswaran S, Bell DW, Irimia D, Ulkus L, Smith MR, Kwak EL, Digumarthy S, Muzikansky A, Ryan P, Balis UJ, Tompkins RG, Haber DA and Toner M, Nature, 2007, 450, 1235. [DOI] [PMC free article] [PubMed] [Google Scholar]
- 9.Mohamadi RM, Besant JD, Mepham A, Green B, Mahmoudian L, Gibbs T, Ivanov I, Malvea A, Stojcic J, Allan AL, Lowes LE, Sargent EH, Nam RK and Kelley SO, Angewandte Chemie International Edition, 2015, 54, 139–143. [DOI] [PubMed] [Google Scholar]
- 10.Wang S, Wang H, Jiao J, Chen KJ, Owens GE, Kamei KI, Sun J, Sherman DJ, Behrenbruch CP, Wu H and Tseng H-R, Angewandte Chemie International Edition, 2009, 48, 8970–8973. [DOI] [PMC free article] [PubMed] [Google Scholar]
- 11.Wang S, Liu K, Liu J, Yu ZTF, Xu X, Zhao L, Lee T, Lee EK, Reiss J, Lee YK, Chung LWK, Huang J, Rettig M, Seligson D, Duraiswamy KN, Shen CKF and Tseng HR, Angewandte Chemie International Edition, 2011, 50, 3084–3088. [DOI] [PMC free article] [PubMed] [Google Scholar]
- 12.Wang S, Wan Y and Liu Y, Nanoscale, 2014, 6, 12482–12489. [DOI] [PMC free article] [PubMed] [Google Scholar]
- 13.Shi G, Cui W, Benchimol M, Liu YT, Mattrey RF, Mukthavaram R, Kesari S, Esener SC and Simberg D, PLOS ONE, 2013, 8, e58017. [DOI] [PMC free article] [PubMed] [Google Scholar]
- 14.Poudineh M, Sargent EH, Pantel K and Kelley SO, Nature Biomedical Engineering, 2018, 2, 72–84. [DOI] [PubMed] [Google Scholar]
- 15.Riethdorf S, Fritsche H, Müller V, Rau T, Schindlbeck C, Rack B, Janni W, Coith C, Beck K, Jänicke F, Jackson S, Gornet T, Cristofanilli M and Pantel K, Clinical Cancer Research, 2007, 13, 920–928. [DOI] [PubMed] [Google Scholar]
- 16.Kraeft S-K, Ladanyi A, Galiger K, Herlitz A, Sher AC, Bergsrud DE, Even G, Brunelle S, Harris L, Salgia R, Dahl T, Kesterson J and Chen LB, Clinical Cancer Research, 2004, 10, 3020–3028. [DOI] [PubMed] [Google Scholar]
- 17.Krivacic RT, Ladanyi A, Curry DN, Hsieh HB, Kuhn P, Bergsrud DE, Kepros JF, Barbera T, Ho MY, Chen LB, Lerner RA and Bruce RH, Proceedings of the National Academy of Sciences, 2004, 101, 10501–10504. [DOI] [PMC free article] [PubMed] [Google Scholar]
- 18.Farrell E, Wielopolski P, Pavljasevic P, van Tiel S, Jahr H, Verhaar J, Weinans H, Krestin G, O’Brien FJ, van Osch G and Bernsen M, Biochemical and Biophysical Research Communications, 2008, 369, 1076–1081. [DOI] [PubMed] [Google Scholar]
- 19.Gratton SEA, Ropp PA, Pohlhaus PD, Luft JC, Madden VJ, Napier ME and DeSimone JM, Proceedings of the National Academy of Sciences, 2008, 105, 11613–11618. [DOI] [PMC free article] [PubMed] [Google Scholar]
- 20.Mahmoudi M, Azadmanesh K, Shokrgozar MA, Journeay WS and Laurent S, Chemical Reviews, 2011, 111, 3407–3432. [DOI] [PubMed] [Google Scholar]
- 21.Kim MS, Lee JG, Sim TS, Kim YJ, Park JM, Baek S, Oh JM, Jeong H, Lee HJ, Lee JY, Kim SS, Lee SS and Park JC, 2011.
- 22.Liu X and Wang S, Chemical Society Reviews, 2014, 43, 2385–2401. [DOI] [PubMed] [Google Scholar]
- 23.Wang L, Asghar W, Demirci U and Wan Y, Nano Today, 2013, 8, 374–387. [DOI] [PMC free article] [PubMed] [Google Scholar]
- 24.Yoon HJ, Kozminsky M and Nagrath S, ACS Nano, 2014, 8, 1995–2017. [DOI] [PMC free article] [PubMed] [Google Scholar]
- 25.Kwak M, Han L, Chen JJ and Fan R, Small, 2015, 11, 5600–5610. [DOI] [PMC free article] [PubMed] [Google Scholar]
- 26.Shao Y and Fu J, Advanced Materials, 2014, 26, 1494–1533. [DOI] [PMC free article] [PubMed] [Google Scholar]
- 27.Yoon HJ, Kim TH, Zhang Z, Azizi E, Pham TM, Paoletti C, Lin J, Ramnath N, Wicha MS, Hayes DF, Simeone DM and Nagrath S, Nature Nanotechnology, 2013, 8, 735–741. [DOI] [PMC free article] [PubMed] [Google Scholar]
- 28.Ma L, Yang G, Wang N, Zhang P, Guo F, Meng J, Zhang F, Hu Z, Wang S and Zhao Y, Advanced Healthcare Materials, 2015, 4, 838–843. [DOI] [PubMed] [Google Scholar]
- 29.Zhang F, Jiang Y, Liu X, Meng J, Zhang P, Liu H, Yang G, Li G, Jiang L, Wan LJ, Hu J-S and Wang S, Nano Letters, 2016, 16, 766–772. [DOI] [PubMed] [Google Scholar]
- 30.Liu X, Zhang F, Wang Q, Gao J, Meng J, Wang S, Yang Z and Jiang L, Small, 2014, 10, 4677–4683. [DOI] [PubMed] [Google Scholar]
- 31.Zhang P, Chen L, Xu T, Liu H, Liu X, Meng J, Yang G, Jiang L and Wang S, Advanced Materials, 2013, 25, 3566–3570. [DOI] [PubMed] [Google Scholar]
- 32.Meng J, Liu H, Liu X, Yang G, Zhang P, Wang S and Jiang L, Small, 2014, 10, 3735–3741. [DOI] [PubMed] [Google Scholar]
- 33.Sekine J, Luo SC, Wang S, Zhu B, Tseng HR and Yu H. h., Advanced Materials, 2011, 23, 4788–4792. [DOI] [PubMed] [Google Scholar]
- 34.Maheswaran S, Sequist LV, Nagrath S, Ulkus L, Brannigan B, Collura CV, Inserra E, Diederichs S, Iafrate AJ, Bell DW, Digumarthy S, Muzikansky A, Irimia D, Settleman J, Tompkins RG, Lynch TJ, Toner M and Haber DA, New England Journal of Medicine, 2008, 359, 366–377. [DOI] [PMC free article] [PubMed] [Google Scholar]
- 35.Richardson JJ, Björnmalm M and Caruso F, Science, 2015, 348. [DOI] [PubMed] [Google Scholar]
- 36.Borges J and Mano JF, Chemical Reviews, 2014, 114, 8883–8942. [DOI] [PubMed] [Google Scholar]
- 37.Hammond PT, AIChE Journal, 2011, 57, 2928–2940. [Google Scholar]
- 38.Lee D, Rubner MF and Cohen RE, Nano Letters, 2006, 6, 2305–2312. [DOI] [PubMed] [Google Scholar]
- 39.Castleberry S, Wang M and Hammond PT, ACS Nano, 2013, 7, 5251–5261. [DOI] [PMC free article] [PubMed] [Google Scholar]
- 40.Zhang N, Dong Z, Ji D, Song H, Zeng X, Liu Z, Jiang S, Xu Y, Bernussi A, Li W and Gan Q, Applied Physics Letters, 2016, 108, 091105. [Google Scholar]
- 41.Hyder MN, Gallant BM, Shah NJ, Shao-Horn Y and Hammond PT, Nano Letters, 2013, 13, 4610–4619. [DOI] [PubMed] [Google Scholar]
- 42.Dong Z, Tang L, Ahrens CC, Ding Z, Cao V, Castleberry S, Yan J and Li W, Lab on a Chip, 2016, 16, 4601–4611. [DOI] [PubMed] [Google Scholar]
- 43.Li W, Reátegui E, Park MH, Castleberry S, Deng JZ, Hsu B, Mayner S, Jensen AE, Sequist LV, Maheswaran S, Haber DA, Toner M, Stott SL and Hammond PT, Biomaterials, 2015, 65, 93–102. [DOI] [PMC free article] [PubMed] [Google Scholar]
- 44.Voinova MV, Rodahl M, Jonson M and Kasemo B, Physica Scripta, 1999, 59, 391. [Google Scholar]
- 45.Bright RK, Vocke CD, Emmert-Buck MR, Duray PH, Solomon D, Fetsch P, Rhim JS, Linehan WM and Topalian SL, Cancer research, 1997,57, 995–1002. [PubMed] [Google Scholar]
- 46.Richardson JJ, Cui J, Björnmalm M, Braunger JA, Ejima H and Caruso F, Chemical Reviews, 2016, 116, 14828–14867. [DOI] [PubMed] [Google Scholar]
- 47.Reátegui E, Aceto N, Lim EJ, Sullivan JP, Jensen AE, Zeinali M, Martel JM, Aranyosi AJ, Li W, Castleberry S, Bardia A, Sequist LV, Haber DA, Maheswaran S, Hammond PT, Toner M and Stott SL, Advanced Materials, 2015, 27, 1593–1599. [DOI] [PMC free article] [PubMed] [Google Scholar]
- 48.Mattila PK and Lappalainen P, Nature Reviews Molecular Cell Biology, 2008, 9, 446. [DOI] [PubMed] [Google Scholar]
- 49.Chen W, Weng S, Zhang F, Allen S, Li X, Bao L, Lam RHW, Macoska JA, Merajver SD and Fu J, ACS Nano, 2013, 7, 566–575. [DOI] [PMC free article] [PubMed] [Google Scholar]
- 50.Chen W, Allen SG, Reka AK, Qian W, Han S, Zhao J, Bao L, Keshamouni VG, Merajver SD and Fu J, BMC Cancer, 2016, 16, 614. [DOI] [PMC free article] [PubMed] [Google Scholar]
- 51.Wan Y, Winter M, Delalat B, Hardingham JE, Grover PK, Wrin J, Voelcker NH, Price TJ and Thierry B, ACS Applied Materials & Interfaces, 2014, 6, 20828–20836. [DOI] [PubMed] [Google Scholar]
- 52.Wong CW, Lee A, Shientag L, Yu J, Dong Y, Kao G, Al-Mehdi AB, Bernhard EJ and Muschel RJ, Cancer Research, 2001, 61, 333–338. [PubMed] [Google Scholar]
- 53.Guillou H, Depraz-Depland A, Planus E, Vianay B, Chaussy J, Grichine A, Albigès-Rizo C and Block MR, Experimental Cell Research, 2008, 314, 478–488. [DOI] [PubMed] [Google Scholar]
- 54.Jacquemet G, Hamidi H and Ivaska J, Current Opinion in Cell Biology, 2015, 36, 23–31. [DOI] [PubMed] [Google Scholar]
- 55.Schäfer C, Borm B, Born S, Möhl C, Eibl EM and Hoffmann B, Experimental Cell Research, 2009, 315, 1212–1224. [DOI] [PubMed] [Google Scholar]
- 56.Gardel ML, Schneider IC, Aratyn-Schaus Yvonne and Waterman CM, Annual Review of Cell and Developmental Biology, 2010, 26, 315–333. [DOI] [PMC free article] [PubMed] [Google Scholar]
- 57.Lee D, Fong Karen P., King Michael R., Brass Lawrence F. and Hammer Daniel A., Biophysical Journal, 2012, 102, 472–482. [DOI] [PMC free article] [PubMed] [Google Scholar]
- 58.Disanza A, Bisi S, Winterhoff M, Milanesi F, Ushakov DS, Kast D, Marighetti P, Romet‐Lemonne G, Müller HM, Nickel W, Linkner J, Waterschoot D, Ampè C, Cortellino S, Palamidessi A, Dominguez R, Carlier MF, Faix J and Scita G, The EMBO Journal, 2013, 32, 2735–2750. [DOI] [PMC free article] [PubMed] [Google Scholar]
- 59.Wong S, Guo WH and Wang YL, Proceedings of the National Academy of Sciences, 2014, 111, 17176–17181. [DOI] [PMC free article] [PubMed] [Google Scholar]
- 60.Li W, Zhang Y, Reynolds CP and Pappas D, Analytical Chemistry, 2017, 89, 7340–7347. [DOI] [PubMed] [Google Scholar]
- 61.Bright RK, and Lewis JD, Culture of human tumor cells, 2003, 125–144.
- 62.Dong Z, Nemeth JA, Cher ML, Palmer KC, Bright RC, and Fridman R, International journal of cancer, 2001, 93, 507–515. [DOI] [PubMed] [Google Scholar]
- 63.Fox BP, , Tabone CJ, and Kandpal RP, Biochemical and biophysical research communications, 342, 1263–1272. [DOI] [PubMed] [Google Scholar]
Associated Data
This section collects any data citations, data availability statements, or supplementary materials included in this article.


