

SBP2 loss in macrophages drives adipose tissue inflammation and insulin resistance during obesity.
Abstract
Proinflammatory activation and accumulation of adipose tissue macrophages (ATMs) are associated with increased risk of insulin resistance in obesity. Here, we described the previously unidentified role of selenocysteine insertion sequence–binding protein 2 (SBP2) in maintaining insulin sensitivity in obesity. SBP2 was suppressed in ATMs of diet-induced obese mice and was correlated with adipose tissue inflammation. Loss of SBP2 initiated metabolic activation of ATMs, inducing intracellular reactive oxygen species content and inflammasome, which subsequently promoted IL-1β–associated local proliferation and infiltration of proinflammatory macrophages. ATM-specific knockdown of SBP2 in obese mice promoted insulin resistance by increasing fat tissue inflammation and expansion. Reexpression of SBP2 improved insulin sensitivity. Last, an herbal formula that specifically induced SBP2 expression in ATMs can experimentally improve insulin sensitivity. Clinical observation revealed that it improved hyperglycemia in patients with diabetes. This study identified SBP2 in ATMs as a potential target in rescuing insulin resistance in obesity.
INTRODUCTION
Obesity induces chronic inflammation that may cause the development of insulin resistance and its common comorbidity, type 2 diabetes (T2D) (1). Inflammation in the adipose tissues, especially in white adipose tissue, predominantly controls insulin resistance (2). Adipose tissue macrophages (ATMs) are considered to be the primary regulator of inflammation in the adipose tissue of obese individuals (3). Upon activation by environmental and metabolic factors, such as hypoxia, hyperlipidemia, and hyperglycemia, ATMs become proinflammatory and form crown-like structures (CLSs) around adipocytes (4). It has been reported that the formation of CLSs in white adipose tissue is negatively correlated with human insulin sensitivity (4).
Selenocysteine insertion sequence (SECIS)–binding protein 2 (SBP2) is a protein encoded by SECISBP2. Physiologically, it functions to interact with the SECIS RNA of selenoproteins to recruit translation and assembly factors to the mRNA-protein complexes (5). SBP2 is therefore considered as an essential factor for the translation of selenoproteins in mammalian cells. In some metabolic diseases, the expression and activity of SBP2 were aberrantly regulated by mutation. A homozygous missense mutation in SBP2 might cause abnormal thyroid hormone metabolism (6). A nonsense gene mutation that produces an early stop codon (R128X) may cause an early arrest in the synthesis of a full-length molecule (7). A compound heterozygous mutation (R120X/R770X) in the DNA sequence of SBP2 inhibited the binding of SBP2 to SECIS elements and blocked SBP2 function in translation of selenoproteins (8). This induced intracellular reactive oxidative species (ROS) production, and susceptibility to ultraviolet radiation–induced oxidative damage may mediate the observed photosensitivity. Particularly, a mutation in SBP2 may result in abnormal mononuclear cell cytokine secretion (9). An SBP2 mutation mouse model was detected with loss of SBP2 expression, which led to reduced selenoprotein stabilization (10). However, the role of SBP2 in the progression of insulin resistance during obesity remains yet to be understood.
In this study, we analyzed the expression of SBP2 in the human transcriptomic database and an experimental murine model of obesity. We found that SBP2 expression was notably lower in obese individuals with diabetes than in nondiabetic patients. SBP2 was majorly expressed in ATMs of white adipose tissue and inversely correlated with the infiltration of proinflammatory macrophages. Suppression of SBP2 repolarized M2-like ATMs to M1 phenotype, which was proinflammatory and associated with adipogenicity and insulin resistance. SBP2 loss in ATMs was induced by saturated fatty acid–induced metabolic activation of ATMs, resulting in its local proliferation and infiltration of proinflammatory macrophages in adipose tissue. Mechanistically, SBP2 was associated with the expression of several endogenous antioxidant proteins, which safeguarded ATMs from ROS and inflammasome activation. Loss of SBP2 increased intracellular ROS and activated inflammasome to process the maturation of interleukin-1β (IL-1β). SBP2 may also bind to caspase-1 to block its association with inflammasome. Using a β-glucan particle-based gene delivery system, we specifically modified the expression of SBP2 in ATMs. Knockdown of SBP2 in ATMs accelerated the progression of insulin resistance in diet-induced obese (DIO) mice, while reexpression of SBP2 improved insulin sensitivity. Last, the experimental and clinical efficacies of an SBP2-targeting pharmacological formula Tang-Ning Tong-Luo (TNTL) were identified. Our study depicted that SBP2 in ATMs could be a potential target for the remission of insulin resistance in obesity.
RESULTS
Reduced expression of SBP2 in ATMs promotes insulin resistance during obesity
SBP2 was initially identified as a SECIS-binding protein that favored selenocysteine-specific translation elongation in mammalian cells (5). Particularly, a mutation in SECISBP2 may result in abnormal mononuclear cell cytokine secretion (9). Physiological and pathological regulation of SBP2 expression during obesity has not yet been reported. To understand the role of SBP2 in the progression of insulin resistance during obesity, we first retrieved transcriptomic expression profile of human CD14+ mononuclear cells in adipose tissue from the Gene Expression Omnibus database (GSE54350) (11). Notably, the expression of SBP2 was lower in CD14+ mononuclear cells of adipose tissue from obese patients with T2D than those from nondiabetic controls (Fig. 1A). Transcriptomics data from murine obese models revealed a consistent loss of SBP2 expression in adipose tissue of mice with 4-week high-fat diet (HFD) treatment (data from GDS6247; fig. S1A) (12). In contrast, in another study reporting the transcriptomic analysis of CD14+ monocytes and macrophages in adipose tissue of nonobese and obese females (GSE100795), the change of SBP2 expression was insignificant (fig. S1, B and C) (13). This discrepancy could be owing to the variation in sample size, collection of different types of adipose tissue, or even gender difference of tested individuals Given that change of SBP2 expression might be specific to stage of diseases, types of adipose tissue, and specific cell populations in the adipose tissue microenvironment, a DIO model was then established to comprehensively measure the expression of SBP2 in adipose tissue during disease progression. In HFD-induced obese mice, the expression of SBP2 was gradually lost over the study duration (Fig. 1B). Expression of selenoproteins thioredoxin reductase 1 (TRXND1) and glutathione peroxidase 4 (GPX4), whose protein translation requests involvement of SBP2, was also reduced during disease progression (Fig. 1C). The presence of CD11b+F4/80+ cells was incrementally increased (Fig. 1D). Furthermore, the expression of SBP2 was particularly reduced in the intra-abdominal adipose tissue (epiWAT) compared to the brown adipose tissue (BAT) and subcutaneous fat pad (ingWAT) (Fig. 1E). This was further evidenced by the observation that the population of CD11b+F4/80+ intra-abdominal ATMs was inversely correlated to the expression of SBP2 in these samples (Fig. 1F). Furthermore, by isolating different types of cells from the epiWAT of mice fed with HFD using fluorescence-activated cell sorting (fig. S1D), we observed that the expression of SBP2 was notably reduced in F4/80+ cells of the mononuclear population (Fig. 1G). These observations suggest the correlation between ATM infiltration and its SBP2 expression in obesity.
Fig. 1. SBP2 expression in ATMs was reduced during obesity.
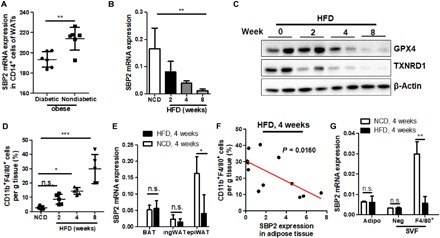
(A) Previous human subject data were collected from a Gene Expression Omnibus dataset (GSE54350). Expression of SBP2 was retrieved, and a significant difference was found between obese individuals with or without diabetes. Mice were fed an HFD for 2, 4, and 8 weeks, and (B) the expression of SBP2, (C) the expression of anti-oxidative selenoproteins GPX4 and TXNRD1, and (D) the infiltration of CD11b+F4/80+ cells into adipose tissue were measured. The ingWAT, interscapular BAT, and epiWAT were collected from mice fed with HFD for 4 weeks. (E) The expression of SBP2 was measured in different adipose tissues; epiWAT from mice fed with HFD for 8 weeks was collected and separated using the Percoll protocol. (F) Expression of SBP2 in adipose tissue of mice was correlated with the abundance of CD11b+F4/80+ proinflammatory macrophages. (G) Adipocytes, F4/80−, and F4/80+ mononuclear cells were collected to measure SBP2 expression. SBP2 showed significant lower expression in F4/80+ ATMs but not adipocytes or F4/80− Stroma vascular fraction (SVF) cells. *P < 0.05, **P < 0.01, ***P < 0.001. not significant (n.s.), not significant.
Loss of SBP2 initiated classically proinflammatory activation of ATMs
To reveal the biological significance of SBP2 suppression in ATMs during obesity, we first measured the expression of SBP2 in differentially activated ATMs. F4/80+CD11c+ M1-like and F4/80+CD206+ M2-like ATMs were sorted from the adipose tissue of DIO mice to measure the SBP2 expression. F4/80+CD11c+ cells sorted from adipose tissue expressed M1-like markers and showed significantly lower expression of SBP2 than F4/80+CD206+ ATMs that expressed M2-like markers (fig. S2A). Similar results were also observed in cultured bone marrow–derived macrophages (BMDMs), which were polarized into M1-like phenotype with interferon-γ or into M2-like phenotype by IL4/IL13 (fig. S2B). Imaging assays confirmed that the cytoplasmic expression of SBP2 in M2-like BMDMs was potently higher than that in the M1-like population, while in both cells, SBP2 did not localize in nuclei (fig. S2C). To further understand the role of SBP2 in controlling ATM polarization, we overexpressed either SBP2 in M1-like BMDMs (SBP2OE) or knockdown SBP2 in M2-like BMDMs (SBP2KD) (fig. S2D). Overexpression of SBP2 in M1-like BMDMs reskewed the cells toward M2-like phenotype, with an expression of M2-like markers. In contrast, the in vitro knockdown of SBP2 caused the repolarization of M2 macrophages to the M1-like phenotype (fig. S2, E and F). A previous study showed that M2-like ATMs were essential for the maintenance of normal size of adipocytes, restricting adipogenesis and control of systemic insulin sensitivity (14). As suppression of SBP2 during obesity was primarily found in ATMs instead in adipocytes, we then examined whether the ATM phenotype skewing induced by SBP2 knockdown regulates adipogenesis. 3T3-L1 pre-adipocytes treated with a culture supernatant from M2 macrophages with SBP2 knockdown exhibited reduced glucose uptake in the presence of insulin (fig. S2G); in the meantime, expression of lipogenesis-associated genes, such as stearoyl-CoA desaturase-1 (Scd1) and fatty acid synthase (FASN), was elevated (fig. S2H). Unresponsiveness of Akt signaling to insulin in 3T3-L1 cells upon treatment of cell supernatant from M2-like BMDMs with SBP2 knockdown further supported the claim that knockdown of SBP2 in macrophages may indirectly blunt the insulin sensitivity of adipose tissue during obesity (fig. S2I).
Loss of SBP2 induced inflammations in metabolically activated ATMs without regulating its lysosomal exocytosis
It was previously shown that metabolically activated ATMs (MMe) exhibited distinct phenotype from bacterially activated macrophages (M1/M2 paradigm). MMe could develop activation of lysosome biogenesis and might have lysosome-dependent lipid metabolism during obesity, which was independent of M1 polarization and inflammation activation (15). Another study from Kratz and colleagues (16) suggested that MMe expressed proinflammatory phenotypes, which was distinct from bacterially activated M1 macrophages and might not process the classical inflammation activation Toll-like receptor (TLR) pathway. A later study from the same laboratory suggested that both inflammatory cytokine production (a detrimental function) and lysosome exocytosis to dead adipocytes (a beneficial function) were induced in MMe (17). To identify whether metabolic stress could initiate loss of SBP2 expression in ATMs during obesity, we treated BMDMs with various metabolic factors such as 10 mM glucose, 10 μM insulin, and 500 μM palmitate to mimic the condition of hyperglycemia, hyperinsulinemia, and hyperlipidemia, respectively (16). Palmitate treatment but not glucose or insulin could significantly suppress the expression of SBP2 in BMDMs (Fig. 2, A and B). A recent study suggested that ATMs in lean mice acquired an antioxidant phenotype, while ATMs isolated from obese mice were prone to proinflammatory phenotype (18). Reduced expression of CD206 was not observed during metabolic activation of macrophages by palmitate (fig. S3A). Overexpression of SBP2 in MMe significantly suppressed the expression of CD11c and reduced ROS production without elevating CD206 (Fig. 2C). Expression of proinflammatory markers, such as IL1b, Mcp1, and Tnfa were significantly suppressed upon SBP2 overexpression (Fig. 2D), while the expression of lipid metabolism genes such as Plin2, Abca1, and Cd36 was not significantly changed (fig. S3B). Staining of Lysosomal-associated membrane protein 1 (LAMP1) and LAMP2 on the cell surface of MMe also suggested that lysosome exocytosis in MMe was not probably affected by SBP2 overexpression (fig. S3C). Both M1-like and MMe macrophages expressed a higher level of intracellular ROS (fig. S3D). These findings may suggest that the role of SBP2 in regulating MMe functions during obesity was restricted within its regulation on inflammatory pathways.
Fig. 2. Loss of SBP2 induced inflammations in metabolically activated ATMs and inflammasome-associated IL-1β production.
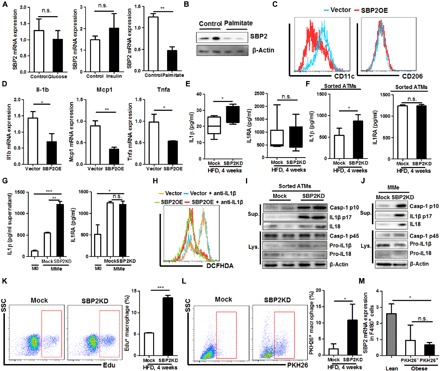
In vitro metabolic activation of BMDMs was induced by treatment of 10 mM glucose, 10 μM insulin, or 500 μM bovine serum albumin–conjugated palmitate for 24 hours. Only palmitate treatment could suppress (A) mRNAs and (B) protein expression of SBP2 in metabolically activated macrophages (MMe). Overexpression of SBP2 in MMe (C) suppressed CD11c presentation without significant change on CD206 (D) and shifted MMe from the expression of proinflammatory cytokine profile. (E) Mice with ATM-specific knockdown of SBP2 exhibited higher serum IL-1β without potent change in IL1Ra levels. (F) Sorted ATMs from DIO mice with SBP2 knockdown, as well as (G) in vitro culture of MMe with SBP2 knockdown, showed higher IL-1β secretion. (H) Overexpression of SBP2OE in MMe significantly reduced intracellular ROS level, which could be minimally reduced by the presence of an IL-1β–neutralizing antibody, and (I) sorted ATMs from DIO mice with SBP2 knockdown, as well as (J) in vitro culture of MMe with SBP2 knockdown, showed a higher level of inflammasome activation. ATM-specific knockdown of SBP2 in HFD-fed mice increased both (K) the local proliferation and (L) infiltration of macrophages, and (M) infiltrated macrophages had similar expression level of SBP2 with resident macrophages, both of which had significantly lower SBP2 expression in ATMs than lean mice. *P < 0.05, **P < 0.01, ***P < 0.001.
SBP2 knockdown activated IL-1β production in ATMs
To further understand the in vivo regulation of SBP2 on adipose tissue inflammation, we generated a macrophage-specific SBP2 knockdown model, as previously described (19), by using a particular delivery system that targets ATMs (fig. S4A). Flow cytometry analyses showed that the micrometer-sized glucan shells (GeRPs) encapsulating the small interfering RNA (siRNA) against SBP2-targeted ATMs silenced SBP2 expression (fig. S4B). The siRNA-encapsulated GeRP particles were enriched in adipose tissues of DIO mice (fig. S4C) while they were not observed in other major organs including liver, pancreas, smooth muscles, and kidney (fig. S4D), suggesting the specificity of gene knockdown by GeRP delivery system. There was no significant food intake change between the Mock and SBP2KD groups observed (fig. S4E). DIO mice with an injection of siRNA-encapsulated GeRPs every other day showed substantial suppression on the expression of SBP2 and its downstream selenoproteins in ATMs, which, in turn, resulted in M1-like polarization of ATMs in these mice (fig. S4, F to H). Accumulation of fat tissue was significantly accelerated (Fig. 3B) due to the increased composition of fat tissue (fig. S4I).
Fig. 3. Loss of SBP2 in obesity exacerbated insulin resistance and adipogenesis.

(A) Knockdown of SBP2 had minimal effects on the body weight of mice fed with either normal chow diet (NCD) or HFD but (B) increased adipose tissue weight gain in DIO mice. Knockdown of SBP2 in DIO mice (C) elevated FBG, reduced (D) glucose tolerance and (E) insulin sensitivity, (F) increased serum HbA1c levels, and (G) blunted adipose tissue Akt signal activity in response to insulin. SBP2 knockdown in ATMs of DIO mice (H) promoted ATM infiltration, which (I) extended sizes of adipocytes and (J) induced gene expression associated with lipogenesis. *P < 0.05, **P < 0.01, ***P < 0.001. SREBP1c, sterol regulatory element–binding protein 1; Dgat1, diglyceride acyltransferase 1. Scale bars, 50 µm.
It was recently reported that IL-1β production by macrophages caused a distinct proinflammatory signature in adipose tissue and the development of T2D in obese patients (11). Notably, we observed that ATM-specific knockdown of SBP2 expression in DIO mice significantly increased the plasma level of IL-1β without changing its endogenous antagonist IL1Ra (Fig. 2E). Sorted ATMs from DIO mice, as well as palmitate-treated BMDMs, released more IL-1β with SBP2 knockdown (Fig. 2, F and G). SBP2 overexpression suppressed the intracellular ROS level in both MMe and M1-like macrophages (Fig. 2H and fig. S5A). Antibody-specific blockade of IL-1β had minimal effect on the ROS status in MMe, but IL-1β blockade could further reduce ROS in M1-like macrophages (Fig. 2H and fig. S5A). No notable changes of SBP2 could be observed when an IL-1β–neutralizing antibody was applied to either MMe or M1-like macrophages (fig. S5B). Since MMe did not activate TLRs but mainly depended on an inflammasome pathway to produce IL-1β, and ROS may mediate inflammasome activation and IL-1β production (20), these data also suggested that IL-1β production in SBP2 knockdown ATMs could be dependent on inflammasome activation by ROS. This was evidenced by the observation of caspase-1 p10 release and IL-1β and IL18 production into the culture supernatant by sorted ATMs from DIO mice, as well as palmitate-treated BMDMs upon SBP2 knockdown (Fig. 2, I and J). In addition, knockdown of SBP2 in M2-like BMDMs increased the release of IL-1β in the presence of inflammasome activators adenosine triphosphate (ATP), monosodium urate (MSU), and nigericin (fig. S5C). M2-like BMDMs challenged with inflammasome activators released caspase-1 p10 fraction and mature IL-1β into the culture supernatant, and knockdown of SBP2 further accelerated this process, while the intracellular pro–caspase-1, inflammasome elements NLR family pyrin domain containing 3 (NLRP3) and apoptosis-associated speck-like protein containing C-terminal caspase recruitment domain (ASC) were not altered (fig. S5D). SBP2 overexpression was able to further suppress IL-1β production in MMe in the presence of ROS scavenger vitamin C (fig. S5E). Coimmunoprecipitation assays revealed that SBP2 was bound to pro–caspase-1 rather than other inflammasome components, such as ASC, NLRP3, or pro-IL-1β (fig. S5F). SBP2 may compete with NLRP3/ASC complex in the association with pro–caspase-1 (fig. S5G). This observation may suggest that SBP2 suppresses inflammasome activation in ATMs in both ROS-dependent and ROS-independent manners.
While at an early stage of obesity, the expansion of ATMs might be dependent on the local proliferation of macrophages in fat tissue (21–23), the later development of adipose tissue inflammation critically involved macrophage infiltration and recruitment (24, 25). We then examined whether the loss of SBP2 expression would accelerate the local proliferation and infiltration of macrophage in adipose tissue of obese mice. Using in vivo 5-ethynyl-2′-deoxyuridine (EdU) incorporation assay, we identified that SBP2 knockdown in ATMs could significantly accelerate the proliferation of macrophages (Fig. 2K). PKH26 dye was used to trace the migration and infiltration of macrophages into the adipose tissue (21–23). SBP2 knockdown also resulted in the infiltration of macrophages into the adipose tissue (Fig. 2L). Expression of SBP2 in PKH26-negative macrophages in obese mice had no significant difference with that in PKH26-positive cells, while both PKH26-negative and PKH26-positive macrophages had lower expression than that in F4/80+ macrophage in adipose tissue of lean mice (Fig. 2M), suggesting that the loss of SBP2 expression during obesity may not be primarily due to the difference between resident and infiltrated macrophages, as the resident macrophages in adipose tissue of obese mice also had reduced SBP2 expression.
SBP2 knockdown in ATMs accelerated insulin resistance during obesity
As SBP2 was found to regulate IL-1β production in ATMs, we further hypothesize that the loss of SBP2 in ATMs accelerates the development of hyperglycemia and insulin resistance. Specific knockdown of SBP2 in the ATMs of DIO mice exhibited no significant difference in body weight gain (Fig. 3A). However, accumulation of fat tissue was significantly accelerated (Fig. 3B) due to the increased composition of fat tissue (fig. S4I). ATM-specific knockdown of SBP2 induced a systemic response to glucose and insulin in DIO mice, as evidenced by the higher fasting blood glucose (FBG) level, glucose intolerance, and blunted response to insulin injection (Fig. 3, C to E). Consistently, mice with 4-week SBP2 knockdown in ATMs had elevated serum HbA1c levels (Fig. 3F). The systemic response of Akt signaling in the adipose tissue upon insulin injection was blunted by SBP2 knockdown in DIO mice (Fig. 3G), which was accompanied by infiltration of CD11b+F4/80+ macrophages into adipose tissue (Fig. 3H). Extended knockdown of SBP2 for another 4 weeks exacerbated the glucose intolerance and insulin resistance of DIO mice (fig. S6, A to F). However, the effect of SBP2 knockdown became subtle due to the reduced level of SBP2 at 8 weeks in DIO mice with the Mock knockdown. This was further evidenced by the observation that, in db/db mice, which had only trace SBP2 expression in ATMs, further SBP2 knockdown showed the minimal effect on insulin resistance of the mice (fig. S6, G to L). Male mice showed more significant response to SBP2 knockdown than female mice (fig. S7, A to G). This was consistent with the previous observation that male DIO mice had a higher level of macrophage infiltration into the intra-abdominal adipose tissue than female mice, while adipose tissue of female mice developed increased regulatory T cells, which probably counteract the progression of obesity (26). SBP2 knockdown in ATMs resulted in larger-sized adipocytes in the visceral fat tissue of obese mice (Fig. 3I), with the increased expression of lipogenesis markers Scd1, FASN, sterol regulatory element–binding protein 1, and diglyceride acyltransferase 1 (Fig. 3J).
Reconstitution of SBP2 expression in obese mice improved insulin sensitivity
To further identify the unique role of SBP2 in improving insulin sensitivity during the progression of obesity, we used the β-glucan particle system to deliver the transcription activator-like effectors-transcription factor (TALE-TF) construct to restore SBP2 expression (27). Obese db/db mice with spontaneous development of insulin resistance had low expression of SBP2 in ATMs (Fig. 4A). Delivery of customized TALE-TF construct for SBP2 reconstituted the expression of SBP2 in obese mice (Fig. 4A). Restoration of SBP2 initiated the repolarization of ATMs from M1-like phenotypes toward M2-like counterparts (Fig. 4B). Although the body weight of obese mice exhibited no significant reduction after SBP2 reconstitution (Fig. 4C), it was observed that the expansion of adipose tissue was suppressed (Fig. 4D). Mice with SBP2 reexpression showed significantly lower FBG (Fig. 4E), as well as higher sensitivity to glucose and insulin exposure (Fig. 4, F and G), which indicated that the reexpression of SBP2 in obese mice recovered insulin sensitivity and improved hyperglycemia. This was further proven by the reduced level of serum HbA1c and increased adipose tissue Akt activation to insulin treatment (Fig. 4, H and I). Furthermore, reexpression of SBP2 in obese mice significantly reduced the inflammation of adipose tissue, as evidenced by the suppression of CD11b+F4/80+ population (Fig. 4J). This could be partially attributed to the increased anti-inflammatory M2-like population but reduced proinflammatory M1-like counterparts within ATMs after SBP2 restoration (Fig. 4K), as well as reduced secretion of IL-1β from SBP2-restored ATMs (Fig. 4L). Reduced adipocyte diameters (Fig. 4M), as well as suppression of adipogenesis-associated genes (Fig. 4N), suggested that the restoration of SBP2-suppressed adipose tissue expansion depends on the remodeling of ATM phenotypes.
Fig. 4. Overexpression of SBP2 improved insulin sensitivity and suppressed adipogenesis in obese mice.
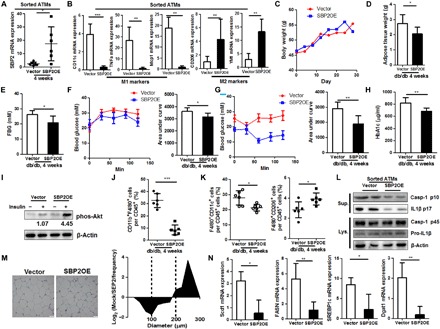
(A) SBP2 restoration induced (B) expression of M2-like genes instead of M1-like ones in sorted ATMs of db/db mice. SBP2 overexpression (C) did not change the body weight but (D) reduced adipose tissue weight, (E) improved FBG levels, (F) glucose intolerance and (G) insulin sensitivity, (H) serum HbA1c levels, (I) sensitized adipose insulin-responsive Akt pathway, and (J) reduced macrophage infiltration in adipose tissue. (K) Reexpression of SBP2 reduced M1-like macrophages but increased M2-like populations. (L) Sorted SBP2-overexpressing ATMs exhibited reduced inflammasome activation. SBP2 overexpression induced (M) smaller adipocyte diameters and (N) reduced expression of lipogenesis-associated genes. *P < 0.05, **P < 0.01, ***P < 0.001.
Pharmacological activation of SBP2 in ATMs using standardized preparation of an herbal formula improved hyperglycemia in obese animal
To further identify the potential of SBP2 as a drug target in reversing obesity-induced insulin resistance, we screened a candidate pool containing a series of compounds, herbal extracts, and traditional medicine formulas. An herbal formula named TNTL decoction, which is a holistic treatment used in the remote mountainous regions of southwestern China, was found to substantially elevated SBP2 expression in M1-like BMDMs (Fig. 5A). Composed of four herbs Lonicera hypoglauca, Agrimonia pilosa Ledeb., Plantago depressa Willd., and Trichosanthes Kirilowii Maxim., TNTL has been used by local herbalists as the effective treatment for patients with T2D. For our study, a standardized formulated hospital-prepared TNTL was used, and liquid chromatography–tandem mass spectrometry analysis of its chemical composition revealed that TNTL is composed mainly of gallic acid (fig. S8A). Its potential acute and chronic toxicities were measured, and the results of which showed that both the short- and long-term uses of TNTL were likely safe (fig. S8, B to G). In vivo study revealed that SBP2 was explicitly induced in ATMs of db/db mice treated with TNTL (Fig. 5, B and C). To identify the role of TNTL-mediated SBP2 in ATMs in insulin resistance, we used the GeRP delivery system to knock down the expression of SBP2 in the ATMs of TNTL-treated obese db/db mice. The improvement of FBG, as well as systemic sensitivity to glucose and insulin in TNTL-treated mice, could be abolished entirely upon ATM-specific knockdown of SBP2 (Fig. 5, D to K). These data suggest that the therapeutic effect of TNTL was dependent on SBP2 expression in ATMs.
Fig. 5. A holistic formula TNTL targeting SBP2 in ATMs improved insulin resistance in obese mice.
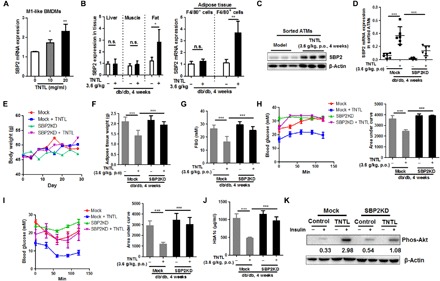
(A) SBP2 expression in M1-like BMDMs was notably higher after oral (per os, p.o.) treatment with TNTL. (B and C) TNTL treatment induced SBP2 expression in ATMs of db/db mice. (D) Macrophage-specific knockdown of SBP2 in TNTL-treated mice abrogated the effects of TNTL. (E) TNTL treatment did not affect body weight gain but (F) reduced adipose tissue weight. Knockdown of SBP2 in ATMs abrogated the therapeutic effect of TNTL on (G) FBG levels, (H) glucose intolerance, (I) insulin sensitivity, (J) serum HbA1c levels, and (K) sensitized adipose insulin-responsive Akt pathway. *P < 0.05, **P < 0.01, ***P < 0.001.
TNTL improved hyperglycemia in patients with diabetes
An open-label clinical study on the efficacy of TNTL was then conducted in hospitalized patients diagnosed with T2D (table S1). Significant improvements in the FBG levels (P = 0.0125; Fig. 6A) and 2-hour postprandial glucose levels (P = 0.0479; Fig. 6B), as well as significant decrease in blood glycated hemoglobin (HbA1c) levels (P = 0.0187; Fig. 6C), were observed after 3 months of treatment. The gender difference showed no impact on the efficacy of TNTL (Fig. 6D). In addition, no significant difference could be observed between the net changes of FBG, the improvement of TNTL to 2-hour postprandial blood glucose, and serum HbA1c levels in adult and elderly (Fig. 6E). These data suggest that TNTL, as a therapeutic agent targeting SBP2 in ATMs, exhibited clinical efficacy in reducing hyperglycemia in patients with diabetes.
Fig. 6. TNTL improved hyperglycemia and insulin resistance in patients with diabetes.
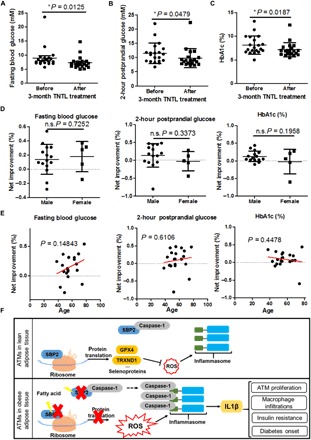
Patients with T2D receiving a 3-month treatment of TNTL showed significant improvement in (A) FBG, (B) 2-hour postprandial glucose, and (C) plasma HbA1c levels. Effect of TNTL was not associated with (D) gender difference and (E) age. (F) The regulatory scheme of SBP2 in ATM inflammation during obesity. *P < 0.05.
DISCUSSION
A recent study suggested that ATMs in lean mice acquired an antioxidant phenotype, while ATMs isolated from obese mice were more proinflammatory phenotype. In the adipose tissue of lean mice, macrophages were represented as an antioxidative phenotype, while in the adipose tissue of obese mice, macrophages presented as a proinflammatory phenotype (18). SBP2 is required for the synthesis of several antioxidant selenoproteins, which is involved in antioxidant defense, likely via preventing ROS formation (8). As ROS predominantly mediates macrophage differentiation and proinflammatory M1 macrophage polarization and activation (28), ROS scavenging by selenium-induced selenoproteins may have the beneficial effects of improving the inflammatory microenvironment of adipose tissue in obesity. Reduced expression of several selenoproteins was found to be associated with the risk of insulin resistance and obesity. Expression of selenoprotein was suppressed in adipose tissue of obese pig fed with HFD (29). Selenocysteine lyase knockout mice, which could not correctively generate selenoproteins, showed more susceptible to DIO (30), while systemic overexpression of a selenoprotein MsrA in the mitochondria of the cells preserved insulin sensitivity in DIO mice (31). Our study may also suggest the role of SBP2-associated selenoproteins in ATMs for maintaining their antioxidant phenotype.
It was generally regarded that ATMs in lean tissue are anti-inflammatory and have an alternatively activated phenotype, in which they express the M2-like markers Ym1, arginase-1, and IL10 and the cell surface antigen CD206, while ATMs from obese tissue are prone to proinflammatory M1-like phenotype, in which they express classically activated markers, such as tumor necrosis factor–α and inducible nitric oxide synthase and the cell surface antigen CD11c (32). However, several recent studies identified that metabolically activated ATMs (MMe) has distinct phenotypes to bacterially activated macrophages (M1/M2 paradigm). MMe expressed proinflammatory phenotypes, which was distinct from bacterially activated M1-like macrophages and might not process the classical inflammation activation TLR pathway (16). MMe could also develop activation of lysosome biogenesis and might have lysosome-dependent lipid metabolism during obesity, which was independent of M1 polarization and inflammation activation (15). It is interesting to find that SBP2 overexpression may differentially regulate the expression of CD206 in metabolically and bacterially activated macrophages. SBP2 overexpression elevated CD206 in M1-like macrophages, which was not observable in MMe. LPS-induced classical activation of macrophages involved decreased CD206 presentation via TLR4/myeloid differentiation primary response 88 (MYD88)/ROS/NF-κB (nuclear factor-κB) pathway activation (33), which was merely observed in metabolically activated macrophages (16). The regulation of CD206 expression by SBP2 may therefore be associated with its differential roles on TLR activation in differently activated macrophages. In addition, in vivo recovery of SBP2 expression in diabetic db/db mice showed increased CD206 presentation on the macrophage cell surface. Established obese diabetes was observed with significant macrophage infiltration into the adipose tissue. Infiltrated macrophages during obesity development exhibited M1-like phenotype with TLR pathway activation (33), while the resident macrophages presented a MMe phenotype. This may also suggest that SBP2 overexpression in ATMs may target the heterogeneous macrophage populations in adipose tissue microenvironment and suppress inflammation activation in both M1-like and MMe macrophages.
ATMs activated TLR4 and inflammasome pathways to produce IL-1β, which could be secreted into the circulating system and mediated the infiltration of proinflammatory macrophages into the obese adipose tissue (25). We found that SBP2 overexpression blocked IL-1β production in both M1-like and MMe macrophages. Since MMe does not activate the TLR pathway but mainly depends on the inflammasome pathway to produce IL-1β, these data also suggest that the role of SBP2 in suppressing IL-1β in MMe could be highly inflammasome dependent. The role of SBP2 in regulating oxidative status-associated MMe phenotype and inflammasome may have cross-talk, which could not be fully distinguished, as a previous study showed that ROS might mediate inflammasome activation and IL-1β production (34). However, there may be some independent actions. A previous study showed that, in macrophages lack of selenoprotein expression, the inflammatory cytokine expression had not much changes (35), which suggested that scavenge of oxidative stress by antioxidant could not completely block IL-1β production. In the presence of potent antioxidant vitamin C, overexpression of SBP2 was able to further repress IL-1β production in MMe through interfering caspase-1 activation by the competitive binding to the pro-form of caspase-1. Overall, we suggested that SBP2 may present diverse function in suppressing inflammation in proinflammatory macrophages: First, SBP2 is responsible for the selenium-dependent translation of several endogenous antioxidant proteins, which keep a low level of intracellular ROS. As ROS is one of the well-known inducers of the inflammasome, SBP2-inhibiting intracellular ROS would lead to inflammasome inactivation; on the other hand, activated inflammasome recruits caspase-1, which executes IL-1β maturation. SBP2 could bind to caspase-1, keeping it away from inflammasome. Antibody-specific blockade of IL-1β had minimal effect on the ROS status in MMe, but IL-1β blockade could further reduce ROS in M1-like macrophages, suggesting that IL-1β majorly plays as downstream of ROS production. It is not fully understood why blockade of IL-1β could further reduce ROS in M1-like macrophages but not MMe. Extracellular IL-1β could activate the IL1R pathway to produce more intracellular ROS (36). However, it was postulated that TLR4 activation in M1-like macrophages could suppress the production of an endogenous inhibitor of IL-1β, IL1Ra, which competitively binds to IL1R against IL-1β (37), while in our study, we observed that SBP2 had the minimal effect of IL1Ra production in MMe. The further ROS suppression by IL-1β antibody in M1-like macrophages but not MMe may be due to the insufficient presence of IL1Ra due to TLR4 activation, allowing the additional IL-1β–IL1R binding for ROS production in M1-like macrophages. The mechanism underlying SBP2-regulated ATMs was proposed in Fig. 6F.
An obese individual may maintain a state of glucose intolerance for years before developing overt insulin resistance and hyperglycemia, which may only have minimal impact on the overall health (38). At this stage, adipose tissue undergoes expansion to increase the lipid storage, and there are only mild changes in the free fatty acid levels. When adipose tissue fails to buffer the fat influx, excessive free fatty acid occurs as an underlying cause of the onset of insulin resistance and T2D (39). The onset of diabetes-associated symptoms in obesity was accompanied by a marked increase of fatty acid that accounted for chronic factors such as glucolipotoxicity, inflammation, endoplasmic reticulum stress, and oxidative stress (40). While at an early stage of obesity, the expansion of ATMs might be dependent on the local proliferation of macrophages in fat tissue (21–23), the later development of adipose tissue inflammation critically involved macrophage infiltration and recruitment (24, 25). The role of SBP2 loss in promoting the infiltration of macrophages into adipose tissue and their local proliferation further suggested that loss of SBP2 expression during obesity was more likely to drive diabetes onset in obesity. Although measurement of phenotypic changes of ATMs after SBP2 knockdown in this study seemed complicated and might not utterly conclusive due to the current limitation in characterizing cell phenotype markers, all the current findings suggested that loss of SBP2 expression induced by fatty acid might be a promoting factor in accelerating hyperglycemia and insulin resistance in obesity.
TNTL is a holistic treatment used by ethnomedical practitioners in remote mountainous regions of southwestern China, where the experience of its successful application for treating the diabetic-like symptom. Although, in this study, an open-label, pilot clinical test preliminarily proved the efficacy of the standardized form of this ethnic medicine, large-scale randomized controlled trials (RCTs) with placebo control are necessary to prove its application within different groups of patients. Opening the labels of two large-scale RCTs (NCT02174042 and NCT02161276) in the near future will bring the conclusion that may justify the efficacy of TNTL in Chinese patients with diabetes.
In summary, we found that the expression of SBP2 was suppressed in ATMs during obesity. Loss of SBP2 induced M1-like repolarization from M2-like ATMs, in which the secreted factors by M1-like ATMs govern proinflammatory leukocyte infiltration and adipocyte lipogenesis in fat tissues. SBP2 loss in ATMs induced by saturated fatty acid induced metabolic activation of ATMs, resulting in its local proliferation and infiltration of proinflammatory macrophages in adipose tissue. Mechanistically, SBP2 was associated with the expression of several endogenous antioxidant proteins, which safeguarded ATMs from ROS and inflammasome activation. Loss of SBP2 increased intracellular ROS and activated inflammasome to process the maturation of IL-1β. SBP2 might also bound to caspase-1 to block its association with inflammasome. Thus, SBP2 deficiency in ATMs accelerated obesity-induced insulin resistance, while reexpression of SBP2 attenuated insulin resistance in obese mice. Last, a holistic formula TNTL treatment targeting SBP2 in ATMs reversed obesity-induced insulin resistance in an experimental murine model and improved hyperglycemia in patients with diabetes. Our study suggested that SBP2 in ATMs may be a potential therapeutic target in the treatment of obesity-induced insulin resistance.
MATERIALS AND METHODS
Study approval
All biological samples were obtained from the patients following written informed consent. The study obtained approval from the Institutional Review Board of the Bailin’ Diabetic Hospital. This study was performed in accordance with the Declaration of Helsinki protocols. Protocols for animal studies were approved by the Committee for the Use of Laboratory Animals for Teaching and Research of the University of Hong Kong.
Human subjects and clinical treatment
Twenty hospitalized participants meeting the following criteria were included: (i) 20 to 80 years of age, (ii) diagnosed with T2D (FBG ≥ 7.0 mM or 2-hour postprandial blood glucose ≥ 11.0 mM), and (iii) had not participated in other trials in the past 3 months. Patients received TNTL equivalent to 13.5 g of herbal weight every day for 3 months. A total of 5 ml of blood was taken, and FBG, 2-hour postprandial glucose, and serum HbA1c levels were measured at the beginning and the end of treatment.
Animal models
For DIO murine model, 5-week-old C57BL/J mice received HFD (60% kcal from fat; Research Diets, USA) for 2, 4, or 8 weeks. The particular duration of HFD feeding was indicated in the individual test. Mice receiving the normal chow diet were used as normal controls; 8-week-old male db/db mice (the Jackson laboratory, USA) were subjected to FBG tests. Only db/db mice with FBG ≥ 15.0 mM were included in the study. Each experimental group contained six mice except particular remarks.
Statistical analysis
Statistical significance was determined by the Student’s t test (two-tailed) and one-way analysis of variance (ANOVA) using GraphPad Prism 6 (GraphPad Software, La Jolla, CA). P < 0.05 was considered significant. Other experimental details can be found in the Supplementary Materials.
Supplementary Material
Acknowledgments
We would like to express our thanks to K. Wong, C. Lee, A. Shek, and the Faculty Core Facility of Li Ka Shing Faculty of Medicine, The University of Hong Kong, for technical support. Funding: This research was partially supported by the Research Council of the University of Hong Kong (project codes: 104003422, 104004092, 104004460, and 104004462), Wong’s donation (project code: 200006276), a donation from the Gaia Family Trust of New Zealand (project code: 200007008), a contract research project (project code: 260007482), the Research Grants Committee of Hong Kong (project codes: 740608, 766211, and 17152116), and Health and Medical Research Fund (project code: 15162961). Author contributions: N.W. performed the experiments, analyzed the data, and drafted the manuscript; H.-Y.T., S.L., D.W., Y.X., W.X., and C.Z. performed the experiments and analyzed the data; W.X. and C.-M.C. revised the manuscript; and Y.F. designed the experiments, analyzed the data, and drafted the manuscript. Competing interests: Y.F. received research grants from Bailing Pharmaceutical Co., who provided a standardized extract of TNTL for the whole study. All other authors declare that they have no competing interests. Data and materials availability: All data needed to evaluate the conclusions in the paper are present in the paper and/or the Supplementary Materials. Additional data related to this paper may be requested from the authors.
SUPPLEMENTARY MATERIALS
Supplementary material for this article is available at http://advances.sciencemag.org/cgi/content/full/5/8/eaav0198/DC1
Supplemental Experimental Details
Fig. S1. Determination of SBP2 expression in SBP2 tissue.
Fig. S2. SBP2 expression controls the phenotype polarization of ATMs.
Fig. S3. SBP2 overexpression had no significant effect on the lysosome exocytosis of MMe.
Fig. S4. Glucan-mediated macrophage-targeted delivery specifically suppressed SBP2 in ATMs.
Fig. S5. SBP2 suppressed activation of caspase-1 by the inflammasome.
Fig. S6. Eight-week knockdown of SBP2 in ATMs accelerated insulin resistance in DIO mice but not in diabetic db/db mice (n = 6).
Fig. S7. SBP2 knockdown in ATMs produced a more pronounced effect in male mice than female mice.
Fig. S8. Chemical and safety analysis of TNTL.
Table S1. Basic information of patients observed in the study.
Table S2. Primers to be used for quantitative reverse transcription polymerase chain reaction.
References and notes
- 1.Xu H., Barnes G. T., Yang Q., Tan G., Yang D., Chou C. J., Sole J., Nichols A., Ross J. S., Tartaglia L. A., Chen H., Chronic inflammation in fat plays a crucial role in the development of obesity-related insulin resistance. J. Clin. Invest. 112, 1821–1830 (2003). [DOI] [PMC free article] [PubMed] [Google Scholar]
- 2.Boutens L., Stienstra R., Adipose tissue macrophages: Going off track during obesity. Diabetologia 59, 879–894 (2016). [DOI] [PMC free article] [PubMed] [Google Scholar]
- 3.Dalmas E., Toubal A., Alzaid F., Blazek K., Eames H. L., Lebozec K., Pini M., Hainault I., Montastier E., Denis R. G. P., Ancel P., Lacombe A., Ling Y., Allatif O., Cruciani-Guglielmacci C., André S., Viguerie N., Poitou C., Stich V., Torcivia A., Foufelle F., Luquet S., Aron-Wisnewsky J., Langin D., Clément K., Udalova I. A., Venteclef N., Irf5 deficiency in macrophages promotes beneficial adipose tissue expansion and insulin sensitivity during obesity. Nat. Med. 21, 610–618 (2015). [DOI] [PubMed] [Google Scholar]
- 4.Bigornia S. J., Farb M. G., Mott M. M., Hess D. T., Carmine B., Fiscale A., Joseph L., Apovian C. M., Gokce N., Relation of depot-specific adipose inflammation to insulin resistance in human obesity. Nutr. Diabetes 2, e30 (2012). [DOI] [PMC free article] [PubMed] [Google Scholar]
- 5.Gribling-Burrer A.-S., Leichter M., Wurth L., Huttin A., Schlotter F., Troffer-Charlier N., Cura V., Barkats M., Cavarelli J., Massenet S., Allmang C., SECIS-binding protein 2 interacts with the SMN complex and the methylosome for selenoprotein mRNP assembly and translation. Nucleic Acids Res. 45, 5399–5413 (2017). [DOI] [PMC free article] [PubMed] [Google Scholar]
- 6.Dumitrescu A. M., Liao X.-H., Abdullah M. S. Y., Lado-Abeal J., Majed F. A., Moeller L. C., Boran G., Schomburg L., Weiss R. E., Refetoff S., Mutations in SECISBP2 result in abnormal thyroid hormone metabolism. Nat. Genet. 37, 1247–1252 (2005). [DOI] [PubMed] [Google Scholar]
- 7.Di Cosmo C., McLellan N., Liao X.-H., Khanna K. K., Weiss R. E., Papp L., Refetoff S., Clinical and molecular characterization of a novel selenocysteine insertion sequence-binding protein 2 (SBP2) gene mutation (R128X). J. Clin. Endocrinol. Metab. 94, 4003–4009 (2009). [DOI] [PMC free article] [PubMed] [Google Scholar]
- 8.Azevedo M. F., Barra G. B., Naves L. A., Ribeiro Velasco L. F., Godoy Garcia Castro P., de Castro L. C., Amato A. A., Miniard A., Driscoll D., Schomburg L., de Assis Rocha Neves F., Selenoprotein-related disease in a young girl caused by nonsense mutations in the SBP2 gene. J. Clin. Endocrinol. Metab. 95, 4066–4071 (2010). [DOI] [PubMed] [Google Scholar]
- 9.Schoenmakers E., Agostini M., Mitchell C., Schoenmakers N., Papp L., Rajanayagam O., Padidela R., Ceron-Gutierrez L., Doffinger R., Prevosto C., Luan J., Montano S., Lu J., Castanet M., Clemons N., Groeneveld M., Castets P., Karbaschi M., Aitken S., Dixon A., Williams J., Campi I., Blount M., Burton H., Muntoni F., O’Donovan D., Dean A., Warren A., Brierley C., Baguley D., Guicheney P., Fitzgerald R., Coles A., Gaston H., Todd P., Holmgren A., Khanna K. K., Cooke M., Semple R., Halsall D., Wareham N., Schwabe J., Grasso L., Beck-Peccoz P., Ogunko A., Dattani M., Gurnell M., Chatterjee K., Mutations in the selenocysteine insertion sequence-binding protein 2 gene lead to a multisystem selenoprotein deficiency disorder in humans. J. Clin. Invest. 120, 4220–4235 (2010). [DOI] [PMC free article] [PubMed] [Google Scholar]
- 10.Seeher S., Atassi T., Mahdi Y., Carlson B. A., Braun D., Wirth E. K., Klein M. O., Reix N., Miniard A. C., Schomburg L., Hatfield D. L., Driscoll D. M., Schweizer U., Secisbp2 is essential for embryonic development and enhances selenoprotein expression. Antioxid. Redox Signal. 21, 835–849 (2014). [DOI] [PMC free article] [PubMed] [Google Scholar]
- 11.Dalmas E., Venteclef N., Caer C., Poitou C., Cremer I., Aron-Wisnewsky J., Lacroix-Desmazes S., Bayry J., Kaveri S. V., Clément K., André S., Guerre-Millo M., T cell–derived IL-22 amplifies IL-1β–driven inflammation in human adipose tissue: Relevance to obesity and type 2 diabetes. Diabetes 63, 1966–1977 (2014). [DOI] [PubMed] [Google Scholar]
- 12.Kwon E.-Y., Shin S.-K., Cho Y.-Y., Jung U. J., Kim E., Park T., Park J. H. Y., Yun J. W., McGregor R. A., Park Y. B., Choi M.-S., Time-course microarrays reveal early activation of the immune transcriptome and adipokine dysregulation leads to fibrosis in visceral adipose depots during diet-induced obesity. BMC Genomics 13, 450 (2012). [DOI] [PMC free article] [PubMed] [Google Scholar]
- 13.Acosta J. R., Joost S., Karlsson K., Ehrlund A., Li X., Aouadi M., Kasper M., Arner P., Ryden M., Laurencikiene J., Single cell transcriptomics suggest that human adipocyte progenitor cells constitute a homogeneous cell population. Stem Cell Res. Ther. 8, 250 (2017). [DOI] [PMC free article] [PubMed] [Google Scholar]
- 14.Nawaz A., Aminuddin A., Kado T., Takikawa A., Yamamoto S., Tsuneyama K., Igarashi Y., Ikutani M., Nishida Y., Nagai Y., Takatsu K., Imura J., Sasahara M., Okazaki Y., Ueki K., Okamura T., Tokuyama K., Ando A., Matsumoto M., Mori H., Nakagawa T., Kobayashi N., Saeki K., Usui I., Fujisaka S., Tobe K., CD206+ M2-like macrophages regulate systemic glucose metabolism by inhibiting proliferation of adipocyte progenitors. Nat. Commun. 8, 286 (2017). [DOI] [PMC free article] [PubMed] [Google Scholar]
- 15.Xu X., Grijalva A., Skowronski A., van Eijk M., Serlie M. J., Ferrante A. W. Jr., Obesity activates a program of lysosomal-dependent lipid metabolism in adipose tissue macrophages independently of classic activation. Cell Metab. 18, 816–830 (2013). [DOI] [PMC free article] [PubMed] [Google Scholar]
- 16.Kratz M., Coats B. R., Hisert K. B., Hagman D., Mutskov V., Peris E., Schoenfelt K. Q., Kuzma J. N., Larson I., Billing P. S., Landerholm R. W., Crouthamel M., Gozal D., Hwang S., Singh P. K., Becker L., Metabolic dysfunction drives a mechanistically distinct proinflammatory phenotype in adipose tissue macrophages. Cell Metab. 20, 614–625 (2014). [DOI] [PMC free article] [PubMed] [Google Scholar]
- 17.Coats B. R., Schoenfelt K. Q., Barbosa-Lorenzi V. C., Peris E., Cui C., Hoffman A., Zhou G., Fernandez S., Zhai L., Hall B. A., Haka A. S., Shah A. M., Reardon C. A., Brady M. J., Rhodes C. J., Maxfield F. R., Becker L., Metabolically activated adipose tissue macrophages perform detrimental and beneficial functions during diet-induced obesity. Cell Rep. 20, 3149–3161 (2017). [DOI] [PMC free article] [PubMed] [Google Scholar]
- 18.Serbulea V., Upchurch C. M., Schappe M. S., Voigt P., DeWeese D. E., Desai B. N., Meher A. K., Leitinger N., Macrophage phenotype and bioenergetics are controlled by oxidized phospholipids identified in lean and obese adipose tissue. Proc. Natl. Acad. Sci. U.S.A. 115, E6254–E6263 (2018). [DOI] [PMC free article] [PubMed] [Google Scholar]
- 19.Aouadi M., Tencerova M., Vangala P., Yawe J. C., Nicoloro S. M., Amano S. U., Cohen J. L., Czech M. P., Gene silencing in adipose tissue macrophages regulates whole-body metabolism in obese mice. Proc. Natl. Acad. Sci. U.S.A. 110, 8278–8283 (2013). [DOI] [PMC free article] [PubMed] [Google Scholar]
- 20.Abais J. M., Xia M., Zhang Y., Boini K. M., Li P.-L., Redox regulation of NLRP3 inflammasomes: ROS as trigger or effector? Antioxid. Redox Signal. 22, 1111–1129 (2015). [DOI] [PMC free article] [PubMed] [Google Scholar]
- 21.Zheng C., Yang Q., Cao J., Xie N., Liu K., Shou P., Qian F., Wang Y., Shi Y., Local proliferation initiates macrophage accumulation in adipose tissue during obesity. Cell Death Dis. 7, e2167 (2016). [DOI] [PMC free article] [PubMed] [Google Scholar]
- 22.Amano S. U., Cohen J. L., Vangala P., Tencerova M., Nicoloro S. M., Yawe J. C., Shen Y., Czech M. P., Aouadi M., Local proliferation of macrophages contributes to obesity-associated adipose tissue inflammation. Cell Metab. 19, 162–171 (2014). [DOI] [PMC free article] [PubMed] [Google Scholar]
- 23.Muir L. A., Kiridena S., Griffin C., DelProposto J. B., Geletka L., Martinez-Santibañez G., Zamarron B. F., Lucas H., Singer K., O’Rourke R. W., Lumeng C. N., Frontline science: Rapid adipose tissue expansion triggers unique proliferation and lipid accumulation profiles in adipose tissue macrophages. J. Leukoc. Biol. 103, 615–628 (2018). [DOI] [PMC free article] [PubMed] [Google Scholar]
- 24.Lê K. A., Mahurkar S., Alderete T. L., Hasson R. E., Adam T. C., Kim J. S., Beale E., Xie C., Greenberg A. S., Allayee H., Goran M. I., Subcutaneous adipose tissue macrophage infiltration is associated with hepatic and visceral fat deposition, hyperinsulinemia, and stimulation of NF-κB stress pathway. Diabetes 60, 2802–2809 (2011). [DOI] [PMC free article] [PubMed] [Google Scholar]
- 25.Nagareddy P. R., Kraakman M., Masters S. L., Stirzaker R. A., Gorman D. J., Grant R. W., Dragoljevic D., Hong E. S., Abdel-Latif A., Smyth S. S., Choi S. H., Korner J., Bornfeldt K. E., Fisher E. A., Dixit V. D., Tall A. R., Goldberg I. J., Murphy A. J., Adipose tissue macrophages promote myelopoiesis and monocytosis in obesity. Cell Metab. 19, 821–835 (2014). [DOI] [PMC free article] [PubMed] [Google Scholar]
- 26.Pettersson U. S., Waldén T. B., Carlsson P.-O., Jansson L., Phillipson M., Female mice are protected against high-fat diet induced metabolic syndrome and increase the regulatory T cell population in adipose tissue. PLOS ONE 7, e46057 (2012). [DOI] [PMC free article] [PubMed] [Google Scholar]
- 27.Soto E. R., Ostroff G. R., Characterization of multilayered nanoparticles encapsulated in yeast cell wall particles for DNA delivery. Bioconjug. Chem. 19, 840–848 (2008). [DOI] [PubMed] [Google Scholar]
- 28.Zhang Y., Choksi S., Chen K., Pobezinskaya Y., Linnoila I., Liu Z.-G., ROS play a critical role in the differentiation of alternatively activated macrophages and the occurrence of tumor-associated macrophages. Cell Res. 23, 898–914 (2013). [DOI] [PMC free article] [PubMed] [Google Scholar]
- 29.Zhao H., Li K., Tang J.-Y., Zhou J.-C., Wang K.-N., Xia X.-J., Lei X. G., Expression of selenoprotein genes is affected by obesity of pigs fed a high-fat diet. J. Nutr. 145, 1394–1401 (2015). [DOI] [PMC free article] [PubMed] [Google Scholar]
- 30.Seale L. A., Gilman C. L., Hashimoto A. C., Ogawa-Wong A. N., Berry M. J., Diet-induced obesity in the selenocysteine lyase knockout mouse. Antioxid. Redox Signal. 23, 761–774 (2015). [DOI] [PMC free article] [PubMed] [Google Scholar]
- 31.Hunnicut J., Liu Y., Richardson A., Salmon A. B., MsrA overexpression targeted to the mitochondria, but not cytosol, preserves insulin sensitivity in diet-induced obese mice. PLOS ONE 10, e0139844 (2015). [DOI] [PMC free article] [PubMed] [Google Scholar]
- 32.Lumeng C. N., Bodzin J. L., Saltiel A. R., Obesity induces a phenotypic switch in adipose tissue macrophage polarization. J. Clin. Invest. 117, 175–184 (2007). [DOI] [PMC free article] [PubMed] [Google Scholar]
- 33.Yu M., Zhou H., Zhao J., Xiao N., Roychowdhury S., Schmitt D., Hu B., Ransohoff R. M., Harding C. V., Hise A. G., Hazen S. L., DeFranco A. L., Fox P. L., Morton R. E., Dicorleto P. E., Febbraio M., Nagy L. E., Smith J. D., Wang J.-a., Li X., MyD88-dependent interplay between myeloid and endothelial cells in the initiation and progression of obesity-associated inflammatory diseases. J. Exp. Med. 211, 887–907 (2014). [DOI] [PMC free article] [PubMed] [Google Scholar]
- 34.Arifa R. D. N., Madeira M. F. M., de Paula T. P., Lima R. L., Tavares L. D., Menezes-Garcia Z., Fagundes C. T., Rachid M. A., Ryffel B., Zamboni D. S., Teixeira M. M., Souza D. G., Inflammasome activation is reactive oxygen species dependent and mediates irinotecan-induced mucositis through IL-1β and IL-18 in mice. Am. J. Pathol. 184, 2023–2034 (2014). [DOI] [PubMed] [Google Scholar]
- 35.Carlson B. A., Yoo M.-H., Sano Y., Sengupta A., Kim J. Y., Irons R., Gladyshev V. N., Hatfield D. L., Park J. M., Selenoproteins regulate macrophage invasiveness and extracellular matrix-related gene expression. BMC Immunol. 10, 57 (2009). [DOI] [PMC free article] [PubMed] [Google Scholar]
- 36.Pang T., Wang J., Benicky J., Sánchez-Lemus E., Saavedra J. M., Telmisartan directly ameliorates the neuronal inflammatory response to IL-1β partly through the JNK/c-Jun and NADPH oxidase pathways. J. Neuroinflammation 9, 102 (2012). [DOI] [PMC free article] [PubMed] [Google Scholar]
- 37.Carta S., Tassi S., Delfino L., Omenetti A., Raffa S., Torrisi M. R., Martini A., Gattorno M., Rubartelli A., Deficient production of IL-1 receptor antagonist and IL-6 coupled to oxidative stress in cryopyrin-associated periodic syndrome monocytes. Ann. Rheum. Dis. 71, 1577–1581 (2012). [DOI] [PubMed] [Google Scholar]
- 38.Weir G. C., Bonner-Weir S., Five stages of evolving beta-cell dysfunction during progression to diabetes. Diabetes 53 (suppl. 3), S16–S21 (2004). [DOI] [PubMed] [Google Scholar]
- 39.McQuaid S. E., Hodson L., Neville M. J., Dennis A. L., Cheeseman J., Humphreys S. M., Ruge T., Gilbert M., Fielding B. A., Frayn K. N., Karpe F., Downregulation of adipose tissue fatty acid trafficking in obesity: A driver for ectopic fat deposition? Diabetes 60, 47–55 (2011). [DOI] [PMC free article] [PubMed] [Google Scholar]
- 40.Liu Y., Prentice K. J., Eversley J. A., Hu C., Batchuluun B., Leavey K., Hansen J. B., Wei D. W., Cox B., Dai F. F., Jia W., Wheeler M. B., Rapid elevation in CMPF may act as a tipping point in diabetes development. Cell Rep. 14, 2889–2900 (2016). [DOI] [PubMed] [Google Scholar]
Associated Data
This section collects any data citations, data availability statements, or supplementary materials included in this article.
Supplementary Materials
Supplementary material for this article is available at http://advances.sciencemag.org/cgi/content/full/5/8/eaav0198/DC1
Supplemental Experimental Details
Fig. S1. Determination of SBP2 expression in SBP2 tissue.
Fig. S2. SBP2 expression controls the phenotype polarization of ATMs.
Fig. S3. SBP2 overexpression had no significant effect on the lysosome exocytosis of MMe.
Fig. S4. Glucan-mediated macrophage-targeted delivery specifically suppressed SBP2 in ATMs.
Fig. S5. SBP2 suppressed activation of caspase-1 by the inflammasome.
Fig. S6. Eight-week knockdown of SBP2 in ATMs accelerated insulin resistance in DIO mice but not in diabetic db/db mice (n = 6).
Fig. S7. SBP2 knockdown in ATMs produced a more pronounced effect in male mice than female mice.
Fig. S8. Chemical and safety analysis of TNTL.
Table S1. Basic information of patients observed in the study.
Table S2. Primers to be used for quantitative reverse transcription polymerase chain reaction.