

Abstract
The effectiveness of checkpoint kinase 1 (Chk1) inhibitors at killing cancer cells is considered to be fully dependent on their effect on DNA replication initiation. Chk1 inhibition boosts origin firing, presumably limiting the availability of nucleotides and in turn provoking the slowdown and subsequent collapse of forks, thus decreasing cell viability. Here we show that slow fork progression in Chk1‐inhibited cells is not an indirect effect of excess new origin firing. Instead, fork slowdown results from the accumulation of replication barriers, whose bypass is impeded by CDK‐dependent phosphorylation of the specialized DNA polymerase eta (Polη). Also in contrast to the linear model, the accumulation of DNA damage in Chk1‐deficient cells depends on origin density but is largely independent of fork speed. Notwithstanding this, origin dysregulation contributes only mildly to the poor proliferation rates of Chk1‐depleted cells. Moreover, elimination of replication barriers by downregulation of helicase components, but not their bypass by Polη, improves cell survival. Our results thus shed light on the molecular basis of the sensitivity of tumors to Chk1 inhibition.
Keywords: checkpoint kinase 1, origin firing, replication barrier, replicative helicase, translesion DNA polymerase eta
Subject Categories: DNA Replication, Repair & Recombination
Introduction
DNA replication is a complex process: It demands accuracy despite the vast number of replication barriers that stall DNA polymerases (Zeman & Cimprich, 2014). DNA replication is thus subject to exquisite control, i.e., checkpoint signaling and DNA lesion repair or tolerance (Branzei & Foiani, 2010; Ciccia & Elledge, 2010). Challenging such control has devastating consequences, as it can lead to genomic instability and cell death. Even cancer cells, which benefit from losing genomic stability, do keep many of such regulatory mechanisms to control DNA replication, although in a more permissive way (Gaillard et al, 2015; Tubbs & Nussenzweig, 2017).
Checkpoint kinase 1 (Chk1) is instrumental in regulating S phase progression (Gonzalez Besteiro & Gottifredi, 2015) and thus essential to the survival of cancer cells that lack other cell cycle checkpoints or possess high replication stress (Massey, 2017; Qiu et al, 2018). In unperturbed conditions, Chk1 loss triggers excess origin firing and reduced rates of fork elongation (Syljuasen et al, 2005; Petermann et al, 2006; Maya‐Mendoza et al, 2007). Chk1 inhibits origin firing by modulating two key actors of DNA replication initiation: Cyclin E‐CDK2 (cyclin‐dependent kinase 2) and Ddk (Dbf4‐Drf1‐dependent Cdc7 kinase). In particular, Chk1 phosphorylates and thereby triggers the degradation of the phosphatase Cdc25A (Sorensen et al, 2003), a positive regulator of CDK2 (Sorensen & Syljuasen, 2012); Chk1 also phosphorylates Dbf4 and thereby inhibits Ddk (Heffernan et al, 2007). Our current understanding of the mechanisms controlling fork progression in Chk1‐defective cells lacks such molecular detail. One hypothesis is that reduced fork elongation is triggered by increased replication initiation (Petermann et al, 2010). Indeed, this has been proposed also in the context of the inactivation of another regulator of CDK activity, Wee1 (Beck et al, 2012). However, mounting evidence suggests that fork elongation rates and origin firing are not strictly interdependent variables in Chk1‐deficient cells. For example, the stable expression of a mutant version of Chk1 (Chk1S317A) in Chk1‐inactivated DLD‐1 cells reduces excess origin firing without restoring fork elongation rates (Wilsker et al, 2008). Moreover, a recent report showed that activation of the ATM pathway induces fork slowing in Chk1‐inhibited JEFF cells, independently of origin density (Techer et al, 2016).
Origin firing and ATM activation are signals that affect nascent DNA elongation at a global, nucleoplasmic scale. However, local signals, i.e., events that take place at the slow fork itself, should also be taken into consideration (Toledo et al, 2013; Gonzalez Besteiro & Gottifredi, 2015). Replication barriers are one of such local events that can be detrimental to fork progression. In response to genotoxic agents, Chk1 promotes translesion synthesis (TLS) at replication barriers (Yang et al, 2008; Speroni et al, 2012; Yamada et al, 2013); Chk1 thus directly contributes to the elongation of nascent DNA at damaged forks. In unperturbed conditions, MAP kinase‐activated protein kinase 2 (MK2) inhibition, which promotes TLS across gemcitabine‐damaged DNA, also aids fork progression in Chk1‐inhibited cells (Kopper et al, 2013). Thus, local signals in Chk1‐deficient cells may dictate the fate of replication forks.
In this report, we show that Chk1 deficiency in unperturbed cells directly affects fork elongation, as forks devoid of Chk1 are overflowed with replication barriers. Although such barriers recruit TLS polymerase Polη, high CDK activity prevents Polη‐dependent replication. As a result, fork elongation in Chk1‐deficient cells is profoundly affected, in a manner that is completely dissociated from the control of new origin firing. Indeed, the downregulation of the initiation factors CDT1 and CDC7, which restore origin firing levels in Chk1‐depleted cells, does not mitigate fork elongation defects. Interestingly, unleashed origin firing, not reduced elongation rates, accounts for the excess of DNA damage observed upon Chk1 loss. Poor proliferation rates, on the other hand, result from elevated new origin firing and high levels of replication barriers, while the bypass of such barriers is irrelevant to cell survival. Hence, in Chk1‐deficient cells, origin firing and fork elongation rates are modulated independently and control distinct biologically relevant outputs.
Results
Chk1 loss generates replication‐associated obstacles that impair nascent DNA elongation
Chk1 deficiency severely restrains replication fork rates in unperturbed cancer cells (Petermann et al, 2006). Reduced fork elongation can result from a constant reduction in fork speed and/or the increased frequency of encounter of forks with replication barriers. To explore these possibilities, we conducted DNA fiber assays in which the thymidine analogues CldU and IdU were sequentially pulsed for equal times (20‐min each). If forks encounter obstacles as they progress, the CldU/IdU ratio should deviate from 1, the expected ratio for constant replication fork speed (Galanos et al, 2016; Techer et al, 2016; Maya‐Mendoza et al, 2018). The distributions of ratios in U2OS cells depleted of Chk1 by siRNA were similar to the control (Fig EV1A–D). These data are in agreement with previous reports (Speroni et al, 2012; Koundrioukoff et al, 2013; Techer et al, 2016) and support the notion that, although slower, replication in Chk1‐deficient cells is steady.
Figure EV1. Chk1 loss generates replication‐associated obstacles that impair nascent DNA elongation.
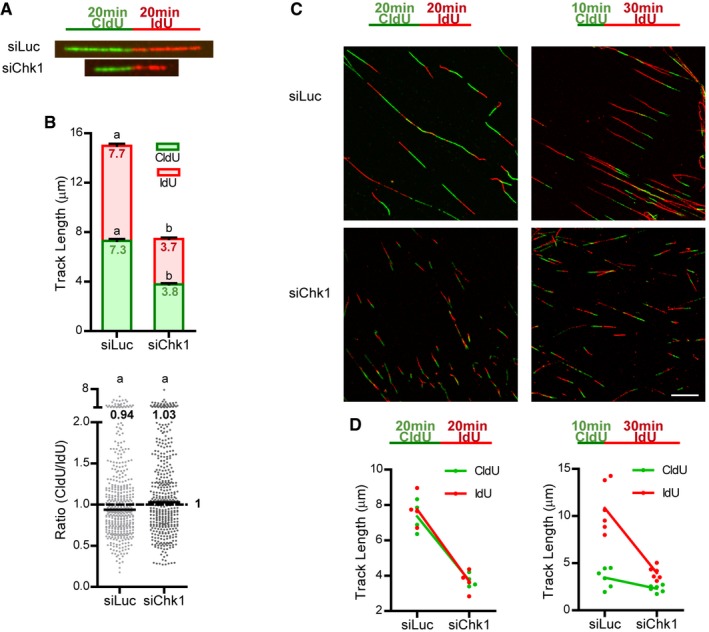
- Labeling scheme and representative DNA fibers from control (siLuc) and Chk1‐depleted (siChk1) U2OS cells.
- U20S cells were labeled with CldU and IdU for 20 min each. Mean (± SEM) track lengths (top) and CldU/IdU ratios (bottom) are shown. Data come from four independent experiments, and a total of 436 (siLuc) and 422 (siChk1) fibers were scored.
- Representative fields of spread DNA from U2OS cells, labeled with CldU and IdU according to the schemes. Scale bar: 10 μm.
- Mean CldU and IdU track lengths from (B) and Fig 1C. The slope representing the drop in fork elongation in Chk1‐depleted cells is equal for both analogues under a 20 + 20 min labeling protocol (left panel), but more pronounced for the second analogue (IdU) under a 10 + 30 min labeling scheme (right panel).
Notwithstanding this, we were intrigued by the fact that Chk1‐depleted cells do show a very slight, though reproducible increment in the CldU/IdU ratio. We reasoned that some defects might go unnoticed by using equal CldU and IdU labeling times, so we turned to a 10‐min CldU + 30‐min IdU labeling protocol. The expected CldU/IdU ratio should be 0.33 in case forks do not encounter barriers as they progress. However, because the probability that an obstacle blocks fork progression is higher during the longer pulse, the CldU/IdU ratio should be > 0.33 in the presence of replication barriers. Interestingly, although in control U2OS cells the median CldU/IdU ratio (0.31) was close to the expected ratio, Chk1‐depleted or inhibited cells showed a median ratio of ~0.6 (Fig 1A–E); i.e., upon Chk1 loss forks elongate relatively less during the second pulse (Fig EV1C and D). We obtained similar results in HCT116 cells (Appendix Fig S1).
Figure 1. Replication fork progression is unsteady after Chk1 loss.
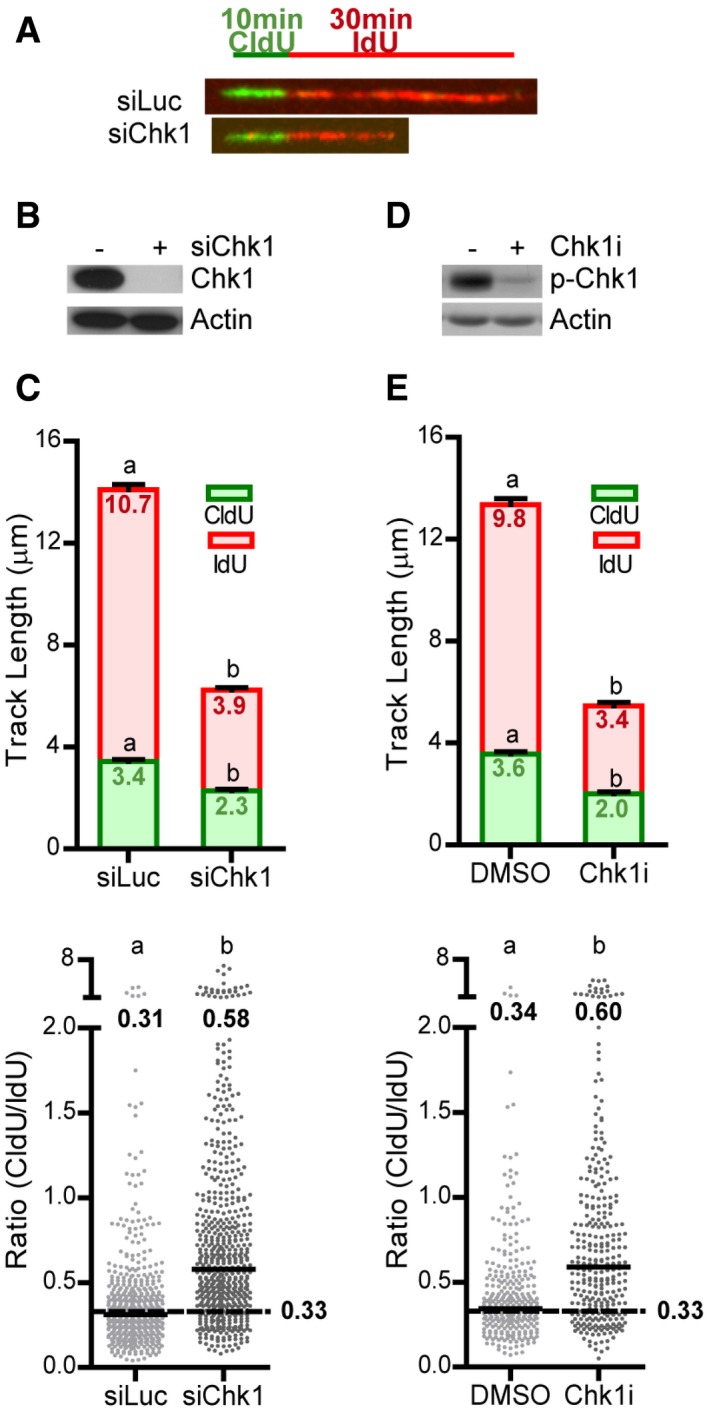
- Labeling scheme and representative DNA fibers from control (siLuc) and Chk1‐depleted (siChk1) U2OS cells.
- Western blot of Chk1 in U2OS cells, 48 h after transfection with siRNA. Actin was used as loading control.
- U20S cells were labeled with CldU and IdU for 10 and 30 min, respectively. Mean (± SEM) track lengths (top) and CldU/IdU ratios (bottom) are shown. Data come from 6 independent experiments and a total of 579 (siLuc) and 590 (siChk1) fibers were scored.
- Western blot of phospho‐serine‐296‐Chk1 (p‐Chk1) in U2OS cells. Cells were treated 1.5 h with the Chk1 inhibitor Gö6976 (Chk1i) or DMSO (control), irradiated with 100 J/m2 UV to induce high levels of p‐Chk1, and collected 1.5 h afterward. Actin was used as a loading control.
- U2OS cells treated with DMSO or Chk1i were labeled with CldU and IdU for 10 and 30 min, respectively. Data come from three independent experiments and a total of 304 (DMSO) and 312 (Chk1i) fibers were scored.
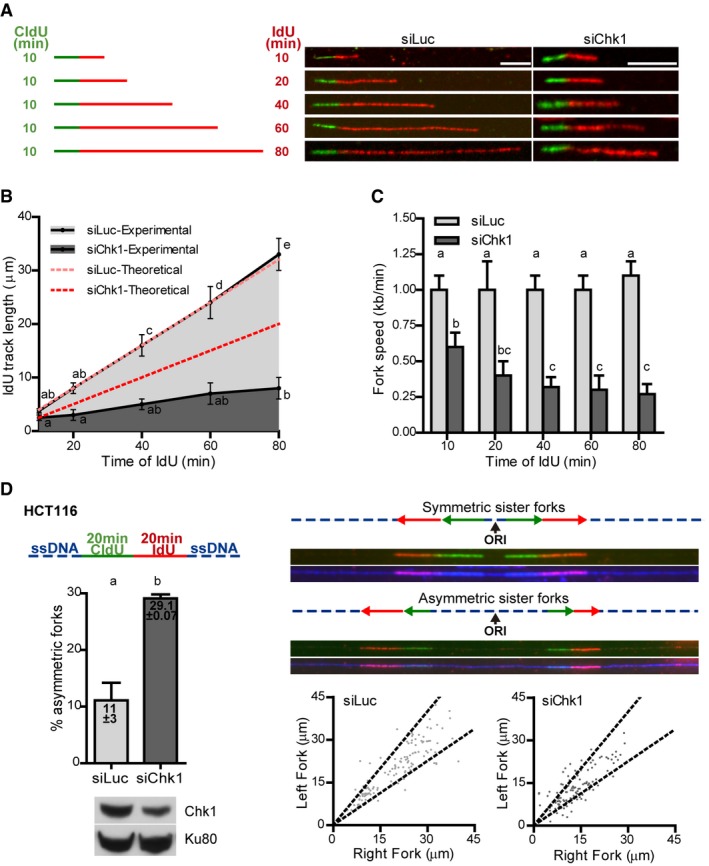
These data rule out the possibility that in Chk1‐deficient cells forks progress at a constant speed and suggest that replication elongation is slower as forks progress further from origins. To test this possibility, we labeled U2OS cells for 10 min with CldU, followed by increasing pulses of IdU (10–80 min) (Fig 2A). As expected, we observed constant replication fork speeds in control cells, which fully overlapped with the theoretical estimates. However, forks in Chk1‐depleted cells deaccelerated as labeling time with the second thymidine analogue increased (Fig 2B and C). Consistently, Chk1 deficiency in HCT116 cells provoked fork asymmetry (Fig 2D), as measured by DNA combing, an unequivocal proof of the presence of obstacles to replication (Conti et al, 2007). Altogether, our data suggest that fork progression in the absence of Chk1 generates obstacles to the replisome, which negatively feedback on fork elongation.
Figure 2. Chk1 loss generates replication‐associated obstacles that impair nascent DNA elongation.
-
A–CU2OS cells were labeled with CldU for 10 min, followed by increasing IdU labeling times and subjected to DNA stretching. (A) Labeling scheme and representative DNA fibers. Scale bars: 5 μm. (B) IdU track length after 10–80 min. Theoretical IdU track lengths are shown in red; the theoretical 10‐min points were considered equal to the experimental values obtained for siLuc or siChk1, and the following theoretical points were calculated proportionally. (C) Fork speed for each IdU labeling time. Data were calculated as the mean (± SD) of mean IdU track lengths (B) or mean fork speeds (C). n = 4 for IdU times 20–60 min or n = 3 for IdU times 10 and 80 min; for each experiment and condition 60–100 fibers were scored.
-
DDNA combing from HCT116 cells labeled with CldU and IdU for 20 min. The upper left panel shows the labeling scheme. The upper right panel shows representative sister replication forks that emanate from the same origin (ORI = origin of replication); a pair of sister forks is considered asymmetric if their lengths (CldU + IdU) differ in more than 33%. The percentage of asymmetric forks (lower left panel; a Western blot of Chk1 and Ku80, loading control, performed in parallel to the combing experiments, is shown) and the lengths of each pair of forks (lower right panel; points outside of the dotted lines correspond to asymmetric forks) are shown. Data (siLuc, n = 131; siChk1, n = 117) come from two independent experiments; the numbers indicate the mean (± SD) percentage of asymmetric forks.
High CDK activity prevents Polη‐dependent bypass of replication barriers created by Chk1 loss
To explore the nature of the replication barriers created by Chk1 loss, we asked which transactions known to control track length took place at forks in Chk1‐depleted cells (Fig EV2A–G). Our data indicate that replication roadblocks created by Chk1 loss may induce fork reversal (but not Mre11‐mediated degradation; Fig EV2A and E) and are prone to TLS (Fig EV2F and G). Monoubiquitination of the proliferating cell nuclear antigen PCNA, a processivity factor for DNA polymerases (mono‐Ub PCNA), enables the recruitment of specialized polymerases to damaged forks or post‐replicative DNA lesions (Vaisman & Woodgate, 2017). Supporting the notion that Chk1 loss generates DNA replication barriers, Chk1 depletion caused the accumulation of mono‐ub PCNA and of TLS polymerase Polη (Fig EV2F). Importantly, Polη accumulated at replication forks following Chk1 depletion, as evidenced by iPOND (isolation of proteins on nascent DNA) (Sirbu et al, 2011; Fig EV2G). Together, these results suggest that Chk1 deficiency elicits the accumulation of replication fork barriers, which recruit Polη.
Figure EV2. Replication fork progression in Chk1‐depleted cells is unaffected by Mre11‐mediated degradation, conflicts with transcription, MUS81‐dependent DSBs, or surplus converging forks, but it is associated with fork reversal and Polη enrichment at forks.
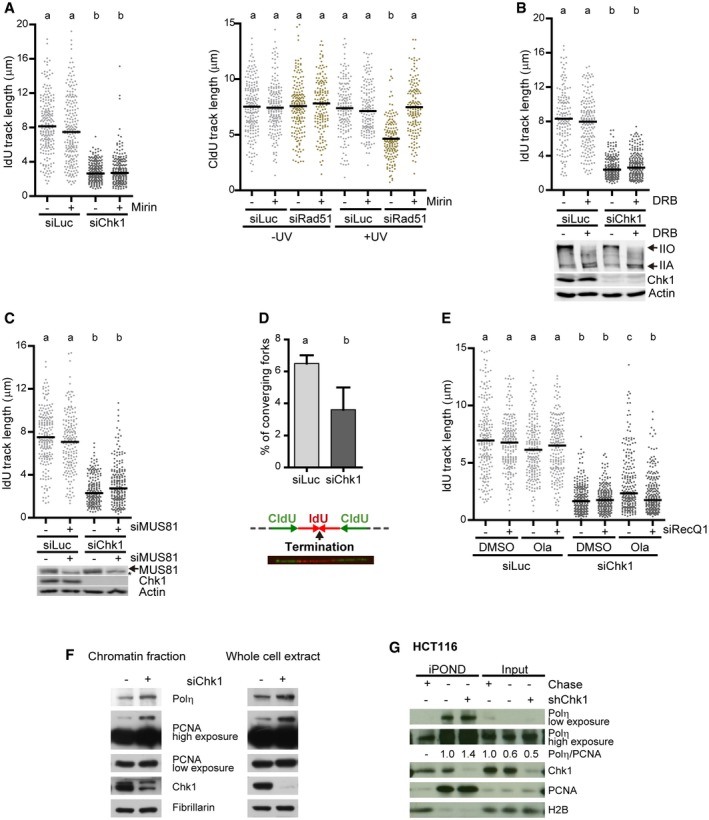
- IdU track lengths from U2OS cells treated or not with mirin, an inhibitor of Mre11 exonuclease activity. > 200 DNA fibers obtained from two independent experiments were measured for each condition. The right panel serves as a control showing that mirin prevents degradation of nascent DNA in other conditions, specifically UV‐irradiated, Rad51‐depleted U2OS cells (Vallerga et al, 2015). > 150 DNA fibers obtained from 2 independent experiments were measured for each condition.
- IdU track lengths from U2OS cells treated or not with DRB, an inhibitor of RNA Pol II‐dependent transcription elongation that limits R‐loop formation (Kotsantis et al, 2016). > 150 DNA fibers obtained from two independent experiments were measured for each condition. The lower panel shows the corresponding Western blot of Rpb1 (the largest subunit of Pol II, whose hypo‐phosphorylated and hyper‐phosphorylation forms IIA and IIO indicate inactive and active transcription, respectively) and Chk1. Actin was used as a loading control.
- IdU track lengths from U2OS cells transfected or not with siMUS81. > 170 DNA fibers obtained from two independent experiments were measured for each condition. The lower panel shows the corresponding Western blot of MUS81 and Chk1. Actin was used as a loading control. The asterisk (*) indicates an unspecific band.
- Percentage of converging forks (mean ± SD) in U2OS cells. ˜1,400 DNA fibers obtained from seven independent experiments were scored for each condition. The lower panel shows a representative image and scheme of two converging forks. Gray dotted lines represent unlabeled DNA.
- IdU track lengths from U2OS cells treated or not with the PARP inhibitor Olaparib (Ola), which prevents fork reversal, and siRNA against the RecQ1 helicase, which is required for the restart of regressed forks (Berti et al, 2013). > 200 DNA fibers obtained from two independent experiments were measured for each condition.
- Western blot of Polη, PCNA, and Chk1 in U2OS cells, after a 60‐s extraction with CSK buffer to separate the insoluble and soluble fractions. Fibrillarin was used as a loading control.
- iPOND of HCT116 cells 96 h after transduction with shRNA targeting Chk1 (shChk1) or non‐targeting shRNA (‐, shScramble).
Even if Polη accumulates at forks in Chk1‐depleted cells, siRNA depletion of Polη had no major effect on the progression of forks (Fig 3A and B). CDK2 phosphorylates Polη and thereby modulates Polη‐dependent synthesis (Dai et al, 2016; Bertoletti et al, 2017). Roscovitine, a CDK inhibitor, attenuates reduced replication rates in Chk1‐deficient cells, which aberrantly activate CDK2 (Petermann et al, 2010; Gonzalez Besteiro & Gottifredi, 2015; Sanjiv et al, 2016). We thus hypothesized that CDK2‐dependent phosphorylation of Polη restrains the bypass of the replication barriers created by Chk1 loss, resulting in reduced replication fork rates. Indeed, Chk1 depletion augmented Polη phosphorylation (Appendix Fig S2) and the depletion of Polη prevented the roscovitine‐dependent rescue of fork progression in Chk1‐depleted cells (Fig 3B and Appendix Fig S3A). Polη downregulation did not interfere with roscovitine‐mediated rescue of excess origin firing (Fig 3A and C). This is important because a modification in origin firing levels could generate differences in replication fork progression rates (Rodriguez‐Acebes et al, 2018).
Figure 3. High CDK activity prevents Polη‐dependent bypass of replication barriers created by Chk1 loss.
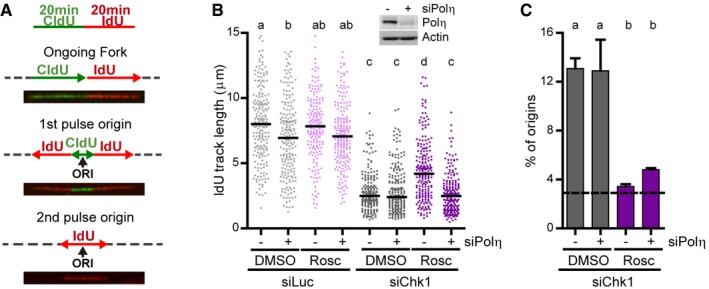
- Labeling protocol used here and in all figures that follow, except otherwise indicated. The lower panels show representative images and schemes of an ongoing fork and of origins that fired during the CldU (1st) or IdU (2nd) pulses. Gray dotted lines represent unlabeled DNA. Percentage of origins was calculated as: (1st+2nd pulse origins)/total number of fibers.
- IdU track lengths from U2OS cells (Rosc, roscovitine). 180–200 DNA fibers obtained from two independent experiments were measured for each condition. The upper panel shows a Western blot of Polη, 48 h after transfection with siRNA. Actin was used as a loading control.
- Percentage of origin firing (mean ± SD) from DNA fibers in (A) (n = 2). The dotted line represents the mean percentage of origin firing in control samples.
Excess origin firing in cells with high CDK activity is thought to underline nucleoside (NS) starvation and subsequent slowdown of forks (Petermann et al, 2010; Beck et al, 2012). Indeed, similar to roscovitine, supplementation with NS alleviated fork asymmetry and slow fork progression in Chk1‐depleted cells (Appendix Fig S3B). However, NS‐dependent recovery of fork progression depended strongly on Polη (Appendix Fig S3C), arguing against a predominant effect of a nucleoplasmic signal on fork progression. Altogether, our results imply that excess CDK activity in Chk1‐deficient cells hinders fork elongation directly, via phosphorylation of Polη, and thus independently of origin firing.
Serine 687 phosphorylation status determines GFP‐Polη function at replication barriers created by Chk1 loss
To further reinforce the notion that high CDK activity compromises fork progression in Chk1‐depleted cells by acting at a local scale, we sought to strengthen the link between CDK and Polη in this context. Polη contains four conserved putative CDK phosphorylation sites (Fig 4A). To identify the site(s) relevant to the bypass of replication barriers created by Chk1 loss, we overexpressed phosphomimetic versions of GFP‐Polη in a Chk1‐deficient background and performed a DNA fiber assay. If Polη function is negatively regulated by CDK activity (Fig 3B and Appendix Fig S3A), phosphomimetic GFP‐Polη should be unable to rescue impaired fork progression provoked by Chk1 depletion. While GFP‐Polη overexpression, but not catalytically inactive GFP‐Polη, increased fork elongation in Chk1‐depleted U2OS cells (Appendix Fig S4A), phosphomimetic mutation of three highly conserved residues (S512, T591, S416) had no impact on GFP‐Polη‐mediated fork elongation in Chk1‐depleted cells (Appendix Fig S4B). The fourth site, S687, resides within the NLS (nuclear localization signal) of Polη (Fig 4A). Notwithstanding this, GFP‐Polη‐S687D (serine 687 to aspartate), similar to GFP‐Polη‐WT and GFP‐Polη‐S687A (serine 687 to alanine), localized in the nucleus (Dai et al, 2016; Bertoletti et al, 2017) (Fig 4B). Interestingly however, overexpression of phosphomimetic GFP‐Polη‐S687D did not rescue impaired fork elongation of Chk1‐depleted U2OS cells, in contrast to the effect of GFP‐Polη‐WT or GFP‐Polη‐S687A (Fig 4C and D). Importantly, and in contrast to GFP‐Polη‐S687A, GFP‐Polη‐WT rescued fork slowdown in Chk1‐depleted cells in a dose‐dependent manner, suggesting that overexpression overrides phosphorylation (Fig EV3A).
Figure 4. Serine 687 phosphorylation status determines GFP‐Polη function at replication barriers created by Chk1 loss.
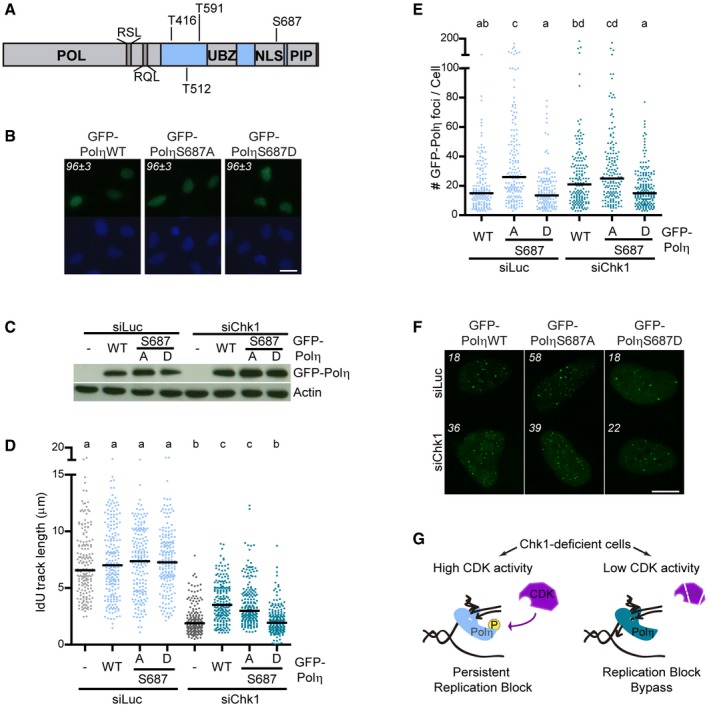
- Schematic representation of human Polη showing conserved, putative CDK phosphorylation S/TP sites and cyclin‐binding domains (RxL). POL: polymerase domain, UBZ: ubiquitin‐binding zinc finger, NLS: nuclear localization signal, PIP: PCNA‐binding domain.
- Representative images of Chk1‐depleted U2OS cells showing nuclear localization of GFP‐Polη‐WT/S687A/S687D. Numbers indicate percentage of cells showing nuclear GFP‐Polη (mean ± SD, n = 2). Scale bar: 100 μm.
- Western blot of GFP‐Polη in U2OS cells, 48/24 h after transfection with siRNA/GFP(‐Polη). Actin was used as loading control.
- IdU track lengths from U2OS cells transfected with GFP (−) or GFP‐Polη‐WT/S687A/S687D. > 180 fibers obtained from two independent experiments were measured for each condition.
- Number of foci per cell after CSK extraction in U2OS cells transfected with GFP‐Polη‐WT/S687A/S687D. > 150 cells/sample were analyzed in four independent experiments. P < 0.05 was considered significant.
- Representative images of cells with GFP‐Polη foci used for quantification in (E). The number of foci per cell for each representative nucleus is indicated. Scale bar: 10 μm.
- Model that depicts the effect of CDK‐dependent phosphorylation of Polη on fork elongation. In Chk1‐deficient cells, replication barriers accumulate and recruit Polη. CDKs, whose activity is high in Chk1‐deficient cells, phosphorylate Polη, impeding its engagement in fork elongation. Upon CDK inhibition, Polη bypasses replication barriers created by Chk1 loss, promoting fork elongation.
Figure EV3. Serine 687 phosphorylation status determines GFP‐Polη function, not recruitment, at replication barriers created by Chk1 loss.
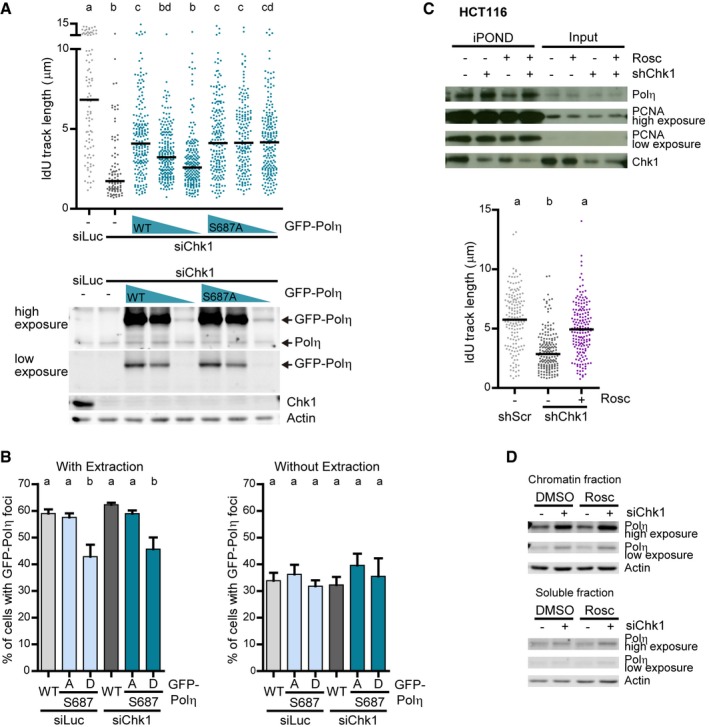
- IdU track lengths from U2OS cells transfected with GFP (−) or decreasing amounts of GFP‐Polη‐WT/S687A. > 175 fibers obtained from two independent experiments were measured for each condition. The lower panel shows the corresponding Western blot of Chk1, GFP‐Polη, and endogenous Polη. Actin was used as a loading control.
- U2OS cells were subjected (left) or not (right) to a 15‐s extraction with CSK buffer, and the percentage of cells with GFP‐Polη (mean ± SD) was determined. > 600 cells/sample were analyzed in three independent experiments.
- iPOND of shChk1/shScramble‐transduced HCT116 cells, treated for 1 h with 10 μM roscovitine. The lower panel shows a DNA fiber assay done under the same conditions as the iPOND. 157 (shScr) and 180 (shChk1 ± Rosc) fibers obtained from two independent experiments were measured for each condition.
- Western blot of Polη in siChk1/siLuc‐transfected U2OS cells, treated for 1 h with 15 μM roscovitine or DMSO. A 30‐s extraction with CSK buffer was used to separate the insoluble and soluble fractions. Actin was used as a loading control.
In agreement with reduced rates of replication barrier bypass, GFP‐Polη‐S687D presented a reduced ability to form foci, sites of GFP‐Polη activity in vivo (Kannouche et al, 2001), after a mild extraction with CSK buffer, which removes proteins unbound to chromatin. This was unveiled by measuring the percentage of cells with foci (Fig EV3B) and the number of foci per cell (Fig 4E and F). iPOND (Fig EV3C) and Western blot of insoluble cellular fractions (Fig EV3D) showed that enrichment of Polη at forks in Chk1‐deficient cells is unaffected by roscovitine. Taken together, these results demonstrate that CDK‐dependent phosphorylation of Polη‐S687 represses Polη‐dependent fork elongation (and not Polη recruitment to ongoing forks) in Chk1‐depleted cells (Fig 4G). Furthermore, these data imply that high CDK activity in Chk1‐depleted cells impacts on fork elongation and origin firing by divergent pathways.
Replication fork progression and origin firing are independent variables in Chk1‐deficient cells
CDK activity stimulates DNA replication initiation in Chk1‐deficient cells (Sorensen & Syljuasen, 2012; Gonzalez Besteiro & Gottifredi, 2015). Upon Chk1 loss, the CDK inhibitor roscovitine restores not only origin firing levels, but also fork elongation rates (Petermann et al, 2010); thus, the current model proposes that CDK‐dependent excess origin firing reduces DNA replication rates (Sorensen & Syljuasen, 2012). However, our data show that a reduction in origin firing is insufficient to revert reduced fork elongation rates (Fig 3) and thus challenge this model. To get more insight into the relationship between origin firing levels and fork elongation rates in Chk1‐deficient cells, we tested if the inhibition of origin firing by means other than roscovitine also reduces DNA elongation rates. We chose CDC7, an essential activator of DNA replication initiation, and CDT1, an origin licensing factor (Yekezare et al, 2013). The depletion of either protein has proven to efficiently reduce excessive origin firing (Petermann et al, 2010; Beck et al, 2012). In fact, CDC7 downregulation or inhibition in Chk1‐depleted U2OS cells normalized origin firing levels. Remarkably however, such reduction in origin firing did not correlate with increased fork progression (Fig 5A and Appendix Fig S5), in contrast to the effect of roscovitine, which controls both variables (Fig 3). In full agreement, CDT1 downregulation, while rescuing exacerbated origin firing in Chk1‐depleted cells, had no impact on fork elongation (Fig 5B). Importantly, CDT1 downregulation per se is no impediment to fork elongation (Appendix Fig S6A and B) and, in agreement with (Beck et al, 2012), alleviated slow replication fork progression in cells lacking WEE1, another CDK regulator (Appendix Fig S6C). Our data thus imply that excess origin firing does not alter fork progression rates in Chk1‐depleted cells. It is also plausible that slow elongation rates impact on origin firing levels (Techer et al, 2016). However, variables such as NS and GFP‐Polη overexpression, while rescuing impaired fork elongation in a manner that depends on Polη expression, had no impact on origin firing (Fig 5C and D). Altogether, Chk1 controls fork elongation and origin firing by independent mechanisms, albeit both are CDK‐dependent (Fig 6A).
Figure 5. Replication fork progression and origin firing are independent variables in Chk1‐depleted cells.
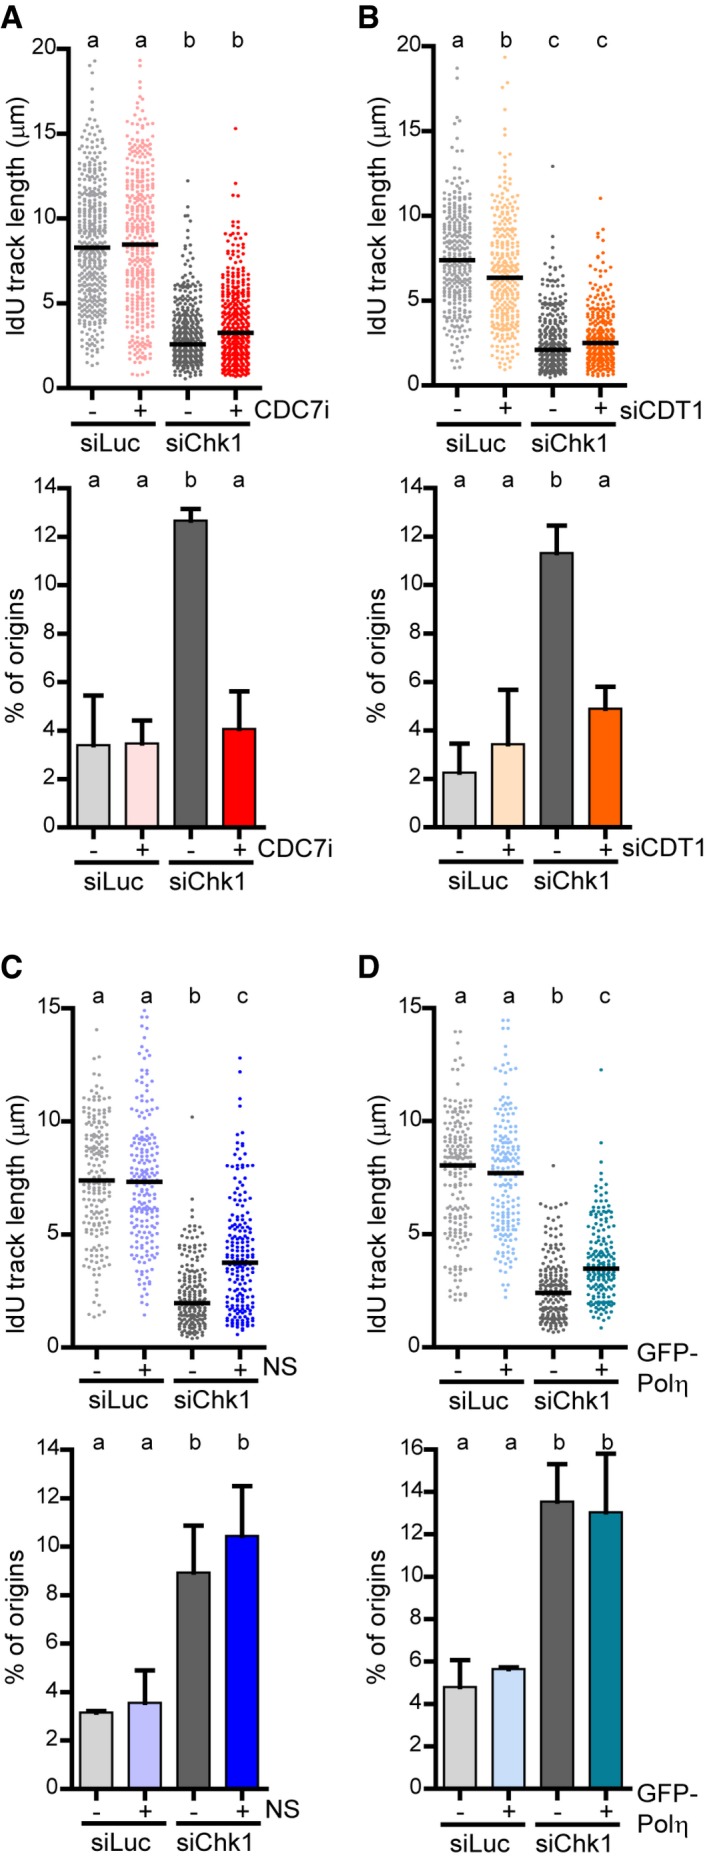
- IdU track lengths and percentage of origin firing (mean ± SD) from U2OS cells treated or not with a CDC7 inhibitor (CDC7i). > 380 (track length) and > 600 (origin frequency) fibers obtained from 4 (track length) or 3 (origin frequency) independent experiments were measured for each condition.
- IdU track lengths and percentage of origin firing (mean ± SD) from U2OS cells transfected or not with siCDT1. Track lengths from > 290 fibers obtained from three independent experiments were measured for each condition. To calculate origin frequency, > 700 DNA fibers from three independent experiments were scored.
- IdU track lengths and percentage of origin firing (mean ± SD) from U2OS cells supplemented or not with nucleosides (NS). > 195 (track length) and > 350 (origin frequency) fibers obtained from two independent experiments were measured for each condition.
- IdU track lengths and percentage of origin firing (mean ± SD) from U2OS cells transfected or not with GFP‐Polη. > 180 (track length) and > 400 (origin frequency) DNA fibers obtained from 2 independent experiments were measured for each condition.
Figure 6. Replication barrier bypass in Chk1‐deficient cells does not alleviate DNA damage.
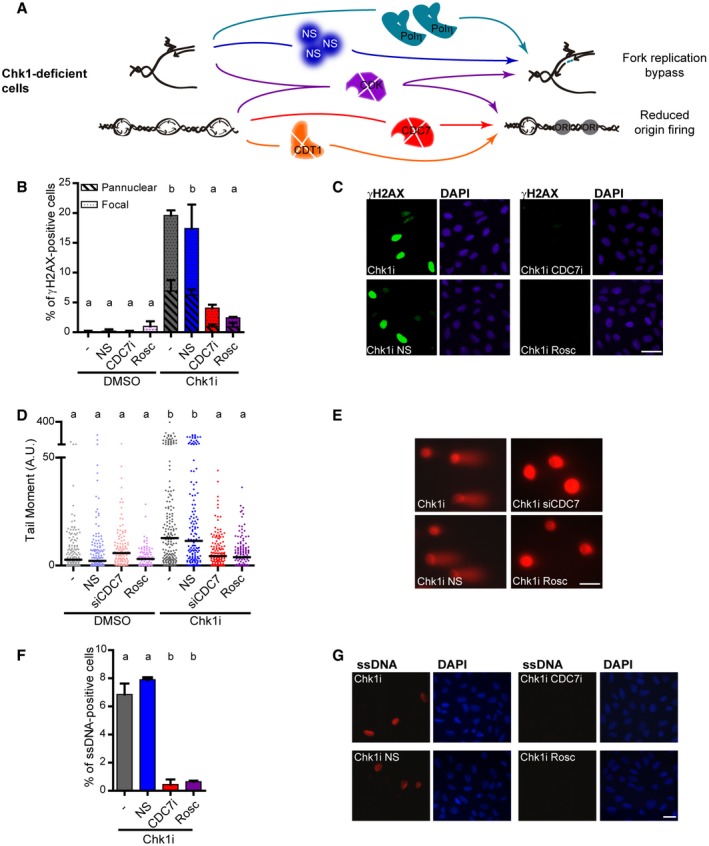
- Scheme of the tools used to revert DNA replication phenotypes caused by Chk1 deficiency. CDK inhibition rescues impaired fork elongation and excess origin firing; NS supplementation or GFP‐Polη overexpression specifically rescues reduced fork elongation; CDT1 depletion or CDC7 depletion/inhibition specifically rescues excess origin firing.
- Percentage of γH2AX‐positive U2OS cells (mean ± SD) after 5‐h treatment with the Chk1 inhibitor Gö6976 (Chk1i), in the presence of 5 μM NS, 1.25 μM CDC7i, or 10 μM roscovitine. > 900 (DMSO) or > 2,000 (Chk1i) cells/sample were analyzed in two independent experiments. Total γH2AX was used to perform the statistics.
- Representative images of data shown in (B). Scale bar: 50 μm.
- DSB accumulation measured by neutral comet assay after 8‐h treatment with Chk1i, in the presence of 5 μM NS, siCDC7, or 10 μM roscovitine. 85–170 cells/sample were analyzed in two independent experiments.
- Representative images of data shown in (D). Scale bar: 25 μm.
- Percentage of parental ssDNA‐positive U2OS cells (mean ± SD) after 5‐h treatment with Chk1i, in the presence of 5 μM NS, 1.25 μM CDC7i, or 10 μM roscovitine. > 450 cells/sample were analyzed in two independent experiments. The induction of ssDNA on control samples was null.
- Representative images of data shown in (F). Scale bar: 25 μm.
Excess origin firing, not reduced fork elongation, triggers DNA damage in Chk1‐deficient cells
Because excess origin firing and reduced fork elongation are separate variables in Chk1‐deficient cells, they might differentially impact on biological relevant parameters. While characterizing the DNA replication choreography in Chk1‐depleted cells, we have developed an array of tools that specifically restore fork elongation or origin firing. CDT1/CDC7 depletion/inhibition and NS supplementation or GFP‐Polη overexpression were used to unambiguously assess the biological relevance of dysregulated origin firing and fork elongation, respectively. Roscovitine, which restores fork elongation and origin firing phenotypes, was used as a control (Fig 6A).
In U2OS cells, Chk1 loss induces the accumulation of the DNA damage marker γH2AX (Syljuasen et al, 2005; Sanjiv et al, 2016). Consistent with its holistic control of DNA replication, roscovitine reverted the accumulation of γH2AX in Chk1‐inhibited cells. However, NS supplementation did not restore γH2AX levels in Chk1‐inhibited cells (Fig 6B and C). Also, GFP‐Polη delivery by lentiviral transduction, which guarantees more homogenous and widespread expression than transfections, did not alter γH2AX levels in Chk1‐deficient cells (Fig EV4A–C). Maya‐Mendoza et al (2018) recently proposed that fork deceleration beyond 20% induces DNA damage. In Chk1‐depleted U2OS cells, even if supplemented with NS or transfected with GFP‐Polη, fork velocity reaches at most 50% of the normal speed (Fig 5C and D). It could then be argued that such a limited rescue of fork elongation is not sufficient to unveil the potential impact of fork speed on DNA damage accumulation. To address this issue, we titrated replication fork speed by expression of increasing amounts of Chk1 and monitored γH2AX accumulation. Interestingly, low levels of exogenous Chk1 rescued origin firing fully and restored γH2AX levels almost fully. In contrast, fork elongation was only modestly rescued by low Chk1 expression levels (Fig EV4D–F). Therefore, when compared to the relevance of excessive origin firing, the contribution of fork speed to γH2AX accumulation is minor. Moreover, the overexpression of GFP‐Polη from a lentivirus in cells depleted of Chk1 accelerated fork speed beyond 80% of normal speed and still did not reduce γH2AX accumulation (Fig EV4A–C). In conclusion, we have found no evidence that impaired fork elongation in Chk1‐deficient cells contributes to increasing DNA damage levels.
Figure EV4. Replication barrier bypass in Chk1‐deficient cells does not alleviate DNA damage.
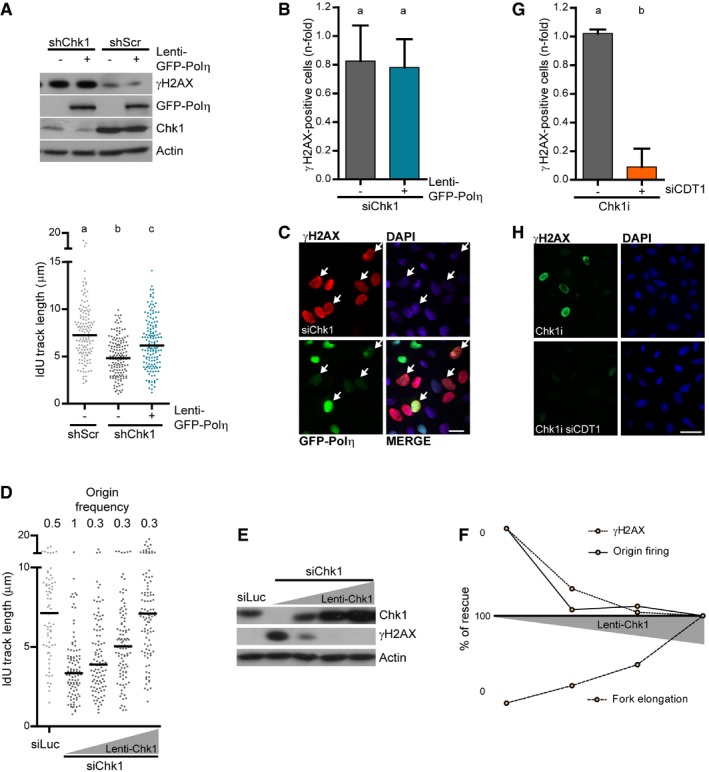
- Western blot of γH2AX, GFP‐Polη, and Chk1 in U2OS cells, 48 h after transduction with shRNA and Lenti‐GFP‐Polη or Lenti‐GFP (−). Actin was used as a loading control. The lower panel shows a DNA fiber assay performed under the same conditions as the Western blot. > 140 fibers obtained from two independent experiments were measured for each condition.
- Quantification of pannuclear γH2AX‐positive U2OS cells (mean ± SD), transduced with Lenti‐GFP‐Polη and transfected with siChk1. > 900 cells/sample were analyzed in two independent experiments.
- Representative images of data shown in (B). White arrows indicate cells that accumulate γH2AX even if GFP‐Polη is expressed. Scale bar: 25 μm.
- IdU track length and frequency of origin firing in Chk1‐depleted U2OS cells transduced with increasing amounts of a lentivirus carrying the Chk1‐WT (wild‐type) sequence. A representative experiment is shown (n = 2). 100 (track length) and > 230 (origin frequency) DNA fibers were scored.
- Western blot of Chk1 and γH2AX of samples in (D). Actin was used as loading control.
- Percentage of rescue of fork elongation, origin firing, and γH2AX against the amount of exogenous Chk1 protein, calculated from data in (D–E).
- Quantification of pannuclear γH2AX‐positive U2OS cells (mean ± SD), transfected with siLuc or siCDT1, and treated 5 h with Chk1i. > 450 cells/sample were analyzed in two independent experiments.
- Representative images of data shown in (G). Scale bar: 50 μm.
In contrast to the null effect of fork elongation defects on γH2AX accumulation, restoring origin firing levels by CDC7 inhibition (Fig 6B and C) or CDT1 depletion (Fig EV4G and H) rescued Chk1i‐induced γH2AX accumulation. In full agreement, CDC7 inactivation, not NS supplementation, circumvented DSB (Fig 6D and E) and ssDNA accumulation (Fig 6F and G), a marker of replication stress and commitment to cell death (Toledo et al, 2013; Buisson et al, 2015). Importantly, CDC7 inhibition did not noticeably modify the percentage of cells in S phase (Appendix Fig S7), arguing against a potential indirect effect of cell cycle alterations on S phase replication markers. Altogether, these results demonstrate that excess origin firing, not reduced fork elongation, damages DNA in Chk1‐deficient cells.
Excess origin firing and CDC45/MCM2‐dependent replication barriers compromise fitness of Chk1‐deficient cells
Even if roscovitine fully abrogated DNA damage in Chk1‐depleted U2OS cells, the roscovitine effect on survival assays was invariably modest (Fig 7A). We ascribe such rescue to roscovitine‐mediated normalization of origin firing levels, because Polη downregulation, which abolishes roscovitine‐dependent rescue of fork speed, did not compromise roscovitine‐dependent rescue of cell survival upon Chk1 inhibition (Fig 7A). This suggests that Polη‐mediated replication fork bypass is irrelevant to cell survival. In fact, growth of Chk1‐inhibited cells was unaffected by GFP‐Polη overexpression (Fig 7B and Appendix Fig S8A) or NS supplementation, which restores fork progression in a Polη‐dependent manner (Appendix Fig S8B). We reasoned that increasing fork elongation rates in a Polη‐independent manner, by impeding the formation of the obstacles that recruit Polη, might be the key to improving cellular fitness of Chk1‐deficient cells. CDC45 is a helicase cofactor whose increased loading onto chromatin following treatment with Chk1 and replication inhibitors triggers apoptosis in HCT116 cells (Syljuasen et al, 2005; Rodriguez et al, 2008; Zuazua‐Villar et al, 2015). CDC45 excess provokes fork asymmetry (Srinivasan et al, 2013; Kohler et al, 2016) and Polη recruitment to replication foci (Kurashima et al, 2018); surplus CDC45 might therefore generate the obstacles that block the replisome in Chk1‐depleted cells. In support of this hypothesis, chromatin‐bound levels of CDC45 increased in Chk1‐depleted cells, independently of roscovitine, which in fact functions downstream of replication barrier formation according to our model (Fig 8A). Moreover, CDC45 abrogation restored fork elongation rates independently of Polη and showed an epistatic relationship with roscovitine (Fig 8B and C). Similar results were obtained by downregulation of other helicase component, MCM2, even if we did not observe an enrichment of MCM2 in the chromatin fraction of Chk1‐depleted cells (Fig EV5A and B). Thus, CDC45/MCM2 downregulation promotes Polη‐independent fork elongation and restores origin firing levels (Figs 8C and D, and EV5B and C), in contrast to roscovitine, which similarly normalizes origin firing levels, but promotes Polη‐dependent fork elongation (Fig 3B and C). Remarkably, CDC45 downregulation fully restored the proliferation rates of Chk1‐depleted U2OS cells (Fig 8E and F, and Appendix S8C), while the effect of roscovitine was only partial (Fig 8G and H, and Appendix Fig S8D). Similarly, MCM2 downregulation improved survival of Chk1‐depleted U2OS cells to a greater extent than roscovitine (Fig EV5D). In HCT116 cells, CDC45 depletion improved the growth of Chk1‐deficient cells (Appendix Fig S8E), while the rescue by roscovitine remained undetectable (Appendix Fig S8F). We conclude that excess new origin firing and the accumulation of replication barriers compromise the proliferation of Chk1‐inactivated cells (Fig 9A and B).
Figure 7. Replication barrier bypass in Chk1‐deficient cells does not ameliorate cellular fitness.
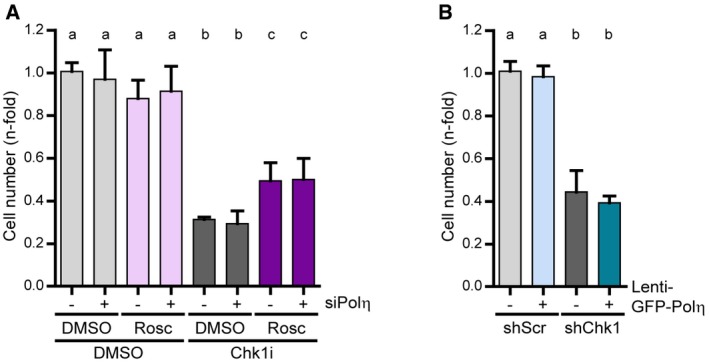
- Sensitivity of U2OS cells to Chk1 inhibition, roscovitine (5 μM), and Polη depletion. Cell number was determined 4 days after a 24‐h treatment (5 days in total) with Chk1i ± Rosc. Data represent the mean (± SD) of three independent experiments.
- Sensitivity of U2OS cells transduced with shRNA targeting Chk1 (shChk1) or non‐targeting shRNA (shScr) and Lenti‐GFP‐Polη or Lenti‐GFP (−). Cell number was determined 7 days after transduction (5 days after maximal downregulation). Data represent the mean (± SD) of three independent experiments.
Figure 8. CDC45‐dependent generation of replication barriers compromise the fitness of Chk1‐deficient cells.
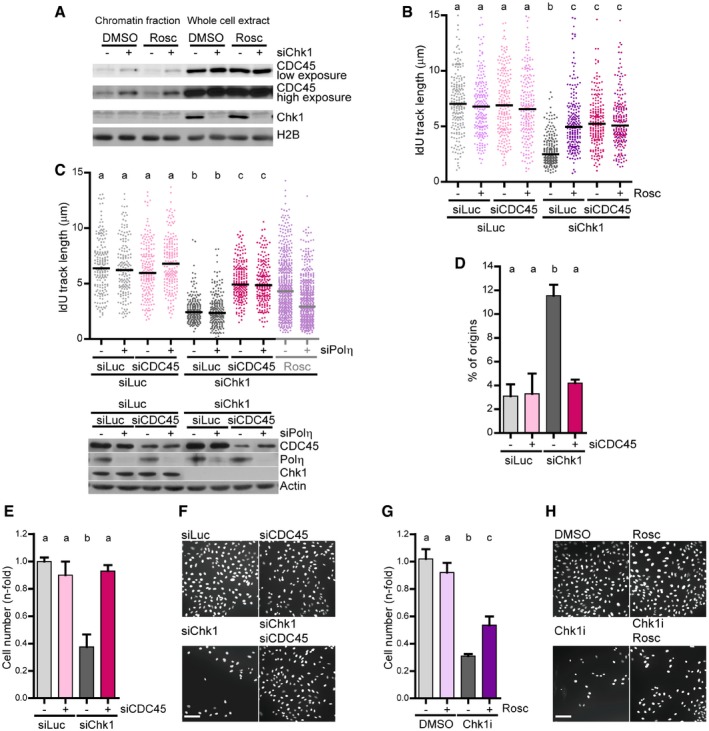
- Western blot of CDC45 and Chk1 in U2OS cells after an extraction with CSK buffer to separate the insoluble and soluble fractions. Roscovitine (25 μM) was added 2 h before harvesting. H2B was used as a loading control.
- IdU track lengths from U2OS cells. 200 DNA fibers obtained from two independent experiments were measured for each condition.
- IdU track lengths from U2OS cells. > 170 DNA fibers obtained from two independent experiments were measured for each condition. For comparison, the data showing that Polη is required for roscovitine‐dependent rescue of fork elongation in Chk1‐depleted cells (Fig 3B) are shown on the right. The lower panel shows the corresponding Western blot of Chk1, Polη, and CDC45. Actin was used as a loading control.
- Percentage of origin firing (mean ± SD) from DNA fibers in C (n = 2). > 490 fibers per condition were scored.
- Sensitivity of U2OS cells to Chk1 and CDC45 depletion. Cell number was determined 7 days after transfection (5 days after maximal downregulation). Data represent the mean (± SD) of two independent experiments.
- Representative image of data shown in (E). Scale bar: 100 μm.
- Sensitivity of U2OS cells to Chk1 inhibition and roscovitine (5 μM). Cell number was determined 4 days after a 24‐h treatment (5 days in total) with Chk1i ± Rosc. Data represent the mean (± SD) of two independent experiments.
- Representative image of data shown in (G). Scale bar: 100 μm.
Figure EV5. MCM2‐dependent generation of replication barriers compromise the fitness of Chk1‐deficient cells.
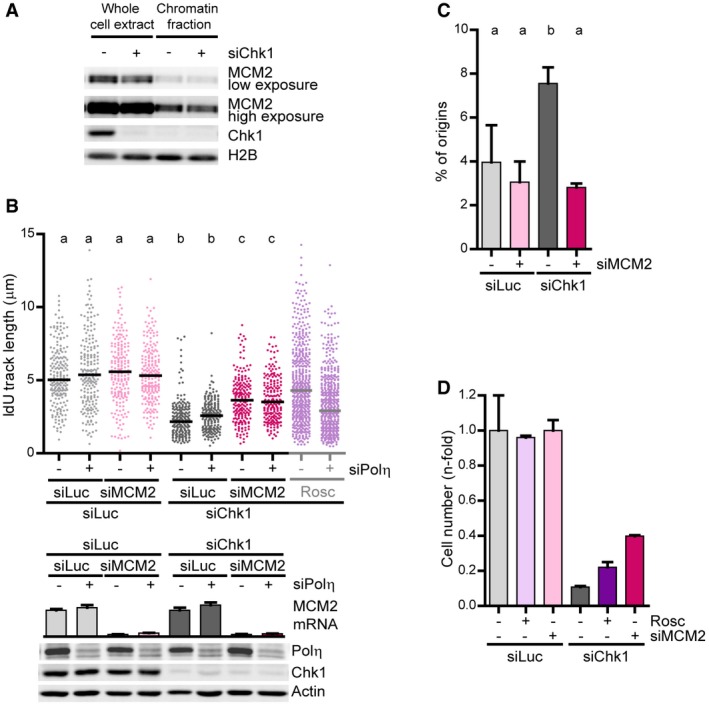
- Western blot of MCM2 and Chk1 in U2OS cells after an extraction with CSK buffer to separate the insoluble and soluble fractions. H2B was used as a loading control.
- IdU track lengths from U2OS cells. 200 DNA fibers obtained from two independent experiments were measured for each condition. For comparison, the data showing that Polη is required for roscovitine‐dependent rescue of fork elongation in Chk1‐depleted cells (Fig 3B) are shown on the right. The lower panel shows the corresponding Western blot of Chk1 and Polη (actin was used as a loading control) and quantitative real‐time PCR of MCM2 normalized to GAPDH (error bars represent the SD of 2 technical replicates).
- Percentage of origin firing (mean ± SD) from DNA fibers in (B) (n = 2). > 700 fibers per condition were scored.
- Sensitivity of U2OS cells to Chk1 and MCM2 depletion. Cell number was determined 7 days after transfection (5 days after maximal downregulation). A representative experiment is shown (n = 2). Error bars represent the SD of three technical replicates.
Figure 9. Proposed models on Chk1‐dependent control of DNA replication and its effect on cell proliferation.
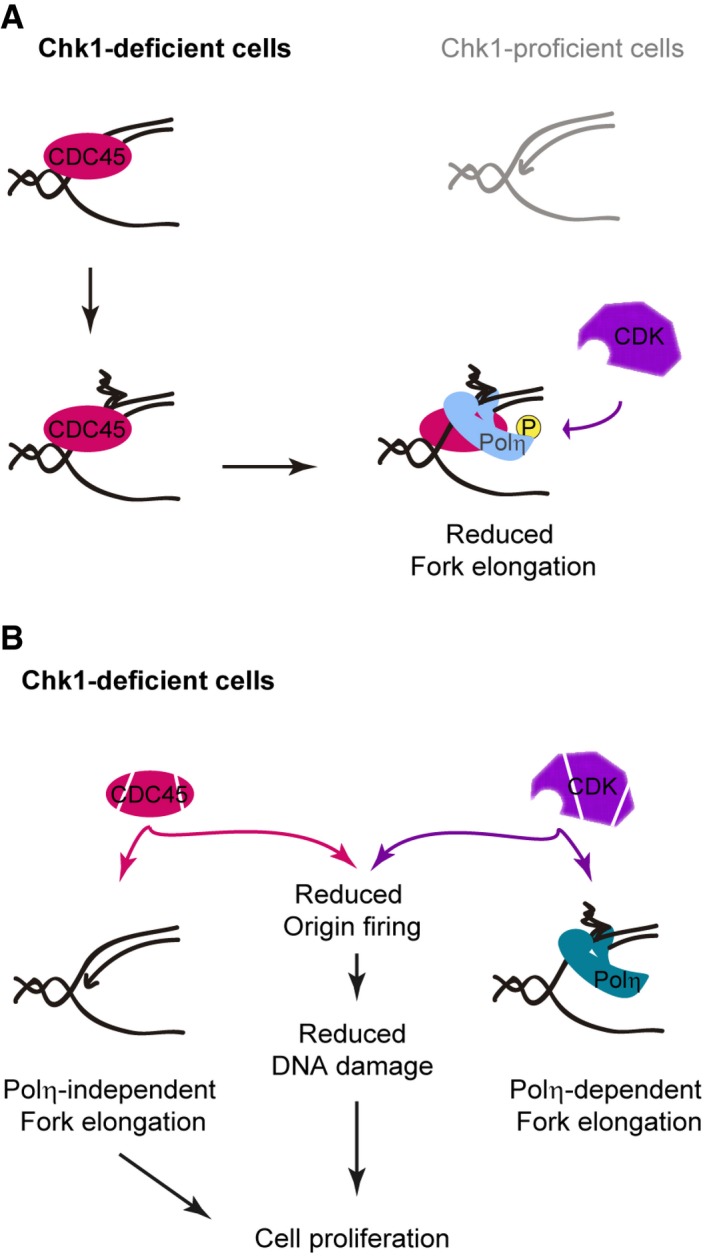
- Model in which excess CDC45 creates replication barriers in Chk1‐deficient cells. These barriers recruit Polη, which remains inactive due to CDK‐mediated phosphorylation.
- Model in which reduced origin firing and Polη‐independent increased fork elongation promote proliferation in Chk1‐deficient cells.
Discussion
This work provides an insightful analysis of the replication dynamics in Chk1‐deficient cells. We describe an unprecedented mechanism limiting fork elongation in the absence of Chk1: high CDK activity restricts Polη‐dependent bypass of replication barriers, which are created by excessive loading of helicase components. Additionally, we demonstrate that fork elongation and origin firing are independent players of the DNA replication program, which govern the different outcomes of replication stress. While origin usage determines the DNA damage load and the proliferation of Chk1‐depleted cells, the formation of replication barriers, but not their bypass, impacts exclusively on the proliferation rates.
Chk1 loss creates replication barriers
Although our data conclusively demonstrate that Chk1 loss prompts unsteady replication fork progression, i.e., fork asymmetry, others have rejected this hypothesis (Koundrioukoff et al, 2013; Techer et al, 2016). In those reports, conclusions were based on 20‐min CldU/20‐min IdU ratios. Using this labeling scheme, we were also unable to detect fork asymmetry in Chk1‐depleted cells. DNA combing (20‐min CldU + 20‐min IdU) and also alternative labeling protocols (10‐min CldU + 30‐min IdU and 10‐min CldU + 10–80‐min IdU) did unveil the occurrence of asymmetric forks in Chk1‐deficient cells. Our research (this report and Vallerga et al, 2015) thus highlights the importance of exploiting the DNA fiber analysis beyond the conventional protocols to shed light on key aspects of DNA replication.
Because the specialized polymerase Polη can alleviate fork progression defects of Chk1‐depleted cells, replication barriers might lie at the heart of the problem. Polη is able to separate non‐B DNA (Biertumpfel et al, 2010) and efficiently replicates DNA that adopts secondary structures characteristic of difficult‐to‐replicate genomic regions (Bergoglio et al, 2013; Garcia‐Exposito et al, 2016). The DNA fiber assay unveils replication defects at a global scale, rather than at such specific regions in the genome. Thus, our observation that Polη overexpression alleviates slow elongation in Chk1‐deficient cells implies the presence of replication barriers all along the genome.
Our data also show that excess CDC45/MCM2, but not high CDK activity, contributes to the generation of the replication intermediates that recruit Polη in Chk1‐depleted cells. CDK activity controls the number of replication factories rather than the origins within them (Thomson et al, 2010), while CDC45 activates dormant origins (Wong et al, 2011). Thus, replication barriers in Chk1‐depleted samples may be related to increased proximity between neighbor activated origins within a cluster. Supporting the potential influence of CDC45 expression levels in the generation of DNA replication barriers are two reports indicating that the sole overexpression of CDC45 causes fork asymmetry (Srinivasan et al, 2013; Kohler et al, 2016). In an alternative scenario, excess loading of helicase complexes might itself constitute the obstacle to replication in Chk1‐deficient cells. However, the fact that MCM2 levels at chromatin are not increased in Chk1‐deficient cells favors the first explanation.
Replication fork progression in Chk1‐deficient cells is hampered by TLS inhibition and other signals
Chk1 loss activates CDK2 in S phase (Sakurikar et al, 2016) and CDK2 phosphorylates Polη at serine 687 in vitro and in vivo, even in the absence of DNA damage (Dai et al, 2016; Bertoletti et al, 2017). In agreement with PCNA–Polη interaction in vitro data (Bertoletti et al, 2017), our iPOND analysis shows that phosphorylation does not control Polη recruitment to replication forks. We thus favor the hypothesis that CDK2‐mediated Polη phosphorylation at S687 regulates the bypass of replication obstacles. The outcome may vary depending on the obstacle: negative after Chk1 loss but positive after UV irradiation (Dai et al, 2016; Bertoletti et al, 2017). Thus, rather than controlling Polη catalytic activity (Bertoletti et al, 2017), S687 phosphorylation status might articulate with other signals to tailor Polη ability to bypass a given replication barrier to suit a particular cellular context.
In line with CDK‐ and NS‐dependent control of Polη‐dependent tolerance, roscovitine and NS supplementation reverted fork asymmetry in Chk1‐depleted cells. However, fork elongation was only partially restored. Such observations indicate that fork elongation in Chk1‐deficient cells is not exclusively hampered by replication barriers, but is most likely also governed by other variables, independent from TLS. While our data rule out the contribution of R‐loops, MUS81‐dependent DSBs, which accumulate upon Chk1 loss (Forment et al, 2011; Murfuni et al, 2013), Mre11‐dependent degradation and surplus converging forks to the replication defects of Chk1‐depleted U2OS cells, they suggest an increase in fork reversal. Fork reversal might occur after the collision of replication forks with the barriers created by Chk1 loss; alternatively, reversed forks themselves might constitute the replication barriers. In any case, the contribution of fork reversal to replication speed was modest. Thus, we speculate that other as‐yet‐unidentified transactions determine fork progression rates in Chk1‐deficient cells.
Origin firing and replication fork elongation are uncoupled in Chk1‐deficient cells
Origin firing and fork progression influence each other (Anglana et al, 2003; Zhong et al, 2013). Thus, manipulation of origin firing levels will invariably affect fork speed and vice versa, unless such intervention is somehow restricted (Rodriguez‐Acebes et al, 2018). In fact, Techer et al (2016) have reported that NS supplementation rescues excess origin firing in Chk1‐depleted JEFF cells. However, we could not reproduce such a scenario in U2OS cells. This inconsistency might be explained by the fold reduction in replication speed achieved by Chk1 inhibition. If fork speed is profoundly affected by Chk1 depletion (this study), NS supplementation might not suffice to revert excessive origin usage. Hence, the dependence of origin firing on fork progression after Chk1 depletion is not strict. In a similar fashion, we have found conditions in which excessive origin firing is reverted without changes in fork speed. Our model of modest feedback between fork speed and origin firing is further supported by our Chk1 titration experiment that demonstrates that normalizing origin firing levels does not notoriously alleviate fork elongation defects. Others have proposed that, in the context of Chk1 depletion, fork progression is restricted by the exhaustion of resources needed for DNA polymerization, which supposedly follows excess origin firing (Petermann et al, 2010; Sorensen & Syljuasen, 2012). However, this model is in contradiction to two facts: (i) Fork elongation in Chk1‐depleted cells is modulated by CDK‐dependent phosphorylation of Polη; (ii) GFP‐Polη elongates forks, even in face of surplus DNA initiation and restricted resources, presumably characteristic of Chk1‐deficient cells. Together, our results show that the invariable association between origin firing and fork speed that has been previously postulated is not a general rule and does not hold in the context of Chk1 inactivation.
Fitness of Chk1‐deficient cells is multifactorial
It is becoming increasingly clear that sensitivity to Chk1 inhibitors is a consequence of DNA damage in S phase (Koh et al, 2015; Parsels et al, 2016; Sakurikar et al, 2016; Sanjiv et al, 2016; Techer et al, 2016; Wayne et al, 2016). Our work complements these findings, by defining excess origin firing as the predominant mechanism that causes such DNA damage. Consistent with previous reports (Beck et al, 2012; Techer et al, 2016), and in contrast to another (Maya‐Mendoza et al, 2018), we found no causal connection between fork speed and DNA damage in Chk1‐deficient cells. Perhaps these differences indicate that general rules cannot be applied, as cellular responses are very much influenced by the genetic background. In any case, it is really puzzling to have identified a scenario in which DNA damage is totally reverted by repressing excessive origin firing but without notoriously accelerating fork progression. Yekezare et al (2013) have suggested that origin firing frequency provides information about the number of active factories, rather than the origins within them. Moreover, Chk1 blocks new factories but promotes dormant origin firing (Ge & Blow, 2010). We thus propose that the homeostasis of DNA replication is more sensitive to changes in DNA replication choreography than to the average speed of nascent DNA elongation. If this is the case, replication speed variations could be easily buffered as far as the factories fire in the correct order.
In addition to unscheduled origin firing, the accumulation of replication barriers compromises cell growth. Upon Chk1 loss, the difference between roscovitine and CDC45/MCM2 depletion is the quality, not the speed, of DNA elongation (with obstacles being bypassed by Polη and without obstacles, respectively). Thus, the accumulation of barriers in Chk1‐deficient cells negatively affects proliferation rates, independently of whether they are tolerated or not. This is intriguing since TLS prevents breaks at naturally occurring structured DNA (Betous et al, 2009) and enhances survival in cells displaying high CDK activity (Yang et al, 2017) or Myc‐induced replication stress (Kurashima et al, 2018). We envision that, depending on the DNA template and the cellular context, specialized polymerases might contribute to cell growth in unpredictable ways. Our observations are against a simple, universal relationship between fork speed and DNA damage and/or cell proliferation.
Materials and Methods
Cell culture and chemicals
U2OS (ATCC), HEK293T (a gift from A Schinder, FIL), and HCT116 p21+/+ (a gift from B Vogelstein, Johns Hopkins University, Baltimore) were grown in Dulbecco's modified Eagle's medium (Invitrogen) with 10% fetal calf serum (Natocor). For DNA fibers assays, the Chk1 inhibitor Gö6976 (Calbiochem, 1 μM), roscovitine (Sigma, 25 μM), the CDC7 inhibitor PHA‐767491 (Selleckchem, 5 μM), nucleosides (Sigma, 5 μM each), 5,6‐Dichloro‐1‐β‐D‐ribofuranosyl‐benzimidazole (DRB, Sigma, 100 μM), Olaparib (Selleckchem, 10 μM), and mirin (Tocris Bioscience, 100 μM) were added before the first pulse for 1.5, 1, 3, 0.5, 1, 1.5, and 0.5 h, respectively. All inhibitors were additionally maintained during both pulses. For survival assays, cells were incubated for 24 h with Gö6976 1 μM and/or roscovitine 2.5–5 μM or nucleosides 5 μM each. For other assays, chemicals were used as specified below or in the figures legends.
siRNAs and expression plasmids
Transfections of siRNAs and/or plasmids were performed using Jet Prime (Polyplus) according to the manufacturer′s instructions. Except from cell survival assays, cells were harvested 48 h after transfection with siRNA and 24 h after transfection with expression plasmids. GFP‐Polη was a gift from Dr. A. Lehmann (Kannouche et al, 2001). GFP‐Polη was mutated by site‐directed mutagenesis as described in the Appendix. siRNA sequences are listed in the Appendix.
Lentiviral plasmids, production, and infection
pLenti‐GFP‐Polη and pLKO.1‐shScramble were gifts from G Soria (Villafanez et al, 2019). Chk1‐WT (Speroni et al, 2012) was cloned into the lentiviral transfer plasmid pLenti CMV/TO Puro (Addgene #17482) using BamHI and XbaI. The shRNA insert (Peng et al, 2014) was cloned into the lentiviral transfer plasmid pLKO.1 (Addgene #8453) following manufacturer's instructions. Lentivirus production and infection was conducted exactly as previously described (Mansilla et al, 2016). When transfection was required, cells were infected 5 h after transfection.
Extraction of soluble proteins
Cells were incubated with ice cold CSK buffer (10 mM Pipes pH 7.5, 100 mM NaCl, 300 mM sucrose, 1 mM EGTA, 3 mM MgCl2) containing Triton X‐100. For Western blot analysis of chromatin‐bound proteins, extraction time and Triton concentration were as follows: 30–60 s and 0.5% for Polη, 2 min and 2% for CDC45 and MCM2. Prior to protein harvest, cells were washed once with cold CSK buffer without Triton to avoid contamination of the insoluble fraction with soluble proteins. For microscopy analysis of GFP‐Polη foci, extraction time was 15 s and Triton concentration was 0.5%.
Western blot
Cells were lysed and harvested with Laemmli buffer, followed by an 8‐min incubation at 99°C. The primary antibodies are listed in the Appendix. Incubation with secondary antibodies (Jackson ImmunoResearch) and ECL detection (Amersham GE Healthcare) was performed according to the manufacturer's instructions. Western blot images were taken with Image QuantTM LAS4000 (GE Healthcare), which allows capture and quantification of images within a linear range. Alternatively, X‐ray films were used.
Immunostaining and microscopy
Immunodetection of γH2AX and BrdU was conducted exactly as previously described (Vallerga et al, 2015). GFP‐Polη was detected by auto‐fluorescence after fixation with 2% paraformaldehyde/sucrose. For detection of single‐stranded DNA (ssDNA) in parental DNA, cells were incubated with 10 μM BrdU for 36 h, treated as indicated, and fixed with 2% paraformaldehyde/sucrose. Nuclei were stained with DAPI (Sigma). Images were acquired with a Zeiss LSM 510 confocal microscope and processed with ImageJ software.
DNA fiber spreading and combing
DNA fiber spreading was performed as previously described (Speroni et al, 2012); ~100 DNA fibers were measured per sample per experiment. CldU (20 μM) was pulsed first and immediately followed by an IdU (200 μM) pulse; unless otherwise specified in figures legends, each analogue pulse lasted 20 min. The bars on top of the distribution clouds indicate the median. Percentage of origins (shown as mean ± SD) was calculated as the percentage of IdU‐CldU‐IdU and only IdU tracks over the total number of forks. Percentage of terminations (shown as mean ± SD) was calculated as the percentage of CIdU‐ldU‐CIdU tracks over the total number of forks. For DNA combing, HCT116 cells were labeled with IdU (50 μM) and CldU (100 μM) for 20 min each. Plugs (50,000 cells each) were prepared with the FiberPrep DNA Extraction Kit (Genomic Vision) according to the manufacturer′s instructions. DNA was combed on silanized coverslips (Genomic Vision) and baked at 65°C for 2–4 h. DNA was denatured (NaOH 0.5 M, NaCl 1 M) for 8 min with gentle agitation; slides were dehydrated by sequential 1‐min incubations with 70–90–100% ethanol. After drying, samples were blocked in 1× PBS, 1% BSA, 0.5% Tween‐20 for 15 min. IdU and CldU were simultaneously detected with mouse anti‐BrdU (Becton Dickinson, 1:6) and goat anti‐mouse Alexa 488 (Invitrogen, 1:25) or rat anti‐BrdU (Seralab, 1:10) and donkey anti‐rat Alexa 633 (Invitrogen, 1:25), respectively. ssDNA was detected with mouse anti‐ssDNA (Millipore, MAB3034, 1:4) and goat anti‐mouse Alexa 555 (Invitrogen, 1:25). All antibodies were diluted in blocking solution, incubations were done in a humid chamber at 37°C for 2 (primary antibodies) or 0.5 (secondary antibodies) h, and three washes of 5 min each in 1× PBS, 0.05% Tween‐20 were performed after each antibody incubation. Slides were dehydrated before mounting with Prolonged Diamond Antifade Mountant (Invitrogen). Images were acquired with a Nikon Eclipse Ni microscope, equipped with a DS‐Qi2 camera, and processed using NIS Elements Software (Nikon). ~60 DNA fibers were measured per sample per experiment.
iPOND
HCT116 cells were seeded on 100‐mm dishes (one per condition) and transduced 24 h later with shScramble or shChk1. Cells were split on four 150‐mm dishes 24 h after transduction and subjected to iPOND 72 h later, when they reached ~80% confluence. iPOND was performed as described in Sirbu et al (2012). Briefly, 1 h after treatment with DMSO or roscovitine (10 μM) cells was labeled with 10 μM EdU (Life Technologies) for 15 min. For chase samples, EdU was replaced by 10 μM thymidine (Sigma) and incubated for 45 min. Cross‐linking was performed with 0.2% formaldehyde (Sigma) in PBS for 15 min and quenched with 0.125 M glycine. Cells were permeabilized with 0.25% Triton X‐100 in PBS at RT for 30 min. Click reaction was conducted at RT for 2 h in PBS containing 10 μM azide‐PEG3‐biotin (Sigma), 10 mM sodium ascorbate (Sigma) and 2 mM CuSO4 (Fisher). Cells were washed and lysed in 1 ml lysis buffer (1% SDS in 50 mM Tris pH 8.0) containing leupeptin and aprotinin (Sigma). Sonication was carried out in a Bioruptor UCD‐200 (Diagenode) until the solution was clear (high power, 8x[20 s constant pulse, 40 s pause]). After centrifugation, biotin‐tagged DNA was captured with 50 μl (packed volume) of Streptavidin agarose (Novagen) at 4°C overnight. After washing the beads, proteins were eluted by boiling in 2× SDS Laemmli buffer. 0.2% of the input and the whole iPOND fraction were loaded on standard SDS–PAGE gels, resolved, and analyzed by immunoblotting.
Neutral comet assay
U2OS cells were treated with Gö6976 1 μM (8 h), nucleosides 5 μM (8 h), and roscovitine 10 μM (first 5 h) 48 h after transfection. Cells were embedded in 0.5% low‐melting Agarose on a slide and treated with lysis solution (EDTA 30 mM, SDS 0.5%) for 30 min at 4°C. Slides were immersed in TBE 1× and subjected to electrophoresis at 17 V (7–6 mA) during 10 min at 4°C. DNA was stained with ethidium bromide and examined at 40× magnification with a Zeiss fluorescence microscope. OpenComet (a script of ImageJ) was used to obtain tail moment values (tail length × fraction of total DNA in the tail). ~50 events were measured per sample per experiment.
Cell survival assays
Cells were transfected or transduced as required; 24 h later, cells were replated on 24‐well (HCT116) or 96‐well (U2OS) dishes at a density of 3,000 (HCT116) or 1,000 (U2OS) cells/well. Drugs were added 24 h after transfection/transduction when required. HCT116 cells were counted on a Neubauer chamber 48 or 120 h afterwards, as specified in figure legends. U2OS cells were fixed with 2% paraformaldehyde/sucrose 120 h after replating. InCell 2200 ® was used to obtain images of DAPI‐stained nuclei, and InCell Analyzer WorkStation ® was used to count nuclei. Alternatively, the number of viable U2OS cells was determined with CellTiter‐Glo® Luminescent Cell Viability Assay G‐7570 (Promega), according to the manufacturer's instructions.
Statistical analysis
GraphPad Prism 5 and InfoStat were used for statistical analyses. In all graphs, different letters indicate groups that are significantly different. Thus, if two samples share the same letter they are not significantly different, while if two samples do not share any letter they are significantly different. P < 0.001 or P < 0.05 was considered significant, for frequency distribution or data shown as mean of independent experiment, respectively, unless otherwise indicated.
Author contributions
Conceptualization: MAGB and VG; Design of the work: MAGB, NLC, SS, J‐SH, and VG; Generation of tools and resources: MAGB, NLC, SML, MH, RB, and M‐JP; Generation and analysis of data: MAGB, NLC, SML, and AM; Interpretation: MAGB, NLC, SS, J‐SH, and VG; Writing—Original Draft, MAGB; Writing—Review & Editing, VG and J‐SH; and Supervision, VG.
Conflict of interest
The authors declare that they have no conflict of interest.
Supporting information
Appendix
Expanded View Figures PDF
Source Data for Expanded View
Review Process File
Source Data for Figure 1
Source Data for Figure 2
Source Data for Figure 3
Source Data for Figure 4
Source Data for Figure 8
Acknowledgements
We thank Professors AR Lehmann (University of Sussex), T Huang (New York University), G Soria (Universidad Nacional de Córdoba), B Vogelstein (Johns Hopkins University), S Ángel and S Bogado (INTECH), A Schinder (FIL), and R Ulm (University of Geneva) for the gift of reagents. We thank Anabel Álvarez Julia and Andrés Hugo Rossi for technical support with tissue culture and microscopy. We are profoundly indebted to MJ Muñoz, JC Muñoz, and A Cambindo Botto for providing essential reagents and performing the Western blot shown in Fig EV2C. This work was supported by grants from the Agencia Nacional de Promoción Científica y Tecnológica (ANPCyT) to V.G. and M.A.G.B. Work in J.S.H. laboratory is supported by funding from INCa‐PLBIO 2016, ANR PRC 2016, Labex Toucan, and La Ligue contre le Cancer (Equipe labellisée 2017). Work in S.S. laboratory is supported by the Associazione Italiana per la Ricerca sul Cancro (Start‐up Grant 12710 to S.S.) and the European Commission (PCIG10‐GA‐2011‐303806 to S.S.). V.G. and M.A.G.B. are researchers from the National Council of Scientific and Technological Research (CONICET). N.L.C. is supported by a fellowship from CONICET. M.A.G.B. was also supported by a short‐term fellowship from The Journal of Cell Science to visit the JSH laboratory.
The EMBO Journal (2019) 38: e101284
References
- Anglana M, Apiou F, Bensimon A, Debatisse M (2003) Dynamics of DNA replication in mammalian somatic cells: nucleotide pool modulates origin choice and interorigin spacing. Cell 114: 385–394 [DOI] [PubMed] [Google Scholar]
- Beck H, Nahse‐Kumpf V, Larsen MS, O'Hanlon KA, Patzke S, Holmberg C, Mejlvang J, Groth A, Nielsen O, Syljuasen RG et al (2012) Cyclin‐dependent kinase suppression by WEE1 kinase protects the genome through control of replication initiation and nucleotide consumption. Mol Cell Biol 32: 4226–4236 [DOI] [PMC free article] [PubMed] [Google Scholar]
- Bergoglio V, Boyer AS, Walsh E, Naim V, Legube G, Lee MY, Rey L, Rosselli F, Cazaux C, Eckert KA et al (2013) DNA synthesis by Pol eta promotes fragile site stability by preventing under‐replicated DNA in mitosis. J Cell Biol 201: 395–408 [DOI] [PMC free article] [PubMed] [Google Scholar]
- Berti M, Ray Chaudhuri A, Thangavel S, Gomathinayagam S, Kenig S, Vujanovic M, Odreman F, Glatter T, Graziano S, Mendoza‐Maldonado R et al (2013) Human RECQ1 promotes restart of replication forks reversed by DNA topoisomerase I inhibition. Nat Struct Mol Biol 20: 347–354 [DOI] [PMC free article] [PubMed] [Google Scholar]
- Bertoletti F, Cea V, Liang CC, Lanati T, Maffia A, Avarello MDM, Cipolla L, Lehmann AR, Cohn MA, Sabbioneda S (2017) Phosphorylation regulates human poleta stability and damage bypass throughout the cell cycle. Nucleic Acids Res 45: 9441–9454 [DOI] [PMC free article] [PubMed] [Google Scholar]
- Betous R, Rey L, Wang G, Pillaire MJ, Puget N, Selves J, Biard DS, Shin‐ya K, Vasquez KM, Cazaux C et al (2009) Role of TLS DNA polymerases eta and kappa in processing naturally occurring structured DNA in human cells. Mol Carcinog 48: 369–378 [DOI] [PMC free article] [PubMed] [Google Scholar]
- Biertumpfel C, Zhao Y, Kondo Y, Ramon‐Maiques S, Gregory M, Lee JY, Masutani C, Lehmann AR, Hanaoka F, Yang W (2010) Structure and mechanism of human DNA polymerase eta. Nature 465: 1044–1048 [DOI] [PMC free article] [PubMed] [Google Scholar]
- Branzei D, Foiani M (2010) Maintaining genome stability at the replication fork. Nat Rev Mol Cell Biol 11: 208–219 [DOI] [PubMed] [Google Scholar]
- Buisson R, Boisvert JL, Benes CH, Zou L (2015) Distinct but concerted roles of ATR, DNA‐PK, and Chk1 in countering replication stress during S phase. Mol Cell 59: 1011–1024 [DOI] [PMC free article] [PubMed] [Google Scholar]
- Ciccia A, Elledge SJ (2010) The DNA damage response: making it safe to play with knives. Mol Cell 40: 179–204 [DOI] [PMC free article] [PubMed] [Google Scholar]
- Conti C, Sacca B, Herrick J, Lalou C, Pommier Y, Bensimon A (2007) Replication fork velocities at adjacent replication origins are coordinately modified during DNA replication in human cells. Mol Biol Cell 18: 3059–3067 [DOI] [PMC free article] [PubMed] [Google Scholar]
- Dai X, You C, Wang Y (2016) The functions of serine 687 phosphorylation of human DNA polymerase eta in UV damage tolerance. Mol Cell Proteomics 15: 1913–1920 [DOI] [PMC free article] [PubMed] [Google Scholar]
- Forment JV, Blasius M, Guerini I, Jackson SP (2011) Structure‐specific DNA endonuclease Mus81/Eme1 generates DNA damage caused by Chk1 inactivation. PLoS ONE 6: e23517 [DOI] [PMC free article] [PubMed] [Google Scholar]
- Gaillard H, Garcia‐Muse T, Aguilera A (2015) Replication stress and cancer. Nat Rev Cancer 15: 276–289 [DOI] [PubMed] [Google Scholar]
- Galanos P, Vougas K, Walter D, Polyzos A, Maya‐Mendoza A, Haagensen EJ, Kokkalis A, Roumelioti FM, Gagos S, Tzetis M et al (2016) Chronic p53‐independent p21 expression causes genomic instability by deregulating replication licensing. Nat Cell Biol 18: 777–789 [DOI] [PMC free article] [PubMed] [Google Scholar]
- Garcia‐Exposito L, Bournique E, Bergoglio V, Bose A, Barroso‐Gonzalez J, Zhang S, Roncaioli JL, Lee M, Wallace CT, Watkins SC et al (2016) Proteomic profiling reveals a specific role for translesion DNA polymerase eta in the alternative lengthening of telomeres. Cell Rep 17: 1858–1871 [DOI] [PMC free article] [PubMed] [Google Scholar]
- Ge XQ, Blow JJ (2010) Chk1 inhibits replication factory activation but allows dormant origin firing in existing factories. J Cell Biol 191: 1285–1297 [DOI] [PMC free article] [PubMed] [Google Scholar]
- Gonzalez Besteiro MA, Gottifredi V (2015) The fork and the kinase: a DNA replication tale from a CHK1 perspective. Mutat Res Rev Mutat Res 763: 168–180 [DOI] [PMC free article] [PubMed] [Google Scholar]
- Heffernan TP, Unsal‐Kacmaz K, Heinloth AN, Simpson DA, Paules RS, Sancar A, Cordeiro‐Stone M, Kaufmann WK (2007) Cdc7‐Dbf4 and the human S checkpoint response to UVC. J Biol Chem 282: 9458–9468 [DOI] [PMC free article] [PubMed] [Google Scholar]
- Kannouche P, Broughton BC, Volker M, Hanaoka F, Mullenders LH, Lehmann AR (2001) Domain structure, localization, and function of DNA polymerase eta, defective in xeroderma pigmentosum variant cells. Genes Dev 15: 158–172 [DOI] [PMC free article] [PubMed] [Google Scholar]
- Koh SB, Courtin A, Boyce RJ, Boyle RG, Richards FM, Jodrell DI (2015) CHK1 inhibition synergizes with gemcitabine initially by destabilizing the DNA replication apparatus. Cancer Res 75: 3583–3595 [DOI] [PubMed] [Google Scholar]
- Kohler C, Koalick D, Fabricius A, Parplys AC, Borgmann K, Pospiech H, Grosse F (2016) Cdc45 is limiting for replication initiation in humans. Cell Cycle 15: 974–985 [DOI] [PMC free article] [PubMed] [Google Scholar]
- Kopper F, Bierwirth C, Schon M, Kunze M, Elvers I, Kranz D, Saini P, Menon MB, Walter D, Sorensen CS et al (2013) Damage‐induced DNA replication stalling relies on MAPK‐activated protein kinase 2 activity. Proc Natl Acad Sci USA 110: 16856–16861 [DOI] [PMC free article] [PubMed] [Google Scholar]
- Kotsantis P, Silva LM, Irmscher S, Jones RM, Folkes L, Gromak N, Petermann E (2016) Increased global transcription activity as a mechanism of replication stress in cancer. Nat Commun 7: 13087 [DOI] [PMC free article] [PubMed] [Google Scholar]
- Koundrioukoff S, Carignon S, Techer H, Letessier A, Brison O, Debatisse M (2013) Stepwise activation of the ATR signaling pathway upon increasing replication stress impacts fragile site integrity. PLoS Genet 9: e1003643 [DOI] [PMC free article] [PubMed] [Google Scholar]
- Kurashima K, Sekimoto T, Oda T, Kawabata T, Hanaoka F, Yamashita T (2018) Poleta, a Y‐family translesion synthesis polymerase, promotes cellular tolerance of Myc‐induced replication stress. J Cell Sci 131: jcs212183 [DOI] [PubMed] [Google Scholar]
- Mansilla SF, Bertolin AP, Bergoglio V, Pillaire MJ, Gonzalez Besteiro MA, Luzzani C, Miriuka SG, Cazaux C, Hoffmann JS, Gottifredi V (2016) Cyclin kinase‐independent role of p21CDKN1A in the promotion of nascent DNA elongation in unstressed cells. Elife 5: e18020 [DOI] [PMC free article] [PubMed] [Google Scholar]
- Massey AJ (2017) Modification of tumour cell metabolism modulates sensitivity to Chk1 inhibitor‐induced DNA damage. Sci Rep 7: 40778 [DOI] [PMC free article] [PubMed] [Google Scholar]
- Maya‐Mendoza A, Petermann E, Gillespie DA, Caldecott KW, Jackson DA (2007) Chk1 regulates the density of active replication origins during the vertebrate S phase. EMBO J 26: 2719–2731 [DOI] [PMC free article] [PubMed] [Google Scholar]
- Maya‐Mendoza A, Moudry P, Merchut‐Maya JM, Lee M, Strauss R, Bartek J (2018) High speed of fork progression induces DNA replication stress and genomic instability. Nature 559: 279–284 [DOI] [PubMed] [Google Scholar]
- Murfuni I, Basile G, Subramanyam S, Malacaria E, Bignami M, Spies M, Franchitto A, Pichierri P (2013) Survival of the replication checkpoint deficient cells requires MUS81‐RAD52 function. PLoS Genet 9: e1003910 [DOI] [PMC free article] [PubMed] [Google Scholar]
- Parsels LA, Tanska DM, Parsels JD, Zabludoff SD, Cuneo KC, Lawrence TS, Maybaum J, Morgan MA (2016) Dissociation of gemcitabine chemosensitization by CHK1 inhibition from cell cycle checkpoint abrogation and aberrant mitotic entry. Cell Cycle 15: 730–739 [DOI] [PMC free article] [PubMed] [Google Scholar]
- Peng G, Chun‐Jen Lin C, Mo W, Dai H, Park YY, Kim SM, Peng Y, Mo Q, Siwko S, Hu R et al (2014) Genome‐wide transcriptome profiling of homologous recombination DNA repair. Nat Commun 5: 3361 [DOI] [PMC free article] [PubMed] [Google Scholar]
- Petermann E, Maya‐Mendoza A, Zachos G, Gillespie DA, Jackson DA, Caldecott KW (2006) Chk1 requirement for high global rates of replication fork progression during normal vertebrate S phase. Mol Cell Biol 26: 3319–3326 [DOI] [PMC free article] [PubMed] [Google Scholar]
- Petermann E, Woodcock M, Helleday T (2010) Chk1 promotes replication fork progression by controlling replication initiation. Proc Natl Acad Sci USA 107: 16090–16095 [DOI] [PMC free article] [PubMed] [Google Scholar]
- Qiu Z, Oleinick NL, Zhang J (2018) ATR/CHK1 inhibitors and cancer therapy. Radiother Oncol 126: 450–464 [DOI] [PMC free article] [PubMed] [Google Scholar]
- Rodriguez R, Gagou ME, Meuth M (2008) Apoptosis induced by replication inhibitors in Chk1‐depleted cells is dependent upon the helicase cofactor Cdc45. Cell Death Differ 15: 889–898 [DOI] [PubMed] [Google Scholar]
- Rodriguez‐Acebes S, Mouron S, Mendez J (2018) Uncoupling fork speed and origin activity to identify the primary cause of replicative stress phenotypes. J Biol Chem 293: 12855–12861 [DOI] [PMC free article] [PubMed] [Google Scholar]
- Sakurikar N, Thompson R, Montano R, Eastman A (2016) A subset of cancer cell lines is acutely sensitive to the Chk1 inhibitor MK‐8776 as monotherapy due to CDK2 activation in S phase. Oncotarget 7: 1380–1394 [DOI] [PMC free article] [PubMed] [Google Scholar]
- Sanjiv K, Hagenkort A, Calderon‐Montano JM, Koolmeister T, Reaper PM, Mortusewicz O, Jacques SA, Kuiper RV, Schultz N, Scobie M et al (2016) Cancer‐specific synthetic lethality between ATR and CHK1 kinase activities. Cell Rep 14: 298–309 [DOI] [PMC free article] [PubMed] [Google Scholar]
- Sirbu BM, Couch FB, Feigerle JT, Bhaskara S, Hiebert SW, Cortez D (2011) Analysis of protein dynamics at active, stalled, and collapsed replication forks. Genes Dev 25: 1320–1327 [DOI] [PMC free article] [PubMed] [Google Scholar]
- Sirbu BM, Couch FB, Cortez D (2012) Monitoring the spatiotemporal dynamics of proteins at replication forks and in assembled chromatin using isolation of proteins on nascent DNA. Nat Protoc 7: 594–605 [DOI] [PMC free article] [PubMed] [Google Scholar]
- Sorensen CS, Syljuasen RG, Falck J, Schroeder T, Ronnstrand L, Khanna KK, Zhou BB, Bartek J, Lukas J (2003) Chk1 regulates the S phase checkpoint by coupling the physiological turnover and ionizing radiation‐induced accelerated proteolysis of Cdc25A. Cancer Cell 3: 247–258 [DOI] [PubMed] [Google Scholar]
- Sorensen CS, Syljuasen RG (2012) Safeguarding genome integrity: the checkpoint kinases ATR, CHK1 and WEE1 restrain CDK activity during normal DNA replication. Nucleic Acids Res 40: 477–486 [DOI] [PMC free article] [PubMed] [Google Scholar]
- Speroni J, Federico MB, Mansilla SF, Soria G, Gottifredi V (2012) Kinase‐independent function of checkpoint kinase 1 (Chk1) in the replication of damaged DNA. Proc Natl Acad Sci USA 109: 7344–7349 [DOI] [PMC free article] [PubMed] [Google Scholar]
- Srinivasan SV, Dominguez‐Sola D, Wang LC, Hyrien O, Gautier J (2013) Cdc45 is a critical effector of myc‐dependent DNA replication stress. Cell Rep 3: 1629–1639 [DOI] [PMC free article] [PubMed] [Google Scholar]
- Syljuasen RG, Sorensen CS, Hansen LT, Fugger K, Lundin C, Johansson F, Helleday T, Sehested M, Lukas J, Bartek J (2005) Inhibition of human Chk1 causes increased initiation of DNA replication, phosphorylation of ATR targets, and DNA breakage. Mol Cell Biol 25: 3553–3562 [DOI] [PMC free article] [PubMed] [Google Scholar]
- Techer H, Koundrioukoff S, Carignon S, Wilhelm T, Millot GA, Lopez BS, Brison O, Debatisse M (2016) Signaling from Mus81‐Eme2‐dependent DNA damage elicited by Chk1 deficiency modulates replication fork speed and origin usage. Cell Rep 14: 1114–1127 [DOI] [PubMed] [Google Scholar]
- Thomson AM, Gillespie PJ, Blow JJ (2010) Replication factory activation can be decoupled from the replication timing program by modulating Cdk levels. J Cell Biol 188: 209–221 [DOI] [PMC free article] [PubMed] [Google Scholar]
- Toledo LI, Altmeyer M, Rask MB, Lukas C, Larsen DH, Povlsen LK, Bekker‐Jensen S, Mailand N, Bartek J, Lukas J (2013) ATR prohibits replication catastrophe by preventing global exhaustion of RPA. Cell 155: 1088–1103 [DOI] [PubMed] [Google Scholar]
- Tubbs A, Nussenzweig A (2017) Endogenous DNA damage as a source of genomic instability in cancer. Cell 168: 644–656 [DOI] [PMC free article] [PubMed] [Google Scholar]
- Vaisman A, Woodgate R (2017) Translesion DNA polymerases in eukaryotes: what makes them tick? Crit Rev Biochem Mol Biol 52: 274–303 [DOI] [PMC free article] [PubMed] [Google Scholar]
- Vallerga MB, Mansilla SF, Federico MB, Bertolin AP, Gottifredi V (2015) Rad51 recombinase prevents Mre11 nuclease‐dependent degradation and excessive PrimPol‐mediated elongation of nascent DNA after UV irradiation. Proc Natl Acad Sci USA 112: E6624–E6633 [DOI] [PMC free article] [PubMed] [Google Scholar]
- Villafanez F, Garcia IA, Carbajosa S, Pansa MF, Mansilla S, Llorens MC, Angiolini V, Guantay L, Jacobs H, Madauss KP et al (2019) AKT inhibition impairs PCNA ubiquitylation and triggers synthetic lethality in homologous recombination‐deficient cells submitted to replication stress. Oncogene 38: 4310–4324 [DOI] [PMC free article] [PubMed] [Google Scholar]
- Wayne J, Brooks T, Massey AJ (2016) Inhibition of Chk1 with the small molecule inhibitor V158411 induces DNA damage and cell death in an unperturbed S‐phase. Oncotarget 7: 85033–85048 [DOI] [PMC free article] [PubMed] [Google Scholar]
- Wilsker D, Petermann E, Helleday T, Bunz F (2008) Essential function of Chk1 can be uncoupled from DNA damage checkpoint and replication control. Proc Natl Acad Sci USA 105: 20752–20757 [DOI] [PMC free article] [PubMed] [Google Scholar]
- Wong PG, Winter SL, Zaika E, Cao TV, Oguz U, Koomen JM, Hamlin JL, Alexandrow MG (2011) Cdc45 limits replicon usage from a low density of preRCs in mammalian cells. PLoS ONE 6: e17533 [DOI] [PMC free article] [PubMed] [Google Scholar]
- Yamada M, Watanabe K, Mistrik M, Vesela E, Protivankova I, Mailand N, Lee M, Masai H, Lukas J, Bartek J (2013) ATR‐Chk1‐APC/CCdh1‐dependent stabilization of Cdc7‐ASK (Dbf4) kinase is required for DNA lesion bypass under replication stress. Genes Dev 27: 2459–2472 [DOI] [PMC free article] [PubMed] [Google Scholar]
- Yang XH, Shiotani B, Classon M, Zou L (2008) Chk1 and Claspin potentiate PCNA ubiquitination. Genes Dev 22: 1147–1152 [DOI] [PMC free article] [PubMed] [Google Scholar]
- Yang Y, Gao Y, Mutter‐Rottmayer L, Zlatanou A, Durando M, Ding W, Wyatt D, Ramsden D, Tanoue Y, Tateishi S et al (2017) DNA repair factor RAD18 and DNA polymerase Polkappa confer tolerance of oncogenic DNA replication stress. J Cell Biol 216: 3097–3115 [DOI] [PMC free article] [PubMed] [Google Scholar]
- Yekezare M, Gomez‐Gonzalez B, Diffley JF (2013) Controlling DNA replication origins in response to DNA damage ‐ inhibit globally, activate locally. J Cell Sci 126: 1297–1306 [DOI] [PubMed] [Google Scholar]
- Zeman MK, Cimprich KA (2014) Causes and consequences of replication stress. Nat Cell Biol 16: 2–9 [DOI] [PMC free article] [PubMed] [Google Scholar]
- Zhong Y, Nellimoottil T, Peace JM, Knott SR, Villwock SK, Yee JM, Jancuska JM, Rege S, Tecklenburg M, Sclafani RA et al (2013) The level of origin firing inversely affects the rate of replication fork progression. J Cell Biol 201: 373–383 [DOI] [PMC free article] [PubMed] [Google Scholar]
- Zuazua‐Villar P, Ganesh A, Phear G, Gagou ME, Meuth M (2015) Extensive RPA2 hyperphosphorylation promotes apoptosis in response to DNA replication stress in CHK1 inhibited cells. Nucleic Acids Res 43: 9776–9787 [DOI] [PMC free article] [PubMed] [Google Scholar]
Associated Data
This section collects any data citations, data availability statements, or supplementary materials included in this article.
Supplementary Materials
Appendix
Expanded View Figures PDF
Source Data for Expanded View
Review Process File
Source Data for Figure 1
Source Data for Figure 2
Source Data for Figure 3
Source Data for Figure 4
Source Data for Figure 8