

Abstract
Preclinical neuroimaging allows for the assessment of brain anatomy, connectivity, and function in laboratory animals, such as mice and this imaging field has been a rapidly growing aimed at bridging the translation gap between animal and human research. The progress in the animal research could be accelerated by high-resolution in vivo optical imaging technologies. Optical coherence tomography-based angiography (OCTA) estimates the scattering from moving red blood cells, providing the visualization of functional micro-vessel networks within tissue beds in vivo without a need for exogenous contrast agents. Recent advancement of OCTA methods have expanded its application to neuroimaging of small animal models of brain disorders. In this paper, we overview the recent development of OCTA techniques for blood flow imaging and its preclinical applications in neuroimaging. In specific, a summary of preclinical OCTA studies for traumatic brain injury, cerebral stroke, and aging brain on mice is reviewed.
Keywords: Optical coherence tomography; Angiography; Preclinical neuroimaging, small animal models; Traumatic brain injury, stroke, aging
Introduction
Optical coherence tomography (OCT) is a powerful non-invasive, high-resolution interferometric imaging technology that enables in vivo visualization of biological tissues in cross-section [1]. OCT measures echo time delayed back-scattered light signals (i.e., reflectance) at the boundaries between multiple structural layers within the sample through the principle of low coherence interferometry [2]. A collection of the reflectances along optical axis exhibits internal structures of the sample in depth at a micrometer-scale resolution (1–10 μm). By step-wise dislocating either the beam position or the sample itself along lateral (x or y or both) direction, a cross-sectional image (tomography) or volumetric tomographic image of the sample is displayed [2]. Since its first introduction in 1991 [1], there has been continuous advances in OCT technologies in terms of imaging resolution, imaging speed, imaging depth, field-of-view, sensitivity with aid of technical development in optical devices and components [3–6]. Today, several implementations of OCT extension have been proposed to observe the structure as well as other features characterized by the interaction of light with the sample such as phase [7], polarization [8], refractive index [9], attenuation [10], Doppler effect [11], and scattering dynamics [12]. These additional improvements in OCT methods have allowed for combination of structural information with information about the function of the living tissues, prompting wide-spread clinical acceptance of OCT to date [13].
One of the OCT extension recently implemented is OCT based angiography (OCTA) [14]. OCTA is a type of non-invasive angiography without exogenous contrast agents, providing visualization of macro- or microcirculation in functional vessels embedded in the vascularized tissue in vivo. The endogenous angiography has been quite challenging to achieve for classical OCT because of relatively weak scattering from the erythrocytes (red blood cells) moving through the blood vessel lumen compared to surrounding tissue, resulting in poor delineation of blood vessels in OCT structure image. By assessing dynamics of the time-course scattering signals, however, OCTA exploits the motion of red blood cells (RBCs) as an endogenous contrast to generate blood flow signals. This capability to map the blood flow of OCTA has pushed the recent OCT development into a new height of being able to non-invasively assess the microvasculature in health and disease, permitting preclinical and clinical applications of OCTA to biomedicine. In a few years since invention, particularly, its clinical translation to ophthalmology has been first realized to examine various retinal vascular abnormalities and diseases such as retinal arterial venous occlusion, retinitis pigmentosa, choroidal neovascularization, glaucoma, uveitis, age-related macular degeneration (AMD), and diabetic retinopathy (DR) [15], representing a major contribution toward advancing the conventional ophthalmic diagnosis using current standard-of-care methods, including fluorescein angiography (FA) and indocyanine green angiography (ICG) [16].
The most of clinical investigations using OCTA have been focused on the field of ophthalmology and accordingly, a number of OCTA review articles have mainly covered the clinical indications of OCTA for ocular diseases. But, the OCTA review in neuroimaging has been not witnessed because of the scarce of its use in the related clinics due to the several technical hurdles involving the limited penetration depth and poor accessibility to a thick human brain tissue through highly scattered skull. In preclinical studies, however, the imaging capabilities of OCTA have been still benefited for visualizing the microvasculature of small-sized animal brain in the setting of intact skull or even intact skin [17]. Hence, OCTA has been intensively adopted for experimental small animal studies to examine structural and potential functional alterations within the microcirculation of rodent models of diseases in vivo, which have helped to further characterize vascular components underlying the pathobiology of diseases, which could open up new therapeutic targets and avenues of clinical monitoring [18].
The purpose of this article is to review the recent results from the use of OCTA technology in the small animal brain studies. In this concise review, the main area of emphasis would be a summary of preclinical applications, rather than the technical aspects of the various methods employed for OCTA, which have already been continuously and minutely covered by the previous OCTA review articles in ophthalmology [19–21]. For readers’ understanding of its strengths and limitations, though, we will begin with a technical discussion of the OCTA methods, and followed by overview of the current OCTA studies in neuroimaging from traumatic brain injury (TBI) and cerebral stroke to aging brain of rodents. We will also discuss the concerns to be noted for the interpretation of cerebral OCTA images.
Principle of optical coherence tomography angiography (OCTA)
Since OCTA is a technique based on OCT, a brief review of the current OCT methodology is necessary prior to the discussion of OCTA methods. Common configuration of OCT takes a fiber-based Michelson interferometer, where a near-infrared (NIR) light from a broad-bandwidth laser source is split into two light waves by a fiber coupler, propagating toward two beam paths called a sample arm and a reference arm, respectively [1, 2]. Interference signal is formed between the light reflected from the mirror in the reference arm and light backscattered from the biological sample in the sample arm, from which a depth-resolved tissue reflectance characteristics are obtained the interference signal detected using a photodetector [1, 2].
The original implementation of OCT has used time-domain technology (referred to as time-domain OCT (TD-OCT)) that requires a moving reference mirror [1]. By displacing the location of the reference mirror, the interference signal is generated whenever the optical path lengths (OPLs) of the both arms are equally matched. Once a one-way translation of the reference mirror, eventually, a sequence of reflectances of the time delay echoes originated from various depths form a structural profile in the axial direction (A-scan), and optical cross-sections (B-scans) can be assembled by scanning the OCT beam in the transverse direction.
A later version of OCT does not require the mechanical scanning of the reference mirror. Instead of, it directly encodes the time delay echoes in spectral interferogram. This version is referred to as Fourier-domain OCT (FD-OCT). FD-OCT is classified by two different forms, depending on their system configurations; spectral domain OCT (SD-OCT) [22] and swept-source OCT (SS-OCT) [23]. SD-OCT is configured with a broad-bandwidth light source, a 1-D linear array sensor (e.g., a line scan charge-coupled device (CCD) camera), and a spectrometer to spatially capture the interferogram encoding the echoes in wavelength [22], while SS-OCT captures the spectral interferogram using a single detector (e.g., a photodiode) by sweeping the frequency of the laser source through a range of optical frequencies [23]. The spectral interferogram can be converted into a depth-resolved reflectance profile by Fourier-transformation, representing the tissue structural information in depth.
Since both SD- and SS-OCT are able to acquire the frequency information of interference signal from all depths with the reference mirror fixed, the OCT imaging speed is entirely decided by the array sensor speed or frequency sweeping rate. With technical advances in optical components and data acquisition hardware, the image acquisition speed has become tremendously faster (100,000 ~ few millions A-scans/s) than TD-OCT (400 A-scans/s). A sensitivity roll-off with depth 20 dB greater than TD-OCT is also featured for both FD-OCTs. Moreover, the implementation of a light source with a broader bandwidth improves the axial resolution down to 10 μm. Because of these technical advantages of FD-OCT, all of OCT studies have been currently using SD- or SS-OCT systems. For phase measurements, however, use of SD-OCT is preferable because SS-OCT is usually more prone to noise such as a jitter which is undesired phase noise introduced from discordance in cycle-to-cycle tuning [24, 25].
The principle of OCTA is to use the variation in the OCT signal caused by moving scatters in tissue such as red blood cells (RBCs), as a source of contrast to image blood flow [19]. Figure 1 conceptually illustrates how OCTA works. The cartoon (left) in Fig. 1 describes one A-scan (blue arrow) through the skin tissue involving one blood vessel in function where RBCs are flowing in random through the vessel lumen. If you would repeat the A-scan at the same location and record OCT signals at two positions of the depth profile—one is backscattered from inside the vessel lumen and another one is backscattered from surrounding tissue outside the vessel—over time, you would be able to observe that the OCT signal backscattered from the structural tissue remains steady, while the OCT signal backscattered from the flowing blood changes over time due to constant motion of RBCs which are tumbling and tank-treading in shear flow [26] through the vessel lumen as a graph in Fig. 1. The arbitrary oscillation in OCT signal over time is the result of random dynamics in backscattering from the biological particles that should be observed in the vessel lumen. The temporal changes of OCT signal in subsequent scan caused by the moving particles can differentiate the moving particles from the static tissue by analyzing the extent of the signal fluctuation, providing the opportunity to visualize the microvasculature without need of exogenous dyes. The motion-contrast may be generated by any moving particles (e.g., particles in tissue fluid or lymphatic vessel), however the predominant movement in typical tissue beds is from the RBCs in blood.
Fig. 1.
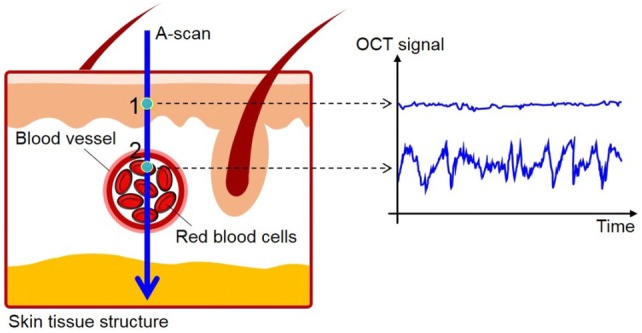
Illustration of the concept of OCTA. OCT signals are sampled from two points in the A-scan through skin tissue, where a pixel 1 is located at the static tissue, and an another pixel 2 is located within a functional blood vessel. Dynamic changes in the OCT signals for pixel 2 can be observed over time while the OCT signals from pixel 1 remain steady over time
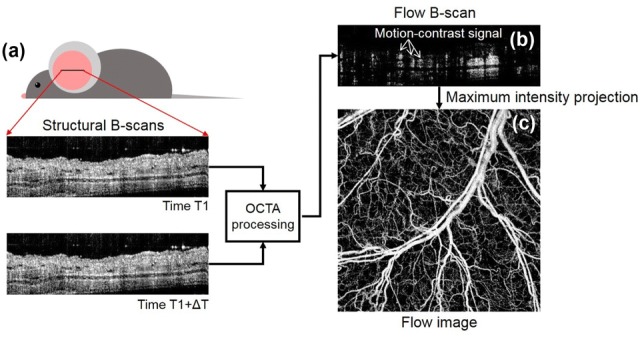
Repeated B-scans at the same position along the x-direction produce a series of OCT signals in cross-section at different time points. For example, Fig. 2a shows two OCT images of a live mouse pinna obtained at time T1 and T1 + ΔT, respectively, where ΔT is an elapsed time to complete one B-scan. Now we know that OCT signals from the blood vessels in the mouse pinna should be different at T1 and T1 + ΔT because of motion of RBCs flowing through the vessel lumen. By performing the OCTA processing with the ensemble of OCT images, one flow B-scan is produced with all of the OCT signals from the stationary tissue excluded. The motion-contrast signals in the flow B-scan localize the blood vessels (Fig. 2b). As repeating the OCTA protocol along the y-direction, the flow B-scans at different locations would be obtained within the scanned area. By taking maximum values of depth profiles in the flow B scans, one two-dimensional (2-D) flow projection image in x–y enface orientation is produced, showing the micro-vessel network of mouse pinna (Fig. 2c).
Fig. 2.
The OCTA signal processing scheme
OCT signal retrieved after Fourier transform in FD-OCT is originally a complex function, consisting of amplitude and phase information as:
| 1 |
denotes the amplitude (reflectivity) component and denotes the phase component where Δd, n, λc are an optical path length difference (OPD) between the sample and the reference arm, a refractive index of the sample, and a center wavelength of light in free space, individually. For OCTA processing, several OCTA algorithms have been developed, harnessing different components (i.e., amplitude and phase) of the OCT signal to obtain the motion-contrast for angiography. In usual, they can be separated into three categories: phase-signal-based OCTA algorithms, intensity-signal-based OCTA algorithms, and complex-signal-based OCTA algorithms.
Phase-signal-based OCTA algorithms
OCTA algorithms utilizing the phase variation as an angiographic contrast have been reported. The phase of OCT signal is altered by the moving RBCs because of changes in OPD which is mainly induced by axial (z-axis) displacement of RBCs in motion. Since the even small displacement reflects the detectable change in phase, the phase-signal based approach takes advantage to detect the larger dynamic range of flow velocities. The few methods have been proposed to obtain the difference in phases between the sequential pixels, adjacent A-scans [27, 28], or adjacent B-scans [29], achieved by different scan protocols. Especially, the latter called phase variance OCT (pvOCT) [30] measures the phase variance between the adjacent B-scans, where a time interval between the inter B-scans is significantly increased. The increased time interval induces the larger displacement of moving particles during the time interval, and as a result, the detection sensitivity to the slower flow (e.g., capillary flow) can be dramatically increased. The flow signal in pvOCT is expressed as the following equation [30]:
| 2 |
where N represents the repetition number of B-scans acquired at the same location, Φi(x,z,t) and ΔΦi(x,z,t) indicate the phase value and phase difference in the i-th B-scans at lateral location x, depth position z, and time t, ΔT is the time interval between two consecutive B-scans, and i is the index of the i-th B-scan. A main drawback of the phase-signal-based approach is that it is prone to perturbation, contaminating the real flow signals with the phase noise caused by the OCT laser source [31] or the bulk motion of the tissue. The phase stabilization has been attempted to remove the phase noise using computational methods on post-processing [32] or developing phase-stable light sources [33], which will be more discussed in Sect. 2.4.
Intensity-signal-based OCTA algorithms
In order to overcome the drawback (vulnerable to phase noise) of phase-signal-based OCTA algorithms, OCT researchers have proposed intensity-signal-based OCTA algorithms using the change in amplitude or intensity of OCT signal to contrast the particle motion. Currently, these OCTA approaches are the most preferably being used for OCTA studies because of being insensitive to the phase noise, saving the trouble for the phase compensation. The intensity-signal-based OCTA algorithms include three representative methods: speckle variance OCT (svOCT) [34], correlation mapping OCT (cmOCT) [35], and split-spectrum amplitude decorrelation (SSADA) [36].
Speckle variance OCT (svOCT)
OCT signals involve speckles, a form of constructive or destructive interference generated by superposition of multiply-scattered lights through the heterogeneous tissue. It has been shown that the speckles in OCT signals play a dual role; both as source of noise and as a carrier of information about tissue microstructure and flow. However, a basic concept of classical laser speckle imaging was to use the time-dependency of laser speckles to quantify the particle flow [37]. In OCT regime, Barton et al. [38] have first coined this concept to TD-OCT with a hypothesis that the OCT signal can be treated as a speckle and the strength of speckle coming from flow would become different from that from the static tissue. By measuring the variance in OCT signal amplitudes taken at the adjacent four-pixels in one OCT cross-section, the authors have been able to successfully visualize the flow image of an in vitro tube phantom and in vivo rodent skin [38]. This was the first application of using speckle analysis in OCT image to obtain flow signals. Mariampillai et al. [34] have introduced the concept of speckle variance on SD-OCT. The B-scans are repeated with a constant time interval and then the inter B-frame (inter B-scans) speckle variance signal can be computed using the following equation [34]:
| 3 |
where N represents the repetition number of B-scans acquired at the same location, Ii(x,z) denotes the intensity value in the i-th B-scans at lateral location x, depth position z, and Imean is the average of the intensity value over the same set of pixels. Since the speckle variance approach is readily suited to both SD- and SS-OCT implementation because of its immunity to phase noise, allowing for a wide range of application of biomedical imaging of retina [39], skin [40], spinal cord [41], and embryo [42].
Correlation mapping OCT (cmOCT)
Another intensity-signal-based OCTA algorithm has been introduced by Enfield et al. [35]. In the proposed method, the authors have evaluated the degree of similarity (resemblance) of the OCT speckle intensities between adjacent B-scans to obtain flow signal, that is, by calculating the correlation of inter-frames, the flow signal can be extracted from the correlogram. As particle flow regions characterize relatively lower correlation than static regions, it is possible to isolate the microvasculatures from the surrounding static tissues by estimating the calculated correlation values with a given threshold [35]. In specific, the flow signals can be acquired by calculating cross-correlation between two of M × N grid consisting of neighboring pixels taken at the same transverse location from the inter B-frames which is expressed as [35]:
| 4 |
where (# is A or B) indicates the intensity value at an arbitrary pixel in the grids from the frame A and frame B, and M and N is the grid size. (# is A or B) is the grid mean value. This grid is then shifted across the entire XZ image and a 2-D correlation map (a correlogram) is generated. The resulting correlation map contains values on the range from − 1 to + 1, where the value toward to + 1 indicates positive correlation and vice versa. 0 means no correlation at all. The grid size used is arbitrarily chosen for optimal image quality with the trade-off of processing time; larger grids require greater processing times and pixel bining, resulting in loss of smaller vessels in the flow image.
The background noise gives weak correlation values, comparable to the correlation values in the flow region. This flow signal ambiguity has been effectively resolved by masking the correlation image with a structural mask, region that contains structural information in the OCT image [35]. Further masking with a flow image obtained using other intensity-signal-based OCTA algorithm has markedly enhanced the flow image quality [43].
Split-spectrum amplitude-decorrelation angiography (SSADA)
Although the speckle variance or correlation mapping method mentioned above does not suffer from phase noise artifacts, the methods are still sensitive to the global movement of biological sample in axial direction (e.g., breathing, heartbeat, involuntary tissue bulk motion). To overcome this limitation, a new correlation technique termed “split-spectrum amplitude-decorrelation angiography” (SSADA) has been proposed by Jia et al. [36].
A main key of the method is to lower axial resolution in OCT imaging; by extending the height of resolution cell, the depth-resolving power is degraded, which can dampen the axial decorrelation sensitivity caused by the axial motion noise [36]. The authors have achieved the lowered axial resolution on purpose by splitting full OCT spectrum into several narrower bands. With the split four sub-bands, the original 2-D spectral interferogram is sub-divided into four new interferograms with smaller bandwidth. This strategy of splitting the spectrum can reduce the predominant bulk motion noise in the axial dimension without sacrificing the flow signal. Inter B-scan decorrelation was computed using the spectral interferograms separately and then averaged using the following equation [36]:
| 5 |
where x and z are lateral and depth indices of the B-scan images, and n and m denotes the B-scan slice index and the index of the split spectrum, respectively. N indicates the number of repeated B-scans taken at the same position and M is the number of split-spectrums. Anm(x,z) and A(n+1)m(x,z) are the adjacent amplitude frames obtained from the m-th split spectral interferogram. By increasing the number M, the decorrelation signal-to-noise ratio (SNR) can be improved without increasing the scan acquisition time.
SSADA has been shown to improve the SNR of flow detection and connectivity of microvascular network when compared to other amplitude decorrelation algorithms [36, 44]. This split spectrum method is particularly optimal for imaging of retinal flow prone to the pulsatile bulk motion in the axial direction, but it is not preferred for imaging the cerebral flow of head-fixed rodent brain which is immune to the bulk motion.
Complex-signal-based OCTA algorithms
Optical microangiography (OMAG)
The third category utilizes both the phase and intensity (amplitude) information of the OCT signal for flow imaging. The representative of the complex-signal-based OCTA algorithms is optical microangiography (OMAG), which has been developed and named by Wang et al. [45] and later renovated to the current implementation by Wang in the same group in 2010 [46]. In this hybrid OCTA method, the authors have included both the phase and amplitude components of the OCT signal in the flow signal calculation in order to pursue the sensitivity enough to detect the slow flow which is only detectable by using the phase component. The flow signal is calculated by absolute of differential operation on the complex OCT signals in the adjacent B-scans which is formulated as [46]:
| 6 |
where N indicates the repetition number of B-scans at the same transverse location, and Ci(x,z) denotes the complex signal (having both amplitude and phase values) in i-th B-scans at lateral location x and depth position z. The possible phase noise induced by the axial bulk motion of the sample can be diminished by using a phase compensation [46]. The technique is theoretically sensitive enough to image the very slow blood flows at ~ 4 μm/s [46], which is sufficient to image particle Brownian motion [47]. The flow image quality can be improved by increasing the number of repetitions of B-scan, compromising of the scanning time and the improvement in the SNR is saturated over 12-times-repetitions [48].
Eigen-decomposition (ED)-based method
In addition to OMAG, Yosefi et al. [49] have proposed an eigen-decomposition (ED) method to obtain flow signals using a model-based statistical method of ED analysis of the complex OCT signals. Usually, the time-varying OCT signal consists of three components that represent the depth-resolved field speckle signals due to static tissue components, dynamic speckle signals due to moving blood cells, and additive noises including system noise. Authors have assumed that statistically there exists no correlation between the speckle signal induced by blood flow and the speckle signal due to the background tissue. Therefore, the separation of tissue signal and blood signal can be achieved by dimensional reduction, assuming that the tissue signals arise from a low-dimensional space and the blood signals arise from a dynamic space with a much higher dimension [49].
ED-based analysis has statistically estimated the dimensional spaces of tissue and blood signals by the covariance matrix of the ensemble complex OCT signals, upon which the eigenvalues and eigenvectors that represent the subsets of the signal makeup are calculated. From this analysis, the signals due to moving particles can be isolated by employing an adaptive regression filter to remove the eigen-components that represent static tissue signals. The proposed method has shown clear micro-vascular network of in vivo human skin [49], mouse pinna [50], mouse brain [51], and the results have outperformed the flow images using phase-compensation method or static high-pass filtering to remove the bulk motion.
Complex differential variance (CDV) algorithm
Further complex-signal-based OCTA algorithm named as complex differential variance (CDV) algorithm has been proposed by Nam et al. [52]. The algorithm is based on cross-correlation of OCT signals similar to cmOCT [35] and SSADA [36] but it exploits decorrelation of complex OCT signals instead of OCT intensity to estimate the similarity between inter-OCT signals during a given time-interval. The CDV algorithm applied to two A-lines obtained at the same position at time points t = 1 and t = 2 is given as [52]:
| 7 |
where is a window kernel along depth with a length of 2L + 1, and is a complex OCT signal; , where and are amplitude and phase information of light wave backscattered in depth, respectively. In Eq. (7), the algorithm calculates the degree of decorrelation between pixel values at the two time points in the depth kernel. The proposed algorithm is tolerant to phase noises sourced from small bulk tissue motion and instrument synchronization error because of characteristics of the phase noises which are highly correlated along depth (e.g., constant or linearly proportional to depth) unlike the phases by blood flow which are quite random in depth. The estimation of decorrelation, therefore, can intrinsically remove the phase artifacts from the phase by blood flow which can improve vascular contrast in OCTA image [53].
Phase stabilization in OCTA imaging
The OCTA algorithms relying on the phase or complex signal variations to achieve angiography have been reported to be more sensitive compared to the intensity-signal-based OCTA algorithms in terms of vessel connectivity and contrast-to-noise ratio (CNR) in OCTA images [54]. However, there requires some special considerations in the use of phase or complex-signal-based algorithms. It is known that the best performances of these algorithms are achieved when the phase variations in the motionless stationary tissues except for particle flow regions (blood vessels) are marginal (theoretically < ~ 40 mrad [54]). In practice, however, the complex-based OCTA is subject to global phase artifacts originated from multiple sources that could contaminate the real phase variations by blood flow. There are representative phase noise sources: tissue bulk motion and instabilities in the OCT instrumentation. For small bulk motion constrained to spatial displacement less than OCT image resolution, SD-OCT is inherently phase-stable because all the spectral sampling points are obtained simultaneously by a line-scan camera, whereas it is difficult for general SS-OCT to achieve phase-sensitive detection because of small instabilities in the swept-source laser and the data-acquisition hardware, from which the unsynchronized laser sweeping with data acquisition induces variation in wavenumber sampling, which produces spurious timing-induced phase error (termed of synchronization jitter errors). The resultant phase signal detected by SS-OCT is the superposition of phases from the origins including the blood flow, tissue bulk motion (greater than OCT image resolution) and the jitter-induced phase errors. Consequently, the phase instability of SS-OCT has degraded the quality of OCTA image, which has limited to its availability for functional imaging applications such as Doppler velocimetry compare to SD-OCT, despite of its outstanding performance of sensitivity roll-off along longer ranging distance.
However, recent technical efforts for phase-stabilization have shown practical solutions to remove the phase noises, leaving only the useful phase signals induced by blood flow. A common practice to phase-stabilize SS-OCT is to introduce a calibration mirror in the sample arm, in which the calibration mirror signal was used to measure timing mismatch-induced phase variations and these variations was then subtracted from the measured phase differences at all remaining depths [55, 56]. Another hardware-based approach has used an auxiliary Mach–Zehnder interferometer (MZI)-based optical clock (MZI-OC) signal as a calibration signal which could resample interference fringe to the exact same wavenumber space, but also provide the jitter amplitude to compensate for jitter-induced phase error [57, 58]. Furthermore, recent works have introduced numerical approaches without additional hardware implementation [32, 59], of which very recently, Song et al. [32] have reported an impressive fully numerical OCT phase-stabilization method on a SS-OCT. In this work, they have proposed to use the gradient (slope) of phase shifts along the depth to extract the jitter-induced phase shifts which are independent of sample motion but dependent on jitter amplitude and depth position. The performance delivered by the proposed approach has demonstrated high tolerance to acquisition jitter and significantly reduced computation time in comparison with conventional numerical approach.
Therefore, the phase stabilization techniques aforementioned have been requisitely applied to perform phase-variance OCT (pvOCT) [60], OMAG [32, 61] or other complex-based OCTA algorithms in SS-OCT platform in order to improve phase-stability of SS-OCT signal, guaranteeing their optimal performances achieving high quality OCTA or Doppler OCTA images at the extended depth range.
Preclinical applications of OCTA
As a functional extension of OCT technology, the use of OCTA has rapidly been applied to animal brain researches for observing the cerebral hemodynamics within live brain. The brain is a delicate yet complex ecosystem for robust behavior, consisting of multiple tissue layers and compartments for different functions. Although the human brain has an average volume of ~ 1450 cm3, three times greater than that of the rodent brain [62], a lot of structures and connectivity that exist in human brain similarly exists in rodents [63]. Because of a great relevance of the rodent brain to the human brain, scientists have routinely used rodents as a main preclinical model for brain research to improve our understanding of functional and vascular responds to the human brain, either in a healthy or a diseased state [64, 65]. Accurate visualization and quantification of microvascular networks and tissue perfusion in the rodent brain models are essential for evaluating the development in brain insults or neurovascular diseases such as stroke, traumatic brain injury (TBI), vascular dementia, inflammation, and brain cancer. Since OCTA possesses the unique capabilities to non-invasively image the particle flow within the high scattering media at a fast rate in three-dimension, it is able to provide the high-resolution and depth-resolved cerebral blood flow information at capillary flow level in the brain [66]. In this section, among the many OCTA reports in neuroscience, review outlines representative preclinical OCTA studies using the rodent model of brain disorders.
Traumatic brain injury (TBI)
Traumatic brain injury (TBI) is an intracranial injury resulted from brain insult by external mechanical force [67]. TBI occurs as consequences of a focal impact upon the head by sudden violent blow to the head. Injury process in TBI is classified into primary brain injury and secondary brain injury; primary brain injury occurs at the moment of initial impact, inducing bruising of brain, tearing of nerve fibers and ruptures of cerebral veins, causing blood collection in or around brain due to intracranial bleeding (hematoma). Secondary injury caused by the primary brain injury collectively exacerbates the brain trauma within the minutes to days, accompanying complex pathological cascades including raised intracranial pressure, alteration in cerebral blood flow (CBF), edema and neuronal damage in the brain tissue, leading to permanent impairment of cognitive, behavioral and psychosocial functions in the brain. These pathogenic injury processes are incompletely understood and accordingly no effective and appropriate neuroprotective treatment is available [67].
The use of TBI model is essential for better understanding of the pathophysiology of TBI in humans in order to develop novel therapeutic strategies [68]. The monitoring of the alterations in CBF after brain insult using OCTA would contribute to the understanding of the complex TBI path-mechanisms. The first demonstrations of OCTA for monitoring the animal model of TBI have been reported by Jia et al. [69]. Jia and co-workers have monitored revascularization after brain trauma which is an endogenous process for the provision of new blood supply in order to restore the impaired cerebral circulation. Three-month-old five C57BL/6 male mice weighing 20–30 g were anesthetized and then subjected to penetrating brain trauma by inducing a traumatic lesion in the cortex through the cranium. The lesion was created by puncturing a round vertical hole at a point 1.0 mm caudal to bregma, and 2.0 mm lateral from the midline suture through skull using a 21-gauge needle (Fig. 3a). OMAG has been used to image the revascularization progression of the traumatized mice over a one-month period of rehabilitation. Figures 3c shows sequential OMAG images of revascularization during rehabilitation following trauma in a single mouse, where the blood perfusion is totally absent (black hole) in Fig. 3c1, c2 due to the damage to the vessel walls. OMAG signals appeared within the trauma region by week 2, indicating the formation of new functional vessels and continued to increase until week 3. Some veins (green arrow in Fig. 3c2) proximal to the injury site were activated after trauma of which function is probably related to promoting the growth of new microvessels.
Fig. 3.

a shows the mouse (CB57BL/6) skin window created for skull-intact OMAG imaging, where a penetrating brain trauma (indicated as a pink dot) was introduced at a region 1.0 mm caudal to bregma and 2.0 mm lateral from the sagittal suture through the skull. SS, sagittal suture; CS, coronal suture; B, bregma; L, lambda. b shows brain tissue damage shown by a histological section across the center of the injury site. c displays OMAG projection images of cerebrovascular perfusion at injured region (green box) during one-month-period of trauma rehabilitation (c0, baseline; c1, 30 min; c2, day 1; and c3–c6, week 1-week 4). All images were reproduced with permission from Ref. [69]. (Color figure online)
Moreover, they have found that the revascularization following brain trauma is more activated for the traumatized mice with soluble epoxide hydrolase (sHE) gene deletion, which showed more pronounced blood volume restored at the lesion site compared to the wild-type mice (CB57BL/6) [69]. It has demonstrated that sHE gene deletion can promote the revascularization earlier than more rapidly in genetically engineered mice than in their wild-type counterparts.
Choi et al. [70] have reported the application of OCTA to study the cranial meninges in brain trauma in vivo. Unlike the most of TBI studies dedicated to the brain cortex, this work has investigated the traumatic injury effect on the meninges of brain that has been poorly studied. Meninges are membranes covering central nervous system (CNS), consisting of three connective tissue layers: dura mater, arachnoid mater, and pia mater [71]. Because of clinical involvement of the structural and vascular deformation in cranial meninges with the head injury [72], investigating the meninges would be helpful for understanding of TBI pathophysiology.
To create the brain trauma, authors have performed skull thinning method to induce a mild bran insult, where an adjacent region of the two parietal bones (a dotted box in Fig. 4a) including a sagittal suture between bregma and lambda on the skull was thinned with drilling at the drill speed of 3200 rpm. It was expected that the mechanical stress on head during the skull thinning could induce acute brain injury by shaking or over-pressing of the skull against the brain. After completion of the skull thinning, transcranial OCT/OMAG imaging has been repeated every 5 min on the thinned area (a dotted box in Fig. 4b) for 2–3 h to observe intracranial change in the structure and blood flow in the cranial meninges. Figure 4c shows representative time-course OCT images of the thinned skull at 17, 32, and 82 min after thinning. Interesting finding has been observed; the subdural space (SDS) in the meninges was opened and continued to be widened until 32 min and then the opening was gradually closed. Authors supposed that such virtual cavity in the cranial meninges may be created by acute subdural hematoma resulting from the rupture of bridging veins [73] or traumatic tearing of the arachnoid mater (AM) [74] induced by skull thinning and disappeared as a recovery process within hours.
Fig. 4.
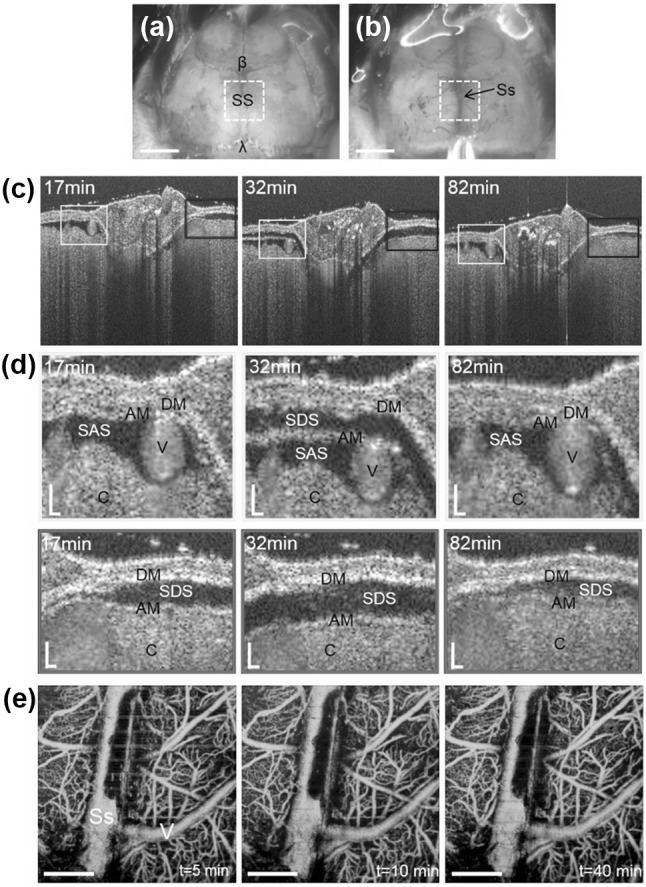
Microphotographs of the skull of a C57BL/6 mouse before (a) and after thinned-skull surgery (b). The skull thinning was performed on an adjacent region between the two parietal bones including a sagittal suture (SS) between bregma (β) and lambda (λ) (dotted boxes (2 mm × 2 mm) in (a) and (b)). In b, a superior sagittal sinus (Ss) running along the SS and its branch vessels under the skull-thinned region are visible. Scale bars: 2 mm. c Time-course OCT images of the thinned-skull area obtained at 17, 32, and 82 min post skull thinning. d Close-up views of boxed areas in (c), showing the apparent changes in the meningeal spaces at different time points. DM, dura mater; AM, arachnoid matter; SAS, subarachnoid spaces; SDS, subdural space (virtual space); V, vessel; C, cerebral cortex. Scale bars: 20 μm. e Time-course OMAG projection images of the thinned-skull at 5, 10, and 40 min after skull thinning. Ss, sagittal sinus; V, vein. Scale bars: 0.5 mm. All images were reproduced with permission from Ref. [70]
However, authors could not observe significant change in the cerebral blood perfusion around the injury site as shown in OMAG projection images (Fig. 4e) at 5, 10, and 40 min post skull thinning, delineating cerebral microvasculatures such as sagittal sinus (Ss), surface veins (V) and capillaries. This indicates that the brain injury by skull thinning would not lead critical disruption in the cerebral circulation other than meningeal structures [70]. The findings suggested a promise of OCTA as an effective tool to monitor the mechanical trauma in the small animal model of brain injury.
Cerebral stroke
A cerebral stroke occurs when the blood supply to brain compartments is interrupted or dramatically reduced, depriving brain tissue of oxygen and energy [75]. There are two main types of cerebral stroke [76]: ischemic, due to the interruption of blood supply by the blockage of blood vessel that is caused by a blood clot in a major cerebral artery, and hemorrhagic, due to bleeding of blood by rupture of blood vessel. Approximately 80% of strokes in occurrence are ischemic in nature. In the ischemic stroke, vascular occlusion results in a sequence of complex biophysical and neuronal events termed ischemic cascade [77], leading to irreversible tissue injury (infarction) and the ischemic penumbra, the surrounding of the infarcted core which is potentially salvageable if an appropriate treatment is administered [78].
A variety of animal stroke models have been developed and intensively used for stroke studies for identifying the mechanisms underlying cerebral ischemia and developing new agents for stroke therapy [79, 80]. In recent few years, OCTA has been utilized to investigate the cerebral ischemic lesions in the experimental ischemic stroke in vivo. The first animal stroke study using OCTA has been demonstrated by Jia and Wang [81]. The authors have reported the applications of the original version of OMAG [45] in mouse ischemic stroke model in order to monitor alteration in regional CBF in the ischemic brain after onset of the stroke. In this work, ischemic stroke has been induced in adult male mice (C57/616, three-month-old, 20–30 g weights) using intraluminal middle cerebral artery occlusion (MCAO) technique [82]. In brief, a silicon-coated 60 nylon monofilament was inserted into the right internal carotid artery (ICA) via the external carotid artery (ECA) until it blocked the middle cerebral artery (MCA). In order to monitor the CBF over large area of the cortex, the scan was performed clockwise through intact skull that resulted in six OMAG images covering whole head. Total imaging time was less than 10 min.
Figure 5a–c show OMAG projection images of baseline (no MCA occluded), at 30 min after the application of MCAO, and after 30 min onset of reperfusion (c), respectively. Compared to the baseline, the significant drop of blood perfusion in the ipsilateral region of cortex was apparent in Fig. 5b. After 30 min onset of reperfusion, the blood perfusion in the ipsilateral side was restored in some region but the rest of regions were still occlusive even the filament was removed from MCA [81].
Fig. 5.
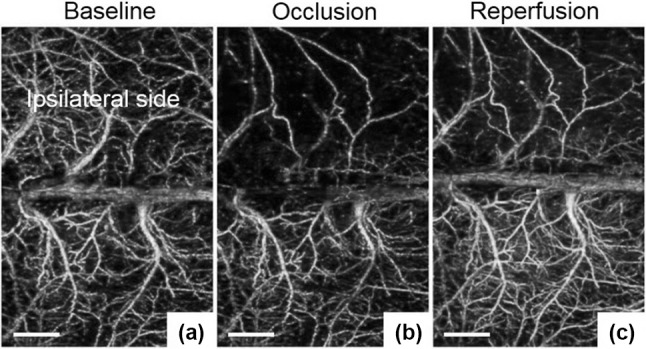
OMAG projection images of the cortex in focal ischemic stroke. a baseline, b taken at 30 min onset of MCAO, and c after 30 min onset of reperfusion. In c, the blood perfusion in ipsilateral side was recovered to baseline in some region, while the residual occlusion was still apparent. White bars: 1 mm. All images were reproduced with permission from Ref. [81]
A more comprehensive study using ischemic stroke model has been reported by Srinivasan et al. [83]. Similar to the work that Jia et al. have done [81], authors have monitored bran injury progression in mouse cortex under ischemia but using several parameters derived intrinsic optical scattering properties of cortical tissue: blood perfusion, blood flow rate, and tissue attenuation. In this work, two experimental stroke models, transient MCAO using filament (the same one mentioned above) and permanent distal MCAO (dMCAO) models (where a distal MCA was occluded with microbiopolar coagulation) have been investigated with longitudinal (one-week) OCT imaging. Thinned-skull, glass coverslip-reinforced cranial windows [84] have been created in male, 2–4 month old C57BL/6 mice and the second version of OMAG [46] has been used for OCTA processing.
Their work has shown interesting results as Fig. 6. Compared to baseline (Fig. 6a), during MCAO, a clearly defined region devoid of perfused capillaries was observed in the lateral potion of the cranial window (Fig. 6b), similar to Fig. 5b. However, 1 h after reperfusion (after filament withdrawal), blood perfusion returned to the capillaries in this region (Fig. 6c). Additionally, they have investigated changes in cellular scattering during these periods as shown in Fig. 6d–f which is tissue attenuation coefficient maps obtained from a polynomial fitting of the natural logarithm of the OCT signal in depth [10]. Figure 6f showed significant changes in the cortical scattering properties on the later side which was spatially correlated with the capillary non-perfusion area (solid white line) during occlusion in Fig. 6b. In comparison of immunohistochemistry, they demonstrated that the changes in scattering properties (i.e., the drop of attenuation coefficients in Fig. 6f) was attribute to a transition to aberrant cellular morphology at the ipsilateral lesion boundary, potentially explaining the observed OCT signal changes. Further measurements of regional blood flow rate in both MCA and ACA territories at baseline (Fig. 6g), during MCAO (Fig. 6h), and after reperfusion (Fig. 6i), showed similar trend to the corresponding angiogram (Fig. 6a–c).
Fig. 6.

Multi-parametric OCT imaging of experimental ischemic stroke. a–c OCT angiograms at baseline (a), during MCAO (b), and 1 h after reperfusion (c). During occlusion (b) a capillary perfusion was dramatically dropped, creating the capillary non-perfusion region in the lateral potion of the cranial window (demarcated as a solid white line) but after reperfusion, the capillary perfusion was restored to baseline level (c). d–f Tissue attenuation coefficient images at baseline (d), during MCAO (e), and 1 h after reperfusion f exhibit time-course changes in scattering properties of cortical tissue. g–i Absolute blood flow maps at baseline (g), during MCAO (h), and 1 h after reperfusion (i) show evolution of spatially heterogeneous flow during MCAO and after reperfusion corresponding to the changes in capillary perfusion in angiograms (a–c). All images were reproduced with permission from Ref. [83]
Furthermore, in 2015, Liu et al. have investigated an effect of diabetes on collateral dynamics in acute ischemic stroke [85]. Collateral flow plays a crucial role to maintain cerebral perfusion during cerebral ischemia, [86, 87] and it is suggested that the collateral flow dynamics are influenced by diabetes. Using Doppler OMAG (DOMAG), an extension of OMAG to measure bi-directional blood flow velocities [88], a recruitment of leptomeningeal collateral flow has been observed after MCAO in male C57BL/6, Type 2 diabetic db/db mice and wild type mice. Their DOMAG results have shown that a robust recruitment of collateral flow after MCAO in the wild type mice, while an impairment of collateral recruitment was evident in the Type 2 diabetic db/db mice. Their work suggested that the impaired collateral status contributes to the exacerbated ischemic injury in mice with Type 2 diabetes.
Moreover, Baran et al. [89] has investigated another collateral flow dynamics (arterio-arteriolar anastomosis (AAA)) regulating blood perfusion through penetrating arterioles during ischemic stroke using the second version of OMAG. They have found increase in vascular tones of the diving arterioles near dilated AAA after MCA occlusion, feeding the blood to the ischemic region. The finding suggested that AAAs play a major role in prompting the dilation of the penetrating vessels, thus compensating blood perfusion in the ischemic lesion [89].
Aging brain
It is well known that aging is closely associated with significant changes in cerebral vascular anatomy and function in human brains. Although many neuroscientists have studied the age-related alterations in brain’s vasculatures and blood flow over the last few decades [90–92], in vivo observation in aging brains is quite challenging due to the limitation of spatial resolution of the conventional imaging modalities so that the impact of aging on the cerebral microvasculatures including cerebral capillaries has been poorly understood up do dates.
Very recently, Li and Choi et al. [93] have reported utilization of OCTA to examine characteristics of the cerebral microvasculatures and hemodynamics in normal aging using aged mice in vivo. In this work, authors have adopted a multi-parametric OCT platform that has been used in the stroke study by Srinivasan et al. [83] to acquire quantitative cerebrovascular metrics including cortical vascular morphology, CBF, and capillary flow velocity on the mouse cortex. Young (two-month-old) and old (16-months-old) male C57BL/6 mice were prepared for a serial of OCT, OMAG, DOMAG, capillary velocimetry measurements. They have revealed that the compared to young mice, the pial arterial tortuosity was increased by 14%, the capillary density was decreased by 15%, CBF was reduced by 33%, and capillary velocity was increased by 21% in old mice, respectively (see Fig. 7). The results suggested a promise of OCTA as a new neuroimaging tool to study vascular aging, which may benefit neuroscientists to investigate vascular factors contributing to the pathophysiology of age-associated brain disorders such as Alzheimer’s disease.
Fig. 7.
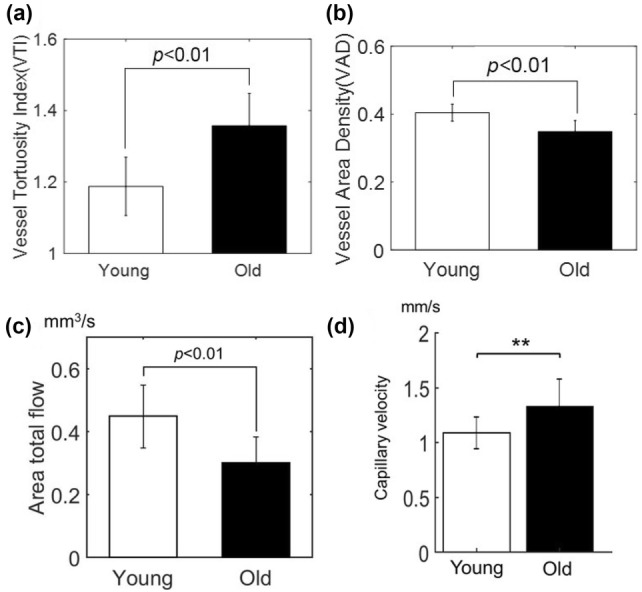
The results of multi-parametric OCT imaging of young and old mice on a single OCT platform. The graphs show comparison of arterial vessel tortuosity (a), capillary vessel density (b), area total flow of penetrating arterioles (c), and capillary mean velocity between young and old mice, respectively. **p < 0.01. All images were reproduced with permission from Ref. [93]
Discussion and outlooks
Although the advent of OCTA technology has shed light on new findings in preclinical neuroimaging which have been challenging to obtain with existing optical and non-optical imaging manners, there are some caveats to be noted and be addressed which is three-fold:
First, the most of small animal OCTA studies are limited to anesthetized conditions in which anesthetic substances used for anesthesia of rodents may affect cerebral circulation during OCTA measurements. Many documents have reported that the use of anesthesia is problematic since anesthetics are neuromodulators and vasodilators, and therefore likely to alter/impact on cerebral blood flow (CBF) and cerebral metabolic rate of oxygen (CMRO2) [94–96]. In OCTA imaging of rodent brains, used isoflurane may dilate cerebral vessels and inconsistent depths of anesthesia may introduce variability in vasoreactivity between imaging session. Moreover, for aging brain study [93], since anesthesia may have different effects in young and old animals, it may introduce a confounding effect in aging studies.
Due to the limitations associated with anesthetized imaging, recent efforts have been made to conduct rodent imaging studies in awake animals, habituated to the restraint systems aimed at reducing body motion and restrain-related stress in murine [97]. Adoption of these systems instead of anesthesia are beneficial in OCTA imaging, allowing for awake mouse imaging with advantages of eliminating the confounding factors brought about by anesthetic agents.
Second, vascular tones and capillary changes depicted by OCTA must be interpreted with caution. Typically, vessel diameter is defined by the distance between two edges of the vessel lumen. According to the Fåhræus–Lindqvist phenomenon [98], the plasma layers devoid of blood cells can be present near the wall of the vessel and its size is shear stress dependent. In OCT angiograms, the vessel diameter is inferred from the width of the perfused region, entirely contributed by dynamic scattering blood contents (i.e., blood cells). Since OCT angiogram can be influenced by changes in the shear stress of blood flow, therefore, the vessel diameter measured from OCT angiogram may be different from the true (physical) vessel diameter.
Capillaries measured from OCT angiogram may be different from true capillaries because some of capillaries may be collapsed or slowly perfused by latent blood cells or not perfused at all but otherwise intact. Considering OCTA is perfusion imaging technique, this is not a suitable technique for measuring the distribution of capillary vessels under conditions of severe hypoperfusion such as cerebral ischemia, where capillaries are effectively invisible in OCT angiogram.
Third, a depth to perceive the blood vessels in OCTA image is limited to within cortical region below the brain surface for an adult mouse. There are possible reasons that current OCTA is not able to visualize the vessel architectures below the cerebral cortex: (1) strong light scattering through highly heterogeneous cortical tissues, resulting in significant decrease in backscattering contrast over depth and (2) progressive drop off in the signal sensitivity at larger depth which is an inherent challenge for conventional FD-OCT. These tissue scattering event and system characteristic have precluded observation of cellular and vascular morphology in the subcortical brain regions such as hippocampus, where many pathologies (i.e., dementia) originate.
However, recent OCTA results have potentially mitigated the imaging depth limit by using light sources at wavelengths beyond 1.3 μm, considering the fact that the biological tissue scattering decreases with wavelength. Chong et al. [17] have firstly demonstrated spectral domain OCTA imaging of subcortical white matter microvasculatures through the cranial window models of mice using a 1.7 μm supercontinuum light source. In this work, they have validated that OCT penetration depth in the rodent brain could be improved at 1.7 μm compared to visible and 1.3 μm wavelength ranges despite of water-rich contents in the brain. The benefit of the longer wavelength for deep brain imaging has been also demonstrated by Park et al. [99]. They have employed a 1.7 μm SS-OCT that could fulfill the improvements in both of penetration depth and sensitivity roll-off superior to SD-OCT (less than 2 dB at a 4 mm in air), enabling extension of OCTA imaging regime into the hippocampus of mouse brain in vivo. Meanwhile, Choi et al. [100] have also reported dramatic improvement in the penetration depth of mouse brain at a 1.3 μm wavelength range, in which they have used SS-OCT with a MEMS-tunable vertical cavity emitting laser (VCSEL). Due to the single longitudinal mode operation of VCSEL, supporting a long coherence length (> 100 mm) of light waves, VCSEL powered SS-OCT has offered a constant signal sensitivity (105 dB) throughout a depth of 4.25 mm in air which has ensured OCT imaging of a 2.3-mm-deep rodent brain including hippocampus although vasculatures in the subcortical region were not shown in this work.
Despite of the caveats in mind, OCTA must be an attractive and powerful tool for small animal researches in neuroimaging field because OCTA is able to offer complementary and insightful information regarding highly complex microcirculation dynamics in live rodent brain with no artificial dyes. Although it has not been witnessed in clinical settings in neurology, we foresee that OCTA would become an indispensable, yet cost-effective (< $50,000) neuroimaging tool to evaluate the changes in tissue morphology and hemodynamics following pharmacological interventions in laboratory animals for the development of new therapies for human brain diseases.
Acknowledgements
This research was supported by the Chung-Ang University Research Grants in 2018.
Funding
This study was funded by the Chung-Ang University Research Grants in 2018.
Compliance with ethical standards
Conflict of interest
Dr. Choi has no conflicts of interest to declare.
Ethical approval
This article does not contain any studies with human participants or animals performed by any of the authors.
Footnotes
Publisher's Note
Springer Nature remains neutral with regard to jurisdictional claims in published maps and institutional affiliations.
References
- 1.Huang D, Swanson EA, Lin CP, Schuman JS, Stinson WG, Chang W, Hee MR, Flotte T, Gregory K, Puliafito CA, et al. Optical coherence tomography. Science. 1991;254(5035):1178–1181. doi: 10.1126/science.1957169. [DOI] [PMC free article] [PubMed] [Google Scholar]
- 2.Drexler W, Fujimoto JG. State-of-the-art retinal optical coherence tomography. Prog Retin Eye Res. 2008;27(1):45–88. doi: 10.1016/j.preteyeres.2007.07.005. [DOI] [PubMed] [Google Scholar]
- 3.Klein T, Wieser W, Reznicek L, Neubauer A, Kampik A, Huber R. Multi-MHz retinal OCT. Biomed Opt Express. 2013;4(10):1890–1908. doi: 10.1364/BOE.4.001890. [DOI] [PMC free article] [PubMed] [Google Scholar]
- 4.Drexler W. Ultrahigh-resolution optical coherence tomography. J Biomed Opt. 2004;9(1):47–74. doi: 10.1117/1.1629679. [DOI] [PubMed] [Google Scholar]
- 5.Choi WJ, Wang RK. Swept-source optical coherence tomography powered by a 1.3-μm vertical cavity surface emitting laser enables 2.3-mm-deep brain imaging in mice in vivo. J Biomed Opt. 2015;20(10):106004. doi: 10.1117/1.JBO.20.10.106004. [DOI] [PMC free article] [PubMed] [Google Scholar]
- 6.Klein T, Huber R. High-speed OCT light sources and systems. Biomed Opt Express. 2017;8(2):828–859. doi: 10.1364/BOE.8.000828. [DOI] [PMC free article] [PubMed] [Google Scholar]
- 7.Adler DC, Huber R, Fujimoto JG. Phase-sensitive optical coherence tomography at up to 370,000 lines per second using buffered Fourier domain mode-locked lasers. Opt Lett. 2007;32(6):626–628. doi: 10.1364/ol.32.000626. [DOI] [PubMed] [Google Scholar]
- 8.de Boer JF, Hitzenberger CK, Yasuno Y. Polarization sensitive optical coherence tomography—a review. Biomed Opt Express. 2017;8(3):1838–1873. doi: 10.1364/BOE.8.001838. [DOI] [PMC free article] [PubMed] [Google Scholar]
- 9.Uhlhorn SR, Borja D, Manns F, Parel JM. Refractive index measurement of the isolated crystalline lens using optical coherence tomography. Vis Res. 2008;48(27):2732–2738. doi: 10.1016/j.visres.2008.09.010. [DOI] [PMC free article] [PubMed] [Google Scholar]
- 10.Faber DJ, van der Meer F, Aalders M, van Leeuwen T. Quantitative measurement of attenuation coefficients of weakly scattering media using optical coherence tomography. Opt Express. 2004;12(19):4353–4365. doi: 10.1364/opex.12.004353. [DOI] [PubMed] [Google Scholar]
- 11.Leitgeb RA, Werkmeister RM, Blatter C, Schmetterer L. Doppler optical coherence tomography. Prog Retin Eye Res. 2014;41(100):26–43. doi: 10.1016/j.preteyeres.2014.03.004. [DOI] [PMC free article] [PubMed] [Google Scholar]
- 12.Lee J, Wu W, Jiang JY, Zhu B, Boas DA. Dynamic light scattering optical coherence tomography. Opt Express. 2012;20(20):22262–22277. doi: 10.1364/OE.20.022262. [DOI] [PMC free article] [PubMed] [Google Scholar]
- 13.Kim J, Brown W, Maher JR, Levinson H, Wax A. Functional optical coherence tomography: principles and progress. Phys Med Biol. 2015;60(10):R211–R237. doi: 10.1088/0031-9155/60/10/R211. [DOI] [PMC free article] [PubMed] [Google Scholar]
- 14.de Carlo TE, Romano A, Waheed NK, Duker JS. A review of optical coherence tomography angiography (OCTA) Int J Retin Vitr. 2015;1:5. doi: 10.1186/s40942-015-0005-8. [DOI] [PMC free article] [PubMed] [Google Scholar]
- 15.Tan ACS, Tan GS, Denniston AK, Keane PA, Ang M, Milea D, Chakravarthy U, Cheung CMG. An overview of the clinical applications of optical coherence tomography angiography. Eye. 2018;32(2):262–286. doi: 10.1038/eye.2017.181. [DOI] [PMC free article] [PubMed] [Google Scholar]
- 16.Spaide RF, Klancnik JM, Jr, Cooney MJ. Retinal vascular layers imaged by fluorescein angiography and optical coherence tomography angiography. JAMA Ophthalmol. 2015;133(1):45–50. doi: 10.1001/jamaophthalmol.2014.3616. [DOI] [PubMed] [Google Scholar]
- 17.Chong SP, Merkle CW, Cooke DF, Zhang T, Radhakrishnan H, Krubitzer L, Srinivasan VJ. Noninvasive, in vivo imaging of subcortical mouse brain region with 1.7 μm optical coherence tomography. Opt Lett. 2015;40(21):4911–4914. doi: 10.1364/OL.40.004911. [DOI] [PMC free article] [PubMed] [Google Scholar]
- 18.Ren H, Du C, Yuan Z, Park K, Volkow ND, Pan Y. Cocaine induced cortical microischemia in the rodent brain: clinical implications. Mol Psychiatr. 2012;17(10):1017–1025. doi: 10.1038/mp.2011.160. [DOI] [PMC free article] [PubMed] [Google Scholar]
- 19.Zhang A, Zhang Q, Chen CL, Wang RK. Methods and algorithms for optical coherence tomography-based angiography: a review and comparison. J Biomed Opt. 2015;20(10):100901. doi: 10.1117/1.JBO.20.10.100901. [DOI] [PMC free article] [PubMed] [Google Scholar]
- 20.Chen CL, Wang RK. Optical coherence tomography based angiography. Biomed Opt Express. 2017;8(2):1056–1082. doi: 10.1364/BOE.8.001056. [DOI] [PMC free article] [PubMed] [Google Scholar]
- 21.Kashani AH, Chen CL, Gahm JK, Zheng F, Richter GM, Rosenfeld PJ, Shi Y, Wang RK. Optical coherence tomography angiography: a comprehensive review of current methods and clinical applications. Prog Retin Eye Res. 2017;60:66–100. doi: 10.1016/j.preteyeres.2017.07.002. [DOI] [PMC free article] [PubMed] [Google Scholar]
- 22.Leitgeb RA, Drexler W, Unterhuber A, Hermann B, Bajraszewski T, Stingl LA, Fercher AF. Ultrahigh resolution Fourier domain optical coherence tomography. Opt Express. 2004;12(10):2156–2165. doi: 10.1364/opex.12.002156. [DOI] [PubMed] [Google Scholar]
- 23.Kolb JP, Pfeiffer T, Eibl M, Hakert H, Huber R. High-resolution retinal swept-source optical coherence tomography with an ultra-wideband Fourier-domain mode-locked laser at MHz A-scan rates. Biomed Opt Express. 2018;9(1):120–130. doi: 10.1364/BOE.9.000120. [DOI] [PMC free article] [PubMed] [Google Scholar]
- 24.Ling Y, Gan Y, Yao X, Hendon CP. Phase-noise analysis of swept-source optical coherence tomography. Opt Lett. 2017;42(7):1333–1336. doi: 10.1364/OL.42.001333. [DOI] [PMC free article] [PubMed] [Google Scholar]
- 25.Liu G, Tan O, Gao SS, Pechauer AD, Lee B, Lu CD, Fujimoto JG, Huang D. Postprocessing algorithms to minimize fixed-pattern artifact and reduce trigger jitter in swept-source optical coherence tomography. Opt Express. 2015;23(8):9824–9834. doi: 10.1364/OE.23.009824. [DOI] [PMC free article] [PubMed] [Google Scholar]
- 26.Dupire J, Socol M, Viallat A. Fully dynamics of a red blood cell in shear flow. Proc Natl Acad Sci USA. 2012;109(51):20808–20813. doi: 10.1073/pnas.1210236109. [DOI] [PMC free article] [PubMed] [Google Scholar]
- 27.Makita S, Hong Y, Yamanari M, Yatagi T, Yasuno Y. Optical coherence angiography. Opt Express. 2006;14(17):7821–7840. doi: 10.1364/oe.14.007821. [DOI] [PubMed] [Google Scholar]
- 28.Zhang J, Chen Z. In vivo blood flow imaging by a swept laser source based Fourier domain optical Doppler tomography. Opt Express. 2005;13(19):7449–7457. doi: 10.1364/opex.13.007449. [DOI] [PubMed] [Google Scholar]
- 29.Fingler J, Readhead C, Schwartz DM, Fraser SE. Phase-contrast OCT imaging of transverse flows in the mouse retina and choroid. Invest Ophthalmol Vis Sci. 2008;49(11):5055–5059. doi: 10.1167/iovs.07-1627. [DOI] [PubMed] [Google Scholar]
- 30.Schwartz DM, Fingler J, Kim DY, Zawadzki RJ, Morse LS, Park SS, Fraser SE, Werner JS. Phase-variance optical coherence tomography: a technique for noninvasive angiography. Ophthalmology. 2014;121(1):180–187. doi: 10.1016/j.ophtha.2013.09.002. [DOI] [PMC free article] [PubMed] [Google Scholar]
- 31.Yun SH, Tearney GJ, de Boer JF, Bouma BE. Motion artifacts in optical coherence tomography with frequency-domain ranging. Opt Express. 2004;12(13):2977–2998. doi: 10.1364/opex.12.002977. [DOI] [PMC free article] [PubMed] [Google Scholar]
- 32.Song S, Xu J, Men S, Shen TT, Wang RK. Robust numerical phase stabilization for long-range swept-source optical coherence tomography. J Biophotonics. 2017;10(11):1398–1410. doi: 10.1002/jbio.201700034. [DOI] [PMC free article] [PubMed] [Google Scholar]
- 33.Chen Z, Liu M, Minneman M, Ginner L, Hoover E, Sattmann H, Bonesi M, Drexler W, Leitgeb RA. Phase-stable swept source OCT angiography in human skin using an akinetic source. Biomed Opt Express. 2016;7(8):3032–3048. doi: 10.1364/BOE.7.003032. [DOI] [PMC free article] [PubMed] [Google Scholar]
- 34.Mariampillai A, Standish BA, Moriyama EH, Khurana M, Munce NR, Leung MKK, Jiang J, Cable A, Wilson BC, Vitkin IA, Yang VXD. Speckle variance detection of microvasculature using swept-source optical coherence tomography. Opt Lett. 2008;33(13):1530–1532. doi: 10.1364/ol.33.001530. [DOI] [PubMed] [Google Scholar]
- 35.Enfield J, Jonathan E, Leahy M. In vivo imaging of the microcirculation of the volar forearm using correlation mapping optical coherence tomography (cmOCT) Biomed Opt Express. 2011;2(5):1184–1193. doi: 10.1364/BOE.2.001184. [DOI] [PMC free article] [PubMed] [Google Scholar]
- 36.Jia Y, Tan O, Tokayer J, Potsaid B, Wang Y, Liu JJ, Kraus MF, Subhash H, Fujimoto JG, Hornegger J, Huang D. Split-spectrum amplitude decorrelation angiography with optical coherence tomography. Opt Express. 2012;20(4):4710–4725. doi: 10.1364/OE.20.004710. [DOI] [PMC free article] [PubMed] [Google Scholar]
- 37.Boas DA. Laser speckle contrast imaging in biomedical optics. J Biomed Opt. 2010;15(1):011109. doi: 10.1117/1.3285504. [DOI] [PMC free article] [PubMed] [Google Scholar]
- 38.Barton JK, Stromski S. Flow measurement without phase information in optical coherence tomography images. Opt Express. 2005;13(14):5234–5239. doi: 10.1364/opex.13.005234. [DOI] [PubMed] [Google Scholar]
- 39.Xu J, Han S, Balaratnasingam C, Mammo Z, Wong KS, Lee S, Cua M, Young M, Kirker A, Albiani D, et al. Retinal angiography with real-time speckle variance optical coherence tomography. Br J Ophthalmol. 2015;99(10):1315–1319. doi: 10.1136/bjophthalmol-2014-306010. [DOI] [PubMed] [Google Scholar]
- 40.Markowitz O, Schwartz M, Minhas S, Siegel DM. Speckle-variance optical coherence tomography: a novel approach to skin cancer characterization using vascular patterns. Dermatol Online J. 2016;22(4):pii: 13030/qt7w10290r. [PubMed] [Google Scholar]
- 41.Cadotte DW, Mariampillai A, Cadotte A, Lee KKC, Kiehl TR, Wilson BC, Fehlings MG, Yang VXD. Speckle variance optical coherence tomography of the rodent spinal cord: in vivo feasibility. Biomed Opt Express. 2012;3(5):911–919. doi: 10.1364/BOE.3.000911. [DOI] [PMC free article] [PubMed] [Google Scholar]
- 42.Grishina O, Wang S, Larina IV. Speckle variance optical coherence tomography of blood flow in the beating mouse embryonic heart. J Biophotonics. 2017;10(5):735–743. doi: 10.1002/jbio.201600293. [DOI] [PMC free article] [PubMed] [Google Scholar]
- 43.Choi WJ, Reif R, Yousefi S, Wang RK. Improved microcirculation imaging of human skin in vivo using optical microangiography with a correlation mapping mask. J Biomed Opt. 2014;19(3):036010. doi: 10.1117/1.JBO.19.3.036010. [DOI] [PMC free article] [PubMed] [Google Scholar]
- 44.Gao SS, Liu G, Huang D, Jia Y. Optimization of the split-spectrum amplitude-decorrelation angiography algorithm on a spectral optical coherence tomography system. Opt Lett. 2015;40(10):2305–2308. doi: 10.1364/OL.40.002305. [DOI] [PMC free article] [PubMed] [Google Scholar]
- 45.Wang RK, Jacques SL, Ma Z, Hurst S, Hanson SR, Gruber A. Three dimensional optical angiography. Opt Express. 2007;15(7):4083–4097. doi: 10.1364/oe.15.004083. [DOI] [PubMed] [Google Scholar]
- 46.An L, Qin J, Wang RK. Ultrahigh sensitive optical microangiography for in vivo imaging of microcirculations within human skin tissue beds. Opt Express. 2010;18(8):8220–8228. doi: 10.1364/OE.18.008220. [DOI] [PMC free article] [PubMed] [Google Scholar]
- 47.Li T, Raizen MG. Brownian motion at short time scales. Ann Phys. 2013;525(4):281–295. [Google Scholar]
- 48.Wang RK, Zhang A, Choi WJ, Zhang Q, Chen CL, Miller A, Gregori G, Rosenfeld PJ. Wide-field optical coherence tomography angiography enabled by two repeated measurements of B-scans. Opt Lett. 2016;41(10):2330–2333. doi: 10.1364/OL.41.002330. [DOI] [PMC free article] [PubMed] [Google Scholar]
- 49.Yousefi S, Zhi Z, Wang RK. Eigendecomposition-based clutter filtering technique for optical microangiography. IEEE Trans Biomed Eng. 2011;58(8):2316–2323. doi: 10.1109/TBME.2011.2152839. [DOI] [PMC free article] [PubMed] [Google Scholar]
- 50.Yousefi S, Qin J, Wang RK. Super-resolution spectral estimation of optical micro-angiography for quantifying blood flow within microcirculatory tissue beds in vivo. Biomed Opt Express. 2013;4(7):1214–1228. doi: 10.1364/BOE.4.001214. [DOI] [PMC free article] [PubMed] [Google Scholar]
- 51.Zhang Q, Wang J, Wang RK. Highly efficient eigen decomposition based statistical optical microangiography. Quant Imaging Med Surg. 2016;6(5):557–563. doi: 10.21037/qims.2016.10.03. [DOI] [PMC free article] [PubMed] [Google Scholar]
- 52.Nam AS, Chico-Calero I, Vakoc BJ. Complex differential variance algorithm for optical coherence tomography angiography. Biomed Opt Express. 2014;5(11):3822–3832. doi: 10.1364/BOE.5.003822. [DOI] [PMC free article] [PubMed] [Google Scholar]
- 53.Braaf B, Donner S, Nam AS, Bouma BE, Vakoc BJ. Complex differential variance angiography with noise-bias correction for optical coherence tomography of the retina. Biomed Opt Express. 2018;9(2):486–506. doi: 10.1364/BOE.9.000486. [DOI] [PMC free article] [PubMed] [Google Scholar]
- 54.Xu J, Song S, Li Y, Wang RK. Complex-based OCT angiography algorithm recovers microvascular information better than amplitude- or phase-based algorithms in phase-stable systems. Phys Med Biol. 2017;63(1):015023. doi: 10.1088/1361-6560/aa94bc. [DOI] [PMC free article] [PubMed] [Google Scholar]
- 55.Vakoc BJ, Yun SH, de Boer JF, Tearney GJ, Bouma BE. Phase-resolved optical frequency domain imaging. Opt Express. 2005;13(14):5483–5493. doi: 10.1364/opex.13.005483. [DOI] [PMC free article] [PubMed] [Google Scholar]
- 56.Baumann B, et al. Total retinal blood flow measurement with ultrahigh speed swept source/Fourier domain OCT. Biomed Opt Express. 2011;2(6):1539–1552. doi: 10.1364/BOE.2.001539. [DOI] [PMC free article] [PubMed] [Google Scholar]
- 57.Huber R, Wojtkowski M, Fujimoto GJ, Jiang JY, Cable AE. Three-dimensional and C-mode OCT imaging with a compact, frequency swept laser source at 1300 nm. Opt Express. 2005;13(26):10523–10538. doi: 10.1364/opex.13.010523. [DOI] [PubMed] [Google Scholar]
- 58.Braaf B, Vermeer KA, Sicam VADP, van Zeeburg E, van Meurs JC, de Boer JF. Phase-stabilized optical frequency domain imaging at 1-μm for the measurement of blood flow in the human choroid. Opt Express. 2011;19(21):20886–20903. doi: 10.1364/OE.19.020886. [DOI] [PubMed] [Google Scholar]
- 59.Hong YJ, Makita S, Jaillon F, Ju MJ, Min EJ, Lee BH, Itoh M, Miura M, Yasuno Y. High-penetration swept source Doppler optical coherence angiography by fully numerical phase stabilization. Opt Express. 2012;20(3):2740–2760. doi: 10.1364/OE.20.002740. [DOI] [PubMed] [Google Scholar]
- 60.Motaghiannezam SMR, Koos D, Fraiser SE. Differential phase-contrast, swept-source optical coherence tomography at 1060 nm for in vivo human retinal and choroidal vasculature visualization. J Biomed Opt. 2012;17(2):026011. doi: 10.1117/1.JBO.17.2.026011. [DOI] [PubMed] [Google Scholar]
- 61.Deegan AJ, et al. Optical coherence tomography angiography of normal skin and inflammatory dermatologic conditions. Lasers Surg Med. 2018;50(3):183–193. doi: 10.1002/lsm.22788. [DOI] [PMC free article] [PubMed] [Google Scholar]
- 62.Vincent TJ, Thiessen JD, Kurjewicz LM, Germscheid SL, Turner AJ, Zhilkin P, Alexander ME, Martin M. Longitudinal brain size measurements in App/Ps1 transgenic mice. Magn Reson Insights. 2010;4(4):19–26. [Google Scholar]
- 63.Cova L, Armentero MT. 1980–2011: Parkinson’s disease and advance in stem cell research. 2011. 10.5772/19150.
- 64.Fluri F, Schuhmann K, Kleinschnitz C. Animal models of ischemic stroke and their application in clinical research. Drug Des Dev Ther. 2015;9:3445–3454. doi: 10.2147/DDDT.S56071. [DOI] [PMC free article] [PubMed] [Google Scholar]
- 65.Semple BD, Blomgren K, Gimlin K, Ferriero DM, Noble-Haeusslein LJ. Brain development in rodents and humans: identifying benchmarks of maturation and vulnerability to injury across species. Prog Neurobiol. 2013;106–107:1–16. doi: 10.1016/j.pneurobio.2013.04.001. [DOI] [PMC free article] [PubMed] [Google Scholar]
- 66.Vakoc BJ, Lanning RM, Tyrell JA, Padera TP, Bartlett LA, Stylianopoulos T, Munn LL, Tearney GJ, Fukumura D, Jain RK, Bouma BE. Three-dimensional microscopy of the tumor microenvironment in vivo using optical frequency domain imaging. Nat Med. 2009;15(10):1219–1223. doi: 10.1038/nm.1971. [DOI] [PMC free article] [PubMed] [Google Scholar]
- 67.Werner C, Engelhard K. Pathophysiology of traumatic brain injury. Brit J Anaesth. 2007;99(1):4–9. doi: 10.1093/bja/aem131. [DOI] [PubMed] [Google Scholar]
- 68.Xiong Y, Mahmood A, Chopp M. Animal models of traumatic brain injury. Nat Rev Neurosci. 2013;14(2):128–142. doi: 10.1038/nrn3407. [DOI] [PMC free article] [PubMed] [Google Scholar]
- 69.Jia Y, Grafe MR, Gruber A, Alkayed NJ, Wang RK. In vivo optical imaging of revascularization after brain trauma in mice. Microvasc Res. 2011;81(1):73–80. doi: 10.1016/j.mvr.2010.11.003. [DOI] [PMC free article] [PubMed] [Google Scholar]
- 70.Choi WJ, Wang RK. Optical coherence tomography imaging of cranial meninges post brain injury in vivo. Chin Opt Lett. 2017;15(9):090005. [Google Scholar]
- 71.https://en.wikipedia.org/wiki/Meninges.
- 72.Kolias AG, Chari A, Santarius T, Hutchinson PJ. Chronic subdural haematoma: modern management and emerging therapies. Nat Rev Neurol. 2014;10(10):570–578. doi: 10.1038/nrneurol.2014.163. [DOI] [PubMed] [Google Scholar]
- 73.Yamashima T, Friede RL. Why do bridging veins rupture into the virtual subdural space? J Neurol Neurosurg Psychiatr. 1984;47(2):121–127. doi: 10.1136/jnnp.47.2.121. [DOI] [PMC free article] [PubMed] [Google Scholar]
- 74.Kristof RA, Grimm JM, Stoffel-Wagner B. Cerebrospinal fluid leakage into the subdural space: possible influence on the pathogenesis and recurrence frequency of chronic subdural hematoma and subdural hygroma. J. Neurosurg. 2008;108(2):275–280. doi: 10.3171/JNS/2008/108/2/0275. [DOI] [PubMed] [Google Scholar]
- 75.Deb P, Sharma S, Hassan KM. Pathophysiologic mechanisms of acute ischemic stroke: an overview with emphasis on therapeutic significance beyond thrombolysis. Pathophysiology. 2010;17(3):197–218. doi: 10.1016/j.pathophys.2009.12.001. [DOI] [PubMed] [Google Scholar]
- 76.Andersen KK, Olsen TS, Dehlendorff C, Kammersgaard LP. Hemorrhagic and ischemic strokes compared: stroke severity, mortality, and risk factors. Stroke. 2009;40(6):2068–2072. doi: 10.1161/STROKEAHA.108.540112. [DOI] [PubMed] [Google Scholar]
- 77.Lipton P. Ischemic cell death in brain neurons. Physiol Rev. 1999;79(4):1431–1568. doi: 10.1152/physrev.1999.79.4.1431. [DOI] [PubMed] [Google Scholar]
- 78.Fisher M. The ischemic penumbra: identification, evolution and treatment concepts. Cerebrovasc Dis. 2004;17(suppl 1):1–6. doi: 10.1159/000074790. [DOI] [PubMed] [Google Scholar]
- 79.Casals JB, Pieri NCG, Feitosa MLT, Ercolin ACM, Roballo KCS, Barreto RSN, Bressan FF, Martins DS, Miglino MA, Ambrósio CE. The use of animal models for stroke research: a review. Comp Med. 2011;61(4):305–313. [PMC free article] [PubMed] [Google Scholar]
- 80.Sommer CJ. Ischemic stroke: experimental models and reality. Acta Neuropathol. 2017;133(2):245–261. doi: 10.1007/s00401-017-1667-0. [DOI] [PMC free article] [PubMed] [Google Scholar]
- 81.Jia Y, Wang RK. Optical micro-angiography images structural and functional cerebral blood perfusion in mice with cranium left intact. J Biophotonics. 2011;4(12):57–63. doi: 10.1002/jbio.201000001. [DOI] [PMC free article] [PubMed] [Google Scholar]
- 82.Sampei K, Goto S, Alkayed NJ, Crain BJ, Korach KS, Traystman RJ, Demas GE, Nelson RJ, Hurn PD. Stroke in strogen receptor-α–deficient mice. Stroke. 2000;31(3):738–744. doi: 10.1161/01.str.31.3.738. [DOI] [PubMed] [Google Scholar]
- 83.Srinivasan VJ, Mandeville ET, Can A, Blasi F, Climov M, Daneshmand A, Lee JH, Yu E, Radhakrishnan H, Lo EH, Sakadžić S, Eikermann-Haerter K, Ayata C. Multiparametric, longitudinal optical coherence tomography imaging reveals acute injury and chronic recovery in experimental ischemic stroke. PLoS ONE. 2013;7(8):e71478. doi: 10.1371/journal.pone.0071478. [DOI] [PMC free article] [PubMed] [Google Scholar]
- 84.Shih AY, Mateo C, Drew PJ, Tsai PS, Kleinfeld D. A polished and reinforced thinned-skull window for long-term imaging of the mouse brain. J Vis Exp. 2012;61:pii: 3742. doi: 10.3791/3742. [DOI] [PMC free article] [PubMed] [Google Scholar]
- 85.Akamatsu Y, Nishijima Y, Lee CC, Yang SY, Shi L, An L, Wang RK, Tominaga T, Liu J. Impaired leptomeningeal collateral flow contributes to the poor outcome following experimental stroke in the type 2 diabetic mice. J Neurosci. 2015;35(9):3851–3864. doi: 10.1523/JNEUROSCI.3838-14.2015. [DOI] [PMC free article] [PubMed] [Google Scholar]
- 86.Liebeskind DS. Collateral circulation. Stroke. 2003;34(9):2279–2284. doi: 10.1161/01.STR.0000086465.41263.06. [DOI] [PubMed] [Google Scholar]
- 87.Shuaib A, Butcher K, Mohammad AA, Saggur M, Liebeskind DS. Collateral blood vessels in acute ischaemic stroke: potential therapeutic target”. Lancet Neurol. 2011;10(10):909–921. doi: 10.1016/S1474-4422(11)70195-8. [DOI] [PubMed] [Google Scholar]
- 88.Shi L, Qin J, Reif R, Wang RK. Wide velocity range Doppler optical microangiography using optimized step-scanning protocol with phase variance mask. J Biomed Opt. 2013;18(10):106015. doi: 10.1117/1.JBO.18.10.106015. [DOI] [PMC free article] [PubMed] [Google Scholar]
- 89.Baran U, Li Y, Wang RK. Vasodynamics of pial and penetrating arterioles in relation to arteriolo-arteriolar anastomosis after focal stroke. Neurophotonics. 2015;2(2):025006. doi: 10.1117/1.NPh.2.2.025006. [DOI] [PMC free article] [PubMed] [Google Scholar]
- 90.Peters R. Ageing and the brain. Postgrad Med J. 2006;82(964):84–88. doi: 10.1136/pgmj.2005.036665. [DOI] [PMC free article] [PubMed] [Google Scholar]
- 91.Shaw TG, Mortel KF, Meyer JS, Rogers RL, Hardenberg J, Cutaia MM. Cerebral blood flow changes in benign aging and cerebrovascular disease. Neurology. 1984;34(7):855–862. doi: 10.1212/wnl.34.7.855. [DOI] [PubMed] [Google Scholar]
- 92.Meunier D, Stamatakis EA, Tyler LK. Age-related functional recognization, structural changes, and preserved cognition. Neurobiol Aging. 2014;35(1):42–45. doi: 10.1016/j.neurobiolaging.2013.07.003. [DOI] [PubMed] [Google Scholar]
- 93.Li Y, Choi WJ, Wei W, Song S, Zhang Q, Liu J, Wang RK. Aging-related changes in cerebral vasculature and blood flow as determined by quantitative optical coherence tomography angiography. Neurobiol Aging. 2018;70:148–159. doi: 10.1016/j.neurobiolaging.2018.06.017. [DOI] [PMC free article] [PubMed] [Google Scholar]
- 94.Haensel JX, Spain A, Martin C. A systematic review of physiological methods in rodent pharmacological MRI studies. Psychopharmacology. 2015;232:489–499. doi: 10.1007/s00213-014-3855-0. [DOI] [PMC free article] [PubMed] [Google Scholar]
- 95.Hansen TD, Warner DS, Todd MM, Vust LJ, Trawick DC. Distribution of cerebral blood flow during halothane versus isoflurane anesthesia in rats. Anesthesiology. 1988;69(3):332–337. doi: 10.1097/00000542-198809000-00008. [DOI] [PubMed] [Google Scholar]
- 96.Nakao Y, Itoh Y, Kuang TY, Cook M, Jehle J, Sokoloff L. Effects of anesthesia on functional activation of cerebral blood flow and metabolism. Proc Natl Acad Sci USA. 2001;98(13):7593–7598. doi: 10.1073/pnas.121179898. [DOI] [PMC free article] [PubMed] [Google Scholar]
- 97.Madularu D, Mathieu AP, Kumaragamage C, Reynolds LM, Near J, Flores C, Rajah MN. A non-invasive restraining system for awake mouse imaging. J Neurosci Methods. 2017;287:53–57. doi: 10.1016/j.jneumeth.2017.06.008. [DOI] [PMC free article] [PubMed] [Google Scholar]
- 98.Dintenfass L. Inversion of the Fahraeus–Lindqvist phenomenon in blood flow through capillaries of diminishing radius. Nature. 1967;215(5105):1099–1100. doi: 10.1038/2151099a0. [DOI] [PubMed] [Google Scholar]
- 99.Park KS, Shin JG, Qureshi MM, Chung E, Eom TJ. Deep brain optical coherence tomography angiography in mice: in vivo, noninvasive imaging of hippocampal formation. Sci. Rep. 2018;8(1):11614. doi: 10.1038/s41598-018-29975-6. [DOI] [PMC free article] [PubMed] [Google Scholar]
- 100.Choi WJ, Wang RK. Swept-source optical coherence tomography powered by a 1.3-μm vertical cavity surface emitting laser enables 2.3-mm-deep brain imaging in mice in vivo. J Biomed Opt. 2015;20(10):106004. doi: 10.1117/1.JBO.20.10.106004. [DOI] [PMC free article] [PubMed] [Google Scholar]