Human cytomegalovirus (HCMV) replicates in several cell types throughout the body, causing disease in the absence of an effective immune response. Studies on HCMV require cultured human cells and tissues due to species specificity. In these studies, we investigated the impact of infection on developing three-dimensional cortical organoid tissues, with specific emphasis on cell-type-dependent calcium signaling. Calcium signaling is an essential function during neural differentiation and cortical development. We observed that HCMV infects and spreads within these tissues, ultimately disrupting cortical structure. Infected cells exhibited depleted calcium stores and loss of ATP- and KCl-stimulated calcium signaling while uninfected cells in the population maintained nearly normal responses. Some protection was provided by the viral inhibitor maribavir. Overall, our studies provide new insights into the impact of HCMV on cortical tissue development and function.
KEYWORDS: astrocytes, calcium signaling, cytomegalovirus, maribavir, microcephaly, neural stem cells, neurons, organoids
ABSTRACT
The herpesvirus human cytomegalovirus (HCMV) is a leading cause of congenital birth defects. Infection can result in infants born with a variety of symptoms, including hepatosplenomegaly, microcephaly, and developmental disabilities. Microcephaly is associated with disruptions in the neural progenitor cell (NPC) population. Here, we defined the impact of HCMV infection on neural tissue development and calcium regulation, a critical activity in neural development. Regulation of intracellular calcium involves purinergic receptors and voltage-gated calcium channels (VGCC). HCMV infection compromised the ability of both pathways in NPCs as well as fibroblasts to respond to stimulation. We observed significant drops in basal calcium levels in infected NPCs which were accompanied by loss in VGCC activity and purinergic receptor responses. However, uninfected cells in the population retained responsiveness. Addition of the HCMV inhibitor maribavir reduced viral spread but failed to restore activity in infected cells. To study neural development, we infected three-dimensional cortical organoids with HCMV. Infection spread to a subset of cells over time and disrupted organoid structure, with alterations in developmental and neural layering markers. Organoid-derived infected neurons and astrocytes were unable to respond to stimulation whereas uninfected cells retained nearly normal responses. Maribavir partially restored structural features, including neural rosette formation, and dampened the impact of infection on neural cellular function. Using a tissue model system, we have demonstrated that HCMV alters cortical neural layering and disrupts calcium regulation in infected cells.
IMPORTANCE Human cytomegalovirus (HCMV) replicates in several cell types throughout the body, causing disease in the absence of an effective immune response. Studies on HCMV require cultured human cells and tissues due to species specificity. In these studies, we investigated the impact of infection on developing three-dimensional cortical organoid tissues, with specific emphasis on cell-type-dependent calcium signaling. Calcium signaling is an essential function during neural differentiation and cortical development. We observed that HCMV infects and spreads within these tissues, ultimately disrupting cortical structure. Infected cells exhibited depleted calcium stores and loss of ATP- and KCl-stimulated calcium signaling while uninfected cells in the population maintained nearly normal responses. Some protection was provided by the viral inhibitor maribavir. Overall, our studies provide new insights into the impact of HCMV on cortical tissue development and function.
INTRODUCTION
Infection by the human herpesvirus cytomegalovirus (HCMV) is lifelong and causes a range of illnesses. Infection has the potential to cause life-threatening disease in immunosuppressed individuals, with the greatest concern for patients undergoing organ transplant (reviewed in reference 1). Vertical transmission may also occur, resulting in congenital CMV (cCMV) infection. A fraction of babies born with cCMV infection will have long-term health issues. HCMV is the largest human viral pathogen and is composed of a 235-kbp double-stranded DNA (dsDNA) genome with the potential to express greater than 700 proteins (2–4). The virus infects most of the world population, with the highest percentages observed in low socioeconomic communities. HCMV replicates in diverse human cell types, including fibroblasts, monocytes, endothelial cells, placental cytotrophoblasts, and neural progenitor cells. Infection can result in lytic replication, or the virus can establish a latent state which depends on the cell type. For symptomatic children and adults, HCMV is managed using (val)ganciclovir, cidofovir, and/or foscarnet, all of which inhibit viral DNA synthesis, or letermovir, which targets viral DNA packaging into nucleocapsids (5). However, antiviral resistance occurs for each of these compounds, and there is no FDA-approved therapy for treating expecting mothers with confirmed cCMV infection, making antiviral and vaccine development a major public health priority.
A newborn symptomatic for cCMV infection may exhibit hepatosplenomegaly, small birth weight, petechial lesions, and/or microcephaly (reviewed in reference 6). Formation of microcephaly is likely the result of infection of neural progenitor cells (NPCs) (7). NPCs derived from induced pluripotent stem cells (iPSCs) and fetal stem cells are fully permissive for HCMV infection (8–11), with susceptibility influenced by the degree of differentiation (12, 13). Expression of viral genes has been shown to alter signaling pathways and expression of key development factors, including Notch and Sox2 (14–16), and infection results in abnormal proliferation and differentiation (13, 17, 18). For the pluripotency factor Sox2, expression of HCMV IE1 causes downregulation of Sox2, involving IE1 sequestration of unphosphorylated STAT3 to the nucleus (15, 19). HCMV-infected iPSC-derived neurons also exhibit increased cell death and reduced glutamate-induced calcium (Ca2+) influx due to altered expression of the N-methyl-d-aspartate (NMDA) ion channel (20).
NPCs are a unique cell population that give rise to the main cell types of the central nervous system (CNS). These progenitor cells are crucial for cortical layer development and the formation of functional synapses. A critical mechanism in CNS development is Ca2+ signaling, which modulates NPC differentiation, proliferation, and communication with neighboring cells (21–23). The propagation and generation of these signals rely on ionotropic and metabotropic purinergic receptors as well as voltage-gated calcium and potassium channels. Expression and functionality of these specific receptors and channels have been linked to development and maintenance of the NPC population (21, 24, 25). In the fetal brain, NPCs are in the bilateral subventricular zone aligned with the developing ventricle and express a number of key transcription factors, including Sox2 and Pax6, that are required for maintenance of the progenitor cell pool and subsequent differentiation into the multiple neuronal and glial lineages found in the CNS. Through the process of interkinetic nuclear migration, NPCs migrate from the basal to the apical side to undergo division. Dividing symmetrically produces more progenitors whereas asymmetric division generates a newborn neuron or glial daughter cell. The neurons born by asymmetric division then migrate outward, following radial glia tracts to form cortical layers (26). The developing brain is three-dimensional, consisting of multicellular structures, and development of the human brain can be studied in vitro using iPSC-derived cortical organoids (7). Cortical organoids represent an integrated neural circuit and contain progenitors, neurons, and glia. This model system allows for global assessment of signaling changes, thus improving our understanding of findings in dissociated NPCs. Cortical organoids have been shown to have important similarities to human neural development, including a subventricular zone region, neural differentiation, cortical layering, and transcriptome expression reminiscent of the developing human brain beyond what is achievable in monolayer cell culture methods (7).
HCMV infection of human fibroblasts alters intracellular Ca2+ homeostasis to support viral replication (27–31), and there are several points in the HCMV infection process that induce changes in Ca2+ levels and downstream regulation. For example, early during infection an increase in Ca2+ levels occurs, which has been attributed to the expression of multiple viral proteins. The immediate early gene product pUL37x1 mobilizes Ca2+ from the endoplasmic reticulum (ER), impacting mitochondrial biology and apoptosis (31, 32), with further influences on intracellular Ca2+ homeostasis and apoptosis by a vesicle-associated ion channel, pUS21 (33). Additionally, virion particle binding to the epidermal growth factor (EGF) receptor during the entry process stimulates intracellular Ca2+ release (34). Finally, HCMV-encoded chemokines and chemokine receptors, such as CXCL1-like pUL146 (35) and the G-protein coupled receptor pUS28 (36), influence Ca2+ regulation within the infected cell.
Although it is established that HCMV infection modulates intracellular Ca2+ in fibroblasts and other cell types, the impact of infection on such Ca2+-dependent processes as tissue development, neurogenesis, and cellular response to external stimuli remain unknown. In this work, we evaluate the impact of HCMV on iPSC-derived cortical organoid development and Ca2+ signaling in neurons and astrocytes and find that HCMV infection induces dramatic reductions in tissue organization and terminal differentiation.
RESULTS
Loss of purinergic and voltage-gated Ca2+ channel signaling in HCMV-infected neural progenitor cells.
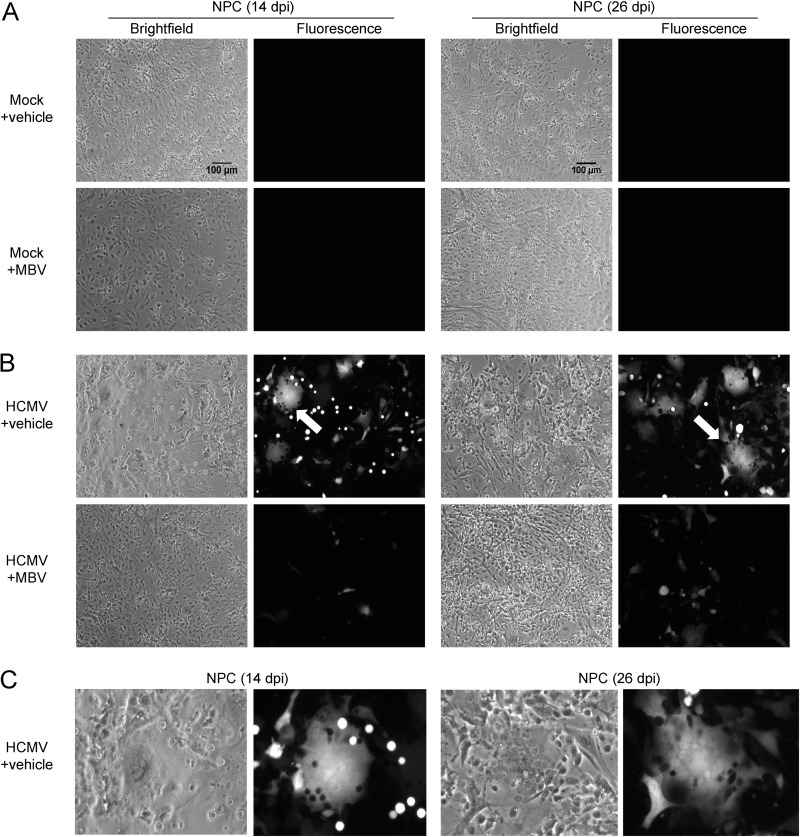
Calcium (Ca2+) signaling plays a central role in CNS development and NPC biology. Cell surface purinergic receptors and voltage-gated calcium channels (VGCCs) contribute to regulating intracellular Ca2+ levels. We aimed to determine the functional consequence of infection on neurons and astrocytes generated from iPSC-derived human NPCs. NPCs were dissociated from nonadherent neurospheres (37) and plated onto Matrigel-coated coverslips. At 7 days postplating, NPCs were mock infected (Fig. 1A) or infected with HCMV TB40/E expressing enhanced green fluorescent protein (eGFP) at a multiplicity of infection (MOI) of 0.5 infectious units per cell (Fig. 1B) and evaluated at 14 and 28 days postinfection (dpi). Both conditions included a 10 μM concentration of the HCMV inhibitor maribavir (MBV) or dimethyl sulfoxide (DMSO) vehicle control (Fig. 1A and B) that was added at the time of infection and persisted through the duration of the experiment. No fluorescence was seen under mock infection conditions at either time point (Fig. 1A), whereas HCMV-infected NPCs exhibited robust GFP fluorescence at 14 dpi that was sustained through 28 dpi (Fig. 1B). Infected samples treated with MBV showed considerably less fluorescence (Fig. 1B). This is consistent with our previous studies using NPCs derived from H9 human embryonic stem cells (18). Interestingly, HCMV-infected NPCs exhibited large, multinucleated syncytium-like structures (Fig. 1B and C), and inclusion of MBV largely prevented this outcome (Fig. 1B).
FIG 1.
HCMV induces syncytium-like formation during infection of human neural progenitor cells. NPC-derived neurons and astrocytes were mock infected (A) or infected using HCMV TB40/E-eGFP at 0.5 IU/cell (B) and treated with DMSO vehicle control (+vehicle) or 10 μM maribavir (+MBV). Bright-field and fluorescent images were taken at 14 dpi and 26 dpi from separate experiments. Arrows identify potential syncytium-like formation. (C) Enlarged images from panel B (arrows) identify examples of GFP-positive multinucleated syncytium-like formation. Scale bar, 100 μm.
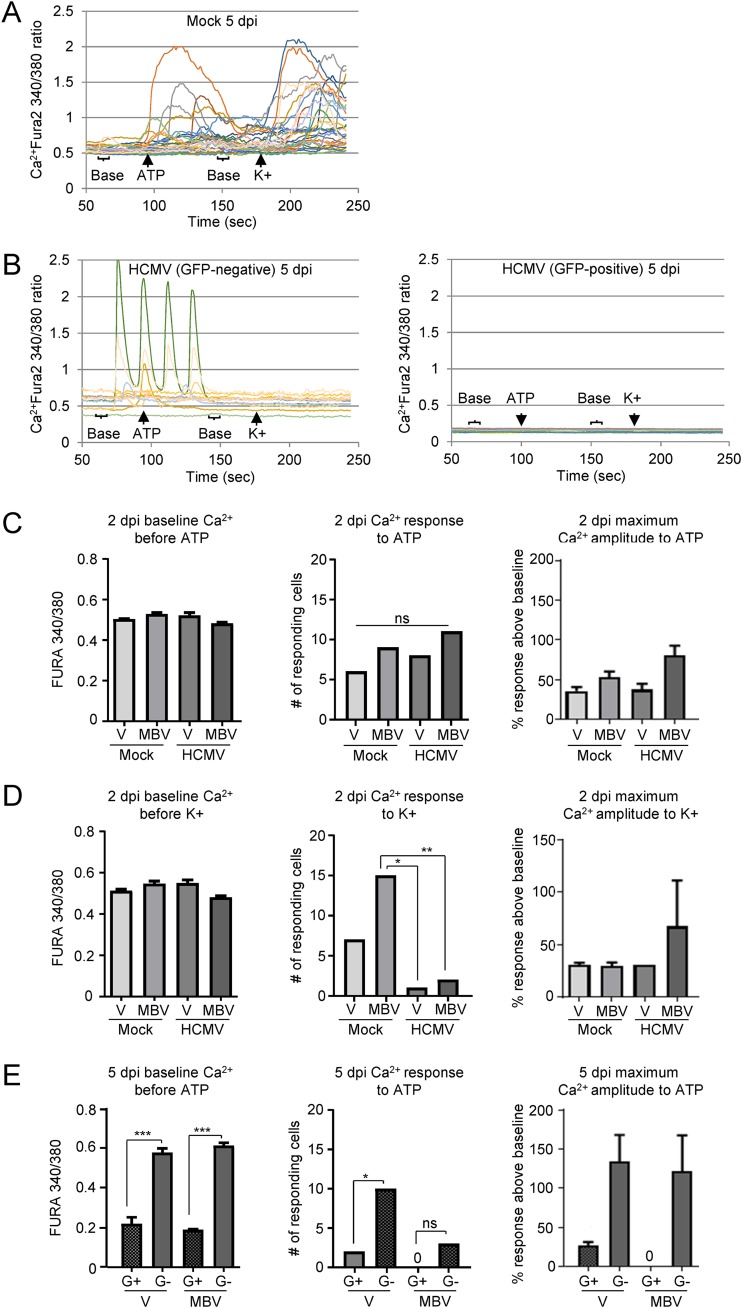
HCMV infection of fibroblasts alters intracellular Ca2+ homeostasis to support viral replication, and evidence indicates that Ca2+ levels temporally increase within the initial hours of infection (27, 28). As early as 12 hpi, a 3-fold increase in Ca2+ levels has been observed in fibroblasts, a process that is influenced by the multiplicity of infection and contributes to the cell-rounding phenotype (28, 31). However, the longer-term effects of HCMV infection on Ca2+ function have not been well established. Therefore, we began by evaluating Ca2+ responses to ATP and KCl stimulation in HCMV-infected lung fibroblasts using live-cell calcium imaging. At 2 and 5 dpi, fibroblasts were treated with the ratiometric Ca2+-sensitive dye Fura-2-acetoxymethyl ester (Fura-2AM) that excites at 340 nm in the Ca2+-bound state and at 380 nm in the Ca2+-unbound state and is measured as a 340 nm/380 nm ratio. To measure intracellular Ca2+ responses to receptor stimulation, we preloaded cells with Fura-2AM and then stimulated them with either ATP for purinergic receptors or KCl for VGCCs. Cells were washed between conditions, and we measured baseline intracellular Ca2+ levels 30 s prior to each stimulation. Cells were considered to be responding if they exhibited a greater than 20% increase in the 340/380 ratio over baseline values (38). A representative imaging trace of mock-treated fibroblasts is shown in Fig. 2A. At 2 dpi, there was no difference in baseline Ca2+ levels across the groups prior to ATP stimulation (Fig. 2C, left panel) or KCl stimulation (Fig. 2D, left panel). At 2 dpi there was no difference in the numbers of cells that responded to ATP stimulation across the groups (Fig. 2C, middle panel), nor was there a difference in the percent change in Ca2+ responses above baseline in the ATP-responding cells across the groups (Fig. 2D, right panel). In contrast, there was a significant reduction in the number of HCMV-infected cells responding to KCl compared to the number of uninfected cells receiving MBV (Fig. 2D, middle panel). However, the cells that did respond to KCl stimulation exhibited a similar percent increase over baseline levels across all of the groups. At 5 dpi we observed robust alterations in Ca2+ signaling, the most striking of which was a significant reduction in baseline Ca2+ levels before ATP stimulation in GFP-positive cells under the infected conditions compared to that of the GFP-negative cells under the same conditions (Fig. 2E, left panel). There was also a significant reduction in the number of HCMV-infected GFP-positive cells responding to ATP compared to that of GFP-negative cells in the absence of MBV coadministration (Fig. 2E, middle panel). There was a large increase in the percent response above baseline for the GFP-negative cells in both the presence and absence of MBV coadministration, but this did not reach significance (Fig. 2E, middle panel). However, it is important to note that the responding GFP-negative cells were not functioning entirely normally as there were several instances of spurious Ca2+ responses even in the absence of external stimulation (Fig. 2B). There was a similar significant reduction in Ca2+ baseline in HCMV GFP-positive fibroblasts prior to KCl stimulation at 5 dpi, but, interestingly, neither HCMV GFP-positive nor HCMV GFP-negative fibroblasts demonstrated any Ca2+ response to KCl stimulation with or without MBV administration (data not shown). This indicates that there was a dramatic disruption of VGCC signaling properties post-HCMV infection. Mock-treated fibroblasts were not examined at 5 dpi because the cultures were too confluent for imaging. Together, these data demonstrate that HCMV infection over longer periods of time leads to a reduction in intracellular Ca2+ levels and disrupted stimulus-evoked Ca2+ signaling function.
FIG 2.
Live-cell Ca2+ imaging is disrupted in HCMV-infected fibroblasts. (A) MRC-5 fibroblasts were mock treated and analyzed using live-cell Ca2+ imaging. Each line represents an individual cell. Cell traces from a representative experiment are shown. (B) MRC-5 cells were infected using HCMV TB40/E-eGFP at a multiplicity of 0.5 IU/cell, and recorded traces of a representative experiment were separated into GFP-positive and -negative populations. (C) At 2 dpi, intracellular Ca2+ levels were measured prior to ATP stimulation (left panel). The total number of cells responding to 10 μM ATP stimulation (middle panel) and the percent Ca2+ response over baseline (right panel) are shown. V, vehicle. (D) Impact of 50 μM KCl stimulation on Ca2+ levels as described in panel C. (E) Intracellular Ca2+ levels were measured at 5 dpi prior to ATP stimulation (left panel), and the total number of cells responding to ATP (middle panel) and the percent Ca2+ response over baseline are shown (right panel). Data collected at 5 dpi were separated into GFP-positive (G+) and -negative (G−) populations. The data were collected from two biological replicate experiments with 50 cells analyzed in each replicate and include standard deviations from the mean. (*, P < 0.05; **, P < 0.01; ***, P < 0.001; ns, not significant, as determined by ANOVA or chi-Square test).
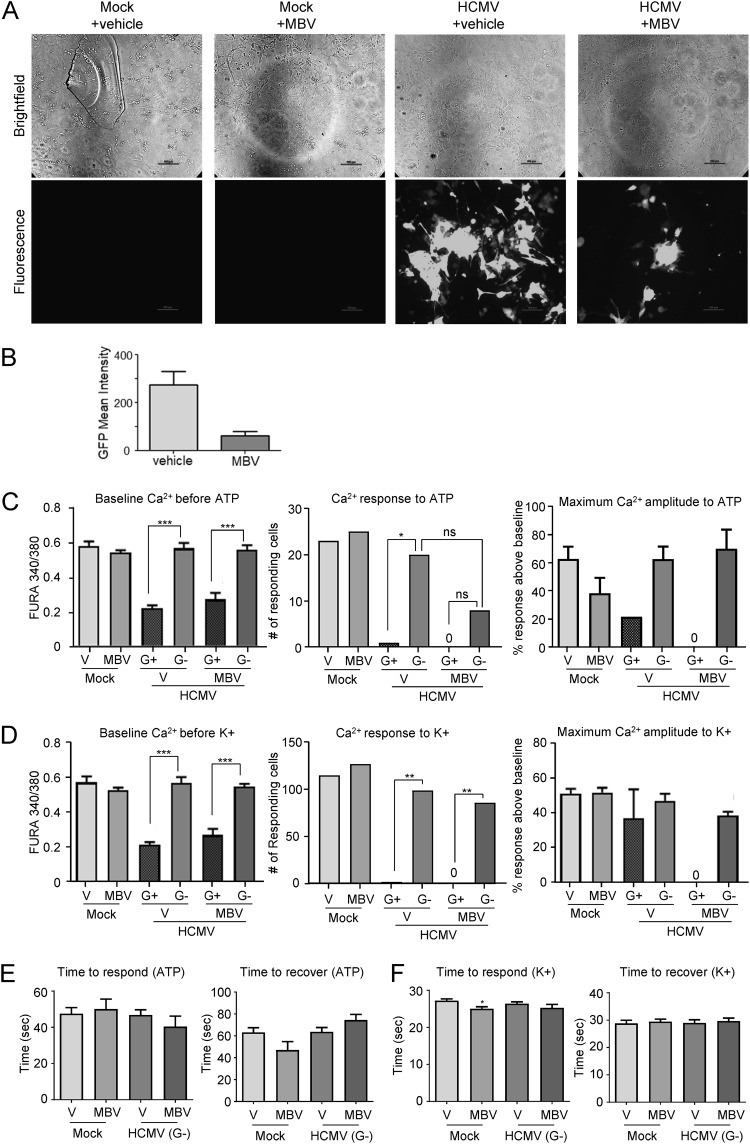
As the functional impact of HCMV may vary between affected cell types, we next aimed to determine how HCMV infection altered astrocyte and neuron Ca2+ responses to ATP and KCl stimulation, respectively. We dissociated and plated NPCs and allowed them to differentiate into neurons and astrocytes as we have previously done (37). At 1 week postplating, NPC-derived cells were infected with 0.5 IU/cell HCMV and cultured in the presence or absence of 10 μM MBV. Uninfected cultures were maintained as mock controls. Using the same live-cell calcium imaging technique described above, NPC-derived neural cells were analyzed at 14 and 26 dpi. At 14 dpi, HCMV-infected GFP-positive cells were evident, and a reduction in fluorescence was observed with the coadministration of MBV (Fig. 3A and B). Similar to infected fibroblasts, the GFP-positive cells had significantly reduced Ca2+ baseline levels prior to both ATP (Fig. 3C, left panel) and KCl (Fig. 3D, left panel) stimulation compared to those of the GFP-negative population. Additionally, we observed significantly fewer GFP-positive cells responding to either ATP (Fig. 3D, middle panel) or KCl (Fig. 3D, middle panel) stimulation than GFP-negative populations in the presence and absence of MBV coadministration. Moreover, the GFP-positive cells that did respond exhibited blunted signaling amplitude, regardless of the presence of MBV (Fig. 3C and D, right panels). These data suggest that HCMV-infected neural cells no longer exhibit functional Ca2+ responses to external stimulation. In contrast, there were similar numbers of responding GFP-negative cells under the infected conditions compared those under mock conditions for both ATP (Fig. 3C, middle panel) and KCl (Fig. 3D, middle panel) treatment, and those that responded maintained relatively normal Ca2+ signaling amplitude to both ATP (Fig. 3C, right panels) and KCl (Fig. 3D, right panels). In addition, the times to respond to and recover from ATP and KCl stimulation, a measurement of depolarization and repolarization, were not significantly different for mock-infected and GFP-negative cells (Fig. 3E and F) except for a small decrease in time to respond to KCl in MBV-treated mock-infected cells (Fig. 3F). Together, these data indicate that HCMV infection eliminates normal neural Ca2+ function and that although MBV reduced viral spread, MBV failed to restore Ca2+ function to HCMV GFP-positive infected cells.
FIG 3.
Viral kinase inhibition reduces spread but does not improve Ca2+ function in infected cells. (A) NPC-derived neurons and astrocytes were mock infected or infected using HCMV TB40/E-eGFP at 0.5 IU/cell and treated with DMSO vehicle control (+vehicle) or 10 μM maribavir (+MBV). Representative bright-field and fluorescent images were taken at 14 dpi. (B) The mean GFP fluorescence signal for infected samples treated with vehicle or MBV. (C) Intracellular Ca2+ levels were measured at 14 dpi with HCMV-infected cells separated into GFP-positive (G+) and -negative (G−) populations. Intracellular Ca2+ levels were measured prior to ATP stimulation (left panel), and the total number of cells responding to 10 μM ATP stimulation (middle panel) and the percent Ca2+ response over baseline are shown (right panel). V, vehicle. (D) Stimulation using 50 μM KCl as described in panel C. (E) The time to respond to ATP stimulation (left panel) or recover from ATP (right panel) across the treatment groups. (F) The time to respond to KCl (left panel) or recover from KCl (right panel). These data were collected from four biological replicate experiments with 100 cells analyzed in each replicate. (*, P < 0.05; **, P < 0.01; ***, P < 0.001; ns, not significant, as determined by ANOVA or chi-square test).
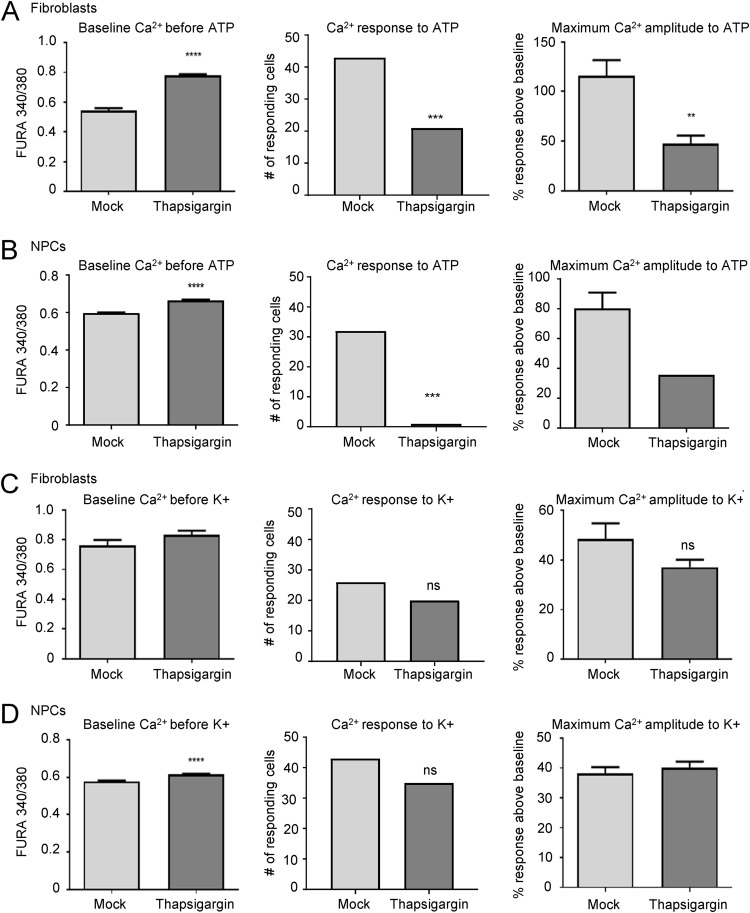
Other investigators have previously shown that HCMV infection disrupts internal Ca2+ stores in fibroblasts, causing an early increase in intracellular Ca2+ levels (30, 31). Therefore, in order to test whether this disruption is responsible for the lack of response to ATP and KCl stimulation in HCMV-infected GFP-positive fibroblasts and neural cells, we treated fibroblasts and NPC-derived neural cells with thapsigargin, an inhibitor of the ER calcium ATPase that blocks the reuptake of cytosolic Ca2+ (Fig. 4). Uninfected fibroblasts at 3 days postplating and differentiated NPCs at 14 days postplating were treated with 1 μM thapsigargin or vehicle for 90 min, followed by live-cell Ca2+ imaging in the absence of infection (38). Thapsigargin treatment resulted in an increase in baseline Ca2+ levels prior to ATP and KCl stimulation in both fibroblasts and NPC-derived neural cells (Fig. 4, left panels) consistent with increased cytosolic Ca2+ concentration. Thapsigargin significantly reduced the number of fibroblasts (Fig. 4A, middle panel) and neural cells (Fig. 4B, middle panel) responding to ATP stimulation as well as the amplitude of response (Fig. 4A and B, right panels). These results were expected as ATP-induced Ca2+ responses signal through purinergic receptors and inositol triphosphate and rely on abundant internal Ca2+ stores. In contrast, there was no significant impact on KCl-mediated Ca2+ responsiveness in either fibroblasts (Fig. 4C) or neural cells (Fig. 4D), suggesting that membrane voltage-gated channels were still functioning and allowing extracellular Ca2+ to enter the cell. These data demonstrate that release of internal Ca2+ stores following thapsigargin treatment is consistent with an increase in cytosolic Ca2+ levels that other investigators have found in fibroblasts early after HCMV infection (31). However, the release of intracellular Ca2+ stores does not explain the dramatic decrease in baseline Ca2+ levels nor the disruption of VGCC-mediated Ca2+ signaling observed days after HCMV infection in both fibroblasts and neural cells (Fig. 2 and 3), suggesting that other mechanisms are likely involved.
FIG 4.
Depletion of intracellular Ca2+ stores disrupts purinergic receptor activity in fibroblasts and NPCs. (A) Fibroblasts were treated with 1 μM thapsigargin and analyzed for baseline intracellular Ca2+ levels prior to stimulation (left panel), for the number of responding cells following 10 μM ATP stimulation (middle panel), and for percent Ca2+ response above baseline (right panel). (B) NPC-derived neurons and astrocytes were analyzed as described for panel A. (C) Thapsigargin-treated fibroblasts were analyzed for baseline intracellular Ca2+ levels prior to stimulation (left panel), for the number of responding cells following 50 μM KCl stimulation (middle panel), and for percent Ca2+ response above baseline (right panel). (D) NPC-derived neurons and astrocytes were analyzed as described for panel C. Data are from three biological replicate experiments with 50 (fibroblasts) or 100 (neural) cells analyzed in each replicate. (**, P < 0.01; ***, P < 0.001; ****, P = 0.0001; ns, not significant, as determined by ANOVA or chi-square test).
Infection disrupts cortical organoid organization and layering.
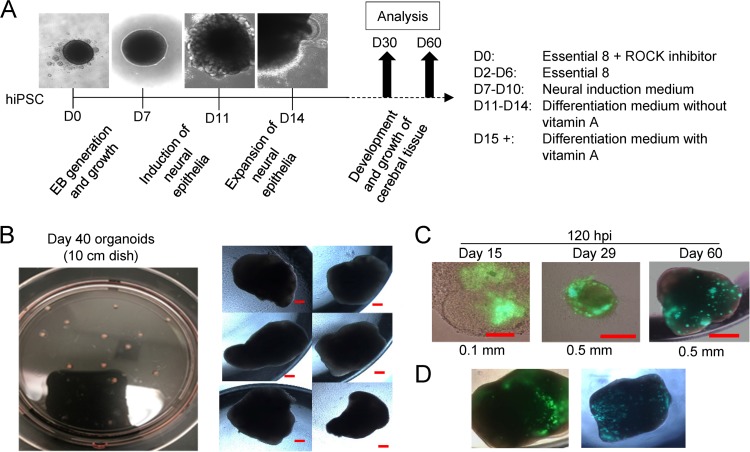
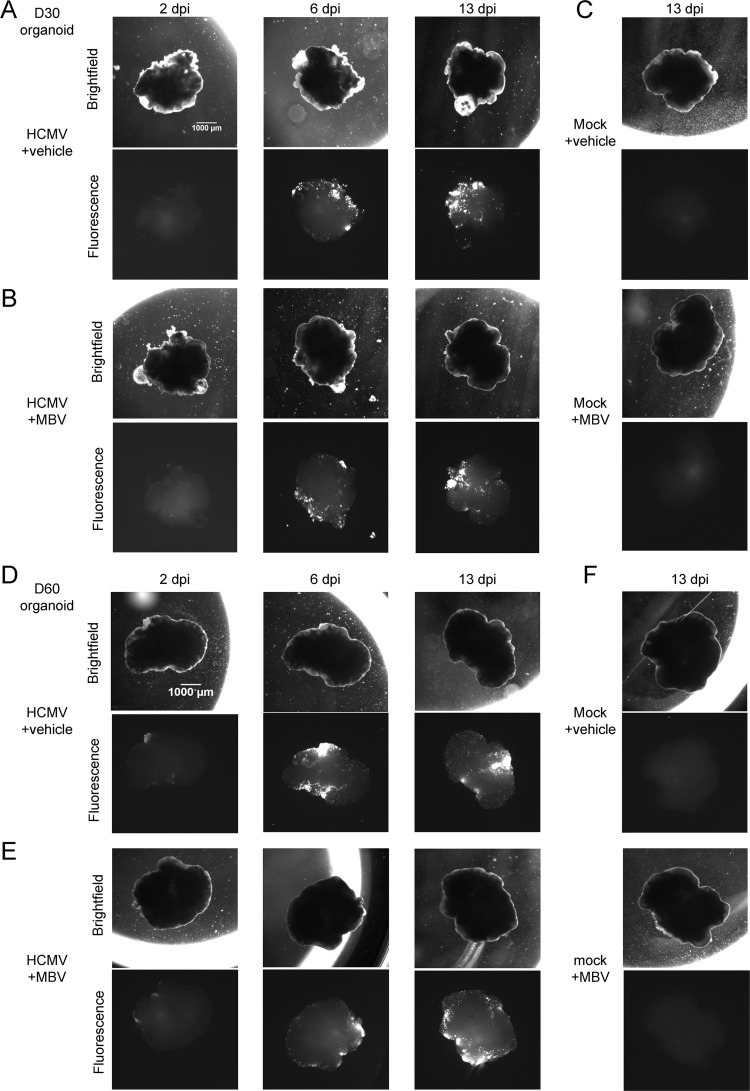
Since the human brain develops in a multicellular three-dimensional structure, we next employed the stem cell organoid system (7) to test the effect of HCMV infection in a more complex model. Organoids were derived from iPSCs and patterned toward forebrain development with defined neural induction medium (7) (Fig. 5A). We found that iPSC-derived organoids were produced to similar sizes (Fig. 5B) and could be infected with HCMV at different times of development (Fig. 5C) with similar degrees of susceptibility (Fig. 5D). To approximate equal MOIs between organoids, the amount of input virus was based on the two-dimensional area for each organoid determined prior to infection. Mock- and HCMV-infected organoids were cultured in the presence or absence of 10 μM MBV throughout the duration of infection. We infected organoids at day 30 (Fig. 6A and B, D30) or day 60 (Fig. 6D and E, D60) of development, and we observed low levels of GFP by 2 dpi, robust expression by 6 dpi, and continued GFP spread to 13 dpi in infected organoids grown in the absence (Fig. 6A and D) or presence (Fig. 6B and E) of MBV. No GFP expression was detected under mock-infected conditions (Fig. 6C and F).
FIG 5.
Three-dimensional cortical organoid generation and infection by HCMV. (A) Multicellular organoids were generated over a time course of 30 to 60 days, with the developmental steps and culture conditions indicated during each phase of the differentiation process. Representative bright-field images of early stage organoids are shown. (B) Image of day 40 organoids prepared in a 10-cm culture dish and later moved to individual wells of a multiwell plate showing uniformity of size. Scale bar, 0.2 mm. (C) Day 15, 29, and 60 organoids were infected using HCMV TB40/E-eGFP based on an approximated area at 1 IU/μm2 in individual culture wells, and bright-field and fluorescent images obtained at 120 hpi. (D) Organoids prepared separately from those used in the experiment shown in panel B were infected and evaluated for GFP fluorescence at 120 hpi. D, day; ROCK, rho-associated coiled-coil protein kinase; hiPSC, human iPSC.
FIG 6.
HCMV infection spread in cortical organoids regardless of MBV cotreatment. (A to C) Representative bright-field and fluorescent images of day 30 (D30) organoids infected with HCMV TB40/E-eGFP at a multiplicity of 1 IU/μm2 between 2 and 13 dpi and treated with vehicle or 10 μM MBV or mock infected and treated as indicated. (D to F) Representative bright-field and fluorescent images of day 60 organoids infected with HCMV TB40/E-eGFP at a multiplicity of 1 IU/μm2 between 2 and 13 dpi and treated with vehicle or 10 μM MBV or mock infected and treated as indicated. Images were obtained using a 1× objective at the indicated times.
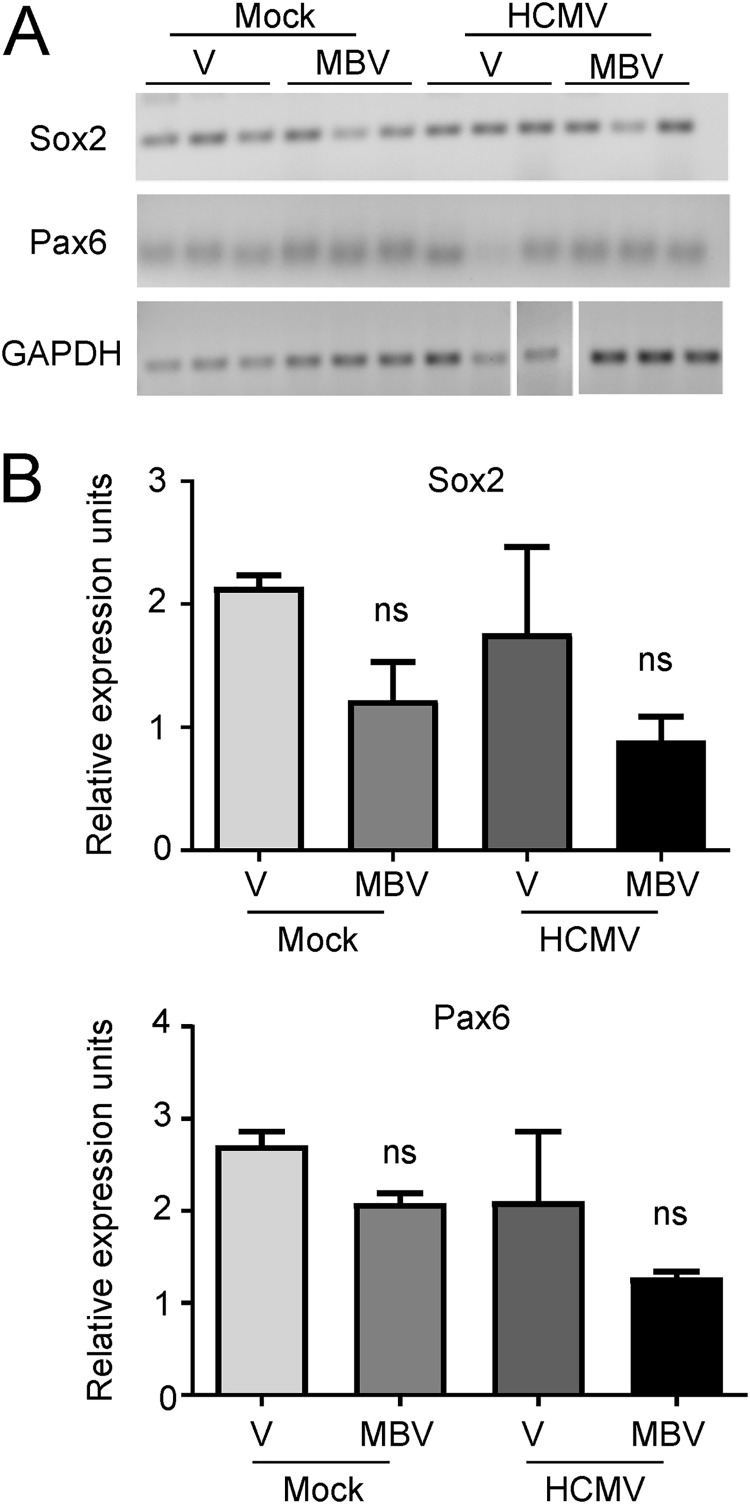
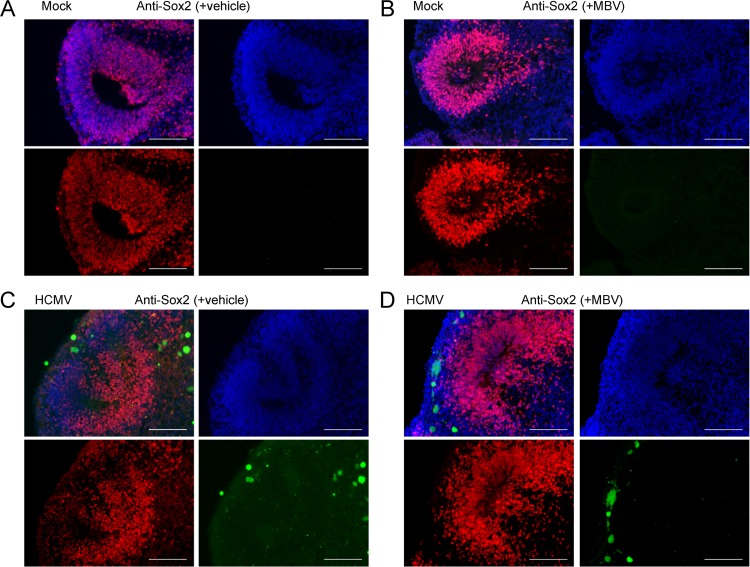
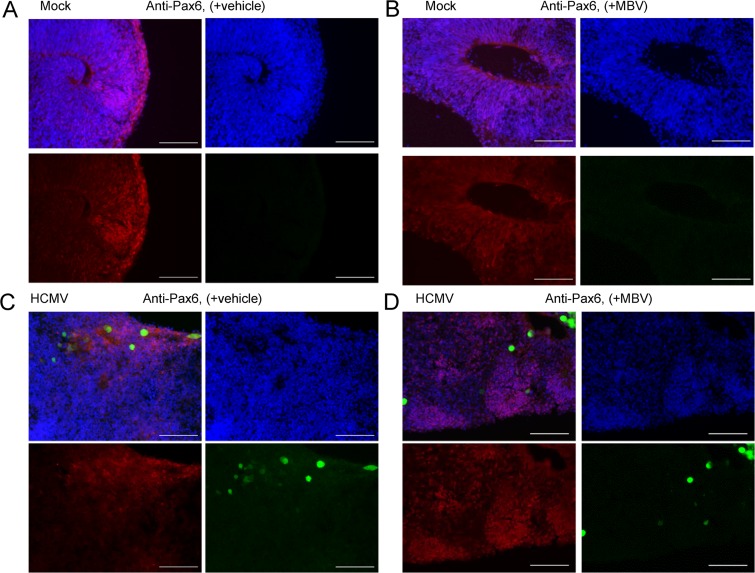
We first assessed the impact of infection on cellular markers involved in NPC biology. Our initial assessment was on transcript levels for Sox2, a transcription factor necessary for the maintenance of neural progenitor cell identity, and Pax6, a transcription factor key to neuroectodermal specification, using RNA isolated from whole organoids. We observed no significant expression differences between conditions (Fig. 7A and B), suggesting that infection does not substantially alter early NPC development at the level of the whole organoid. Using immunohistochemistry of cryosectioned organoids, we next stained for Sox2 and Pax6. We observed that Sox2 was highly expressed in day 30 organoids under all conditions (Fig. 8). However, we detected differences in the organization and distribution of Sox2-positive cells. Specifically, under the mock infection and MBV-only conditions (Fig. 8A and B), Sox2-expressing cells were routinely organized in a radial neural rosette pattern, reminiscent of neural tube formation (39). During infection, however, Sox2-positive cells in infected tissues were widely distributed in an unorganized pattern with sparse rosette formation (Fig. 8C). Treatment with MBV appeared to restore some of the radial Sox2 neural rosette organization (Fig. 8D), suggesting that MBV cotreatment exerts a partial recovery of structural development. Similarly, intense and more radially organized Pax6 staining was observed under both mock conditions (Fig. 9A and B). Pax6 staining in the infected organoids was less intense and less organized, with some staining appearing cytoplasmic rather than nuclear (Fig. 9C); MBV treatment appeared to normalize some of the staining intensity and expression pattern (Fig. 9D).
FIG 7.
Whole-organoid expression of early NPC markers is not significantly changed with HCMV infection. (A) Whole-organoid RNA was isolated at 14 dpi from mock- and HCMV TB40/E-eGFP-infected day 30 organoids treated with vehicle (V) or 10 μM MBV. Three separate organoids were analyzed for each condition. Expression of Sox2 and Pax6 was assessed using RT-PCR relative to results with the GAPDH control. (B) Average signal intensity of Sox2 and Pax6 relative to that of GAPDH from three separate organoids is shown. ns, not significant.
FIG 8.
HCMV-infected organoids show disrupted rosette formation and Sox2 expression patterns. Representative immunofluorescent images of cryosectioned day 30 organoids stained at 14 dpi for Sox2 expression (red) and with 4′,6′-diamidino-2-phenylindole (blue) following mock infection with vehicle (A), mock infection with 10 μM MBV (B), HCMV TB40/E-eGFP infection (green) with vehicle (C), and HCMV TB40/E-eGFP infection with MBV (D). No GFP fluorescence was observed under mock conditions. Scale bar, 100 μm.
FIG 9.
HCMV-infected organoids show disrupted Pax6 expression patterns. Representative immunofluorescence images of cryosectioned day 30 organoids stained at 14 dpi for Pax6 expression (red) and with 4′,6′-diamidino-2-phenylindole (blue) following mock infection with vehicle (A), mock infection with 10 μM MBV (B), HCMV TB40/E-eGFP infection (green) with vehicle (C), and HCMV TB40/E-eGFP infection with MBV (D). No GFP fluorescence was observed under mock conditions. Scale bar, 100 μm.
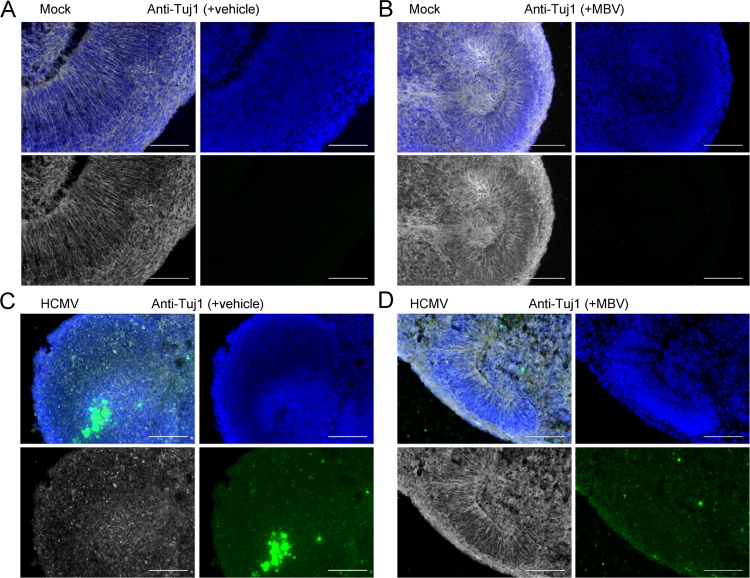
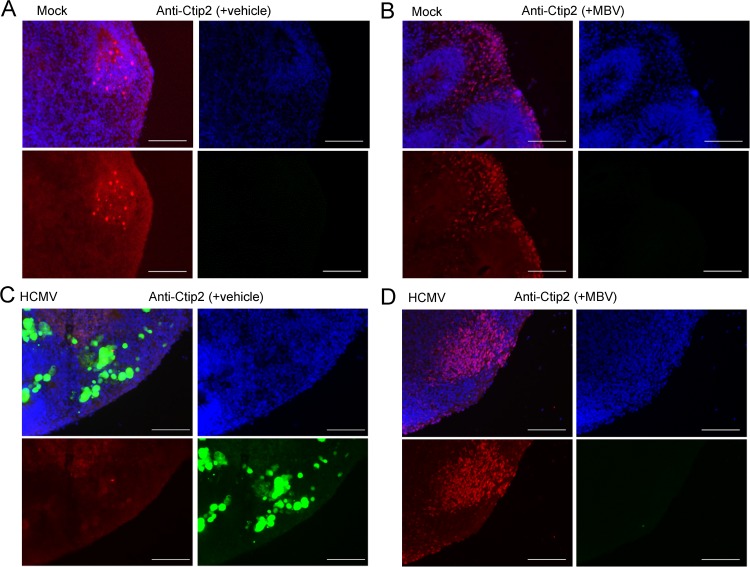
Next, we aimed to determine whether HCMV infection disrupted terminal differentiation. We stained for the glial cell marker S100β and found that HCMV infection did not dramatically impact the overall expression or distribution of S100β-positive cells (Fig. 10A and B). However, when we stained for the neural marker βIII tubulin (Tuj1), we found an overall reduction in Tuj1 expression and lack of radial organization in HCMV-infected organoids (Fig. 11C) compared to levels under mock conditions (Fig. 11A and B). We observed a modest effect of MBV on restoring Tuj1 expression and organization during infection (Fig. 11D). When we stained for Ctip2, a layer V cortical neuron marker, we found that HCMV-infected organoids exhibited few Ctip2-positive cells (Fig. 12C), whereas under mock infection and MBV-only conditions Ctip2-positive nuclei were readily observed near the outer layers of the organoid (Fig. 12A and B). Interestingly, Ctip2-positive cells were observed in HCMV-infected organoids treated with MBV (Fig. 12D), suggesting that MBV may restore the ability of NPCs to progress to more differentiated neurons. These data demonstrate that HCMV infects a small fraction of cells within the organoids, spreads over time, and disrupts the development of more layer-specific neuron subpopulations. The addition of MBV appeared to have limited impact on overall viral spread in whole three-dimensional organoids (Fig. 6) yet provided some modest benefit for early NPC differentiation.
FIG 10.
HCMV infection does not impact astrocyte labeling in cortical organoids. Representative immunofluorescence images of cryosectioned day 30 organoids stained at 14 dpi for S100β expression (red) and with 4′,6′-diamidino-2-phenylindole (blue) following mock infection with vehicle (A) and HCMV TB40/E-eGFP infection (green) with vehicle (B). No GFP fluorescence was observed under mock conditions. Scale bar, 100 μm.
FIG 11.
HCMV-infected organoids show disrupted neuron differentiation. Representative immunofluorescence images of cryosectioned day 30 organoids stained at 14 dpi for Tuj1 (βIII tubulin) expression (white) and with 4′,6′-diamidino-2-phenylindole (blue) following mock infection with vehicle (A), mock infection with 10 μM MBV (B), HCMV TB40/E-eGFP infection (green) with vehicle (C), and HCMV TB40/E-eGFP infection with MBV (D). No GFP fluorescence was observed under mock conditions. Scale bar, 100 μm.
FIG 12.
HCMV-infected organoids lack terminal differentiation of layer-specific cortical neurons. Representative immunofluorescence images of cryosectioned day 30 organoids stained at 14 dpi for Ctip2 expression (red) and with 4′,6′-diamidino-2-phenylindole (blue) following mock infection with vehicle (A), mock infection with 10 μM MBV (B), HCMV TB40/E-eGFP infection (green) with vehicle (C), and HCMV TB40/E-eGFP infection with MBV (D). No GFP fluorescence was observed under mock conditions. Scale bar, 100 μm.
Loss of Ca2+ activity in HCMV-infected cortical organoid-derived cells.
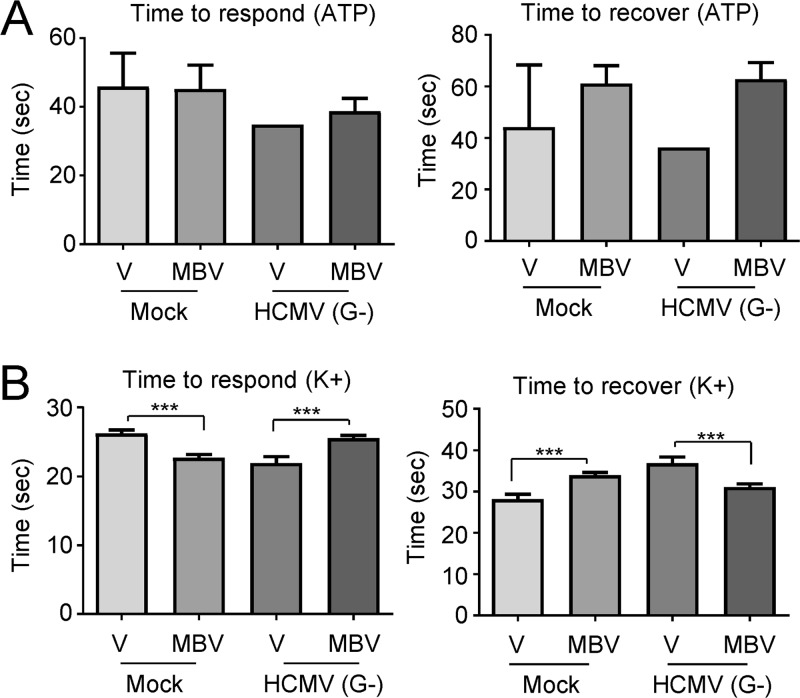
Finally, we aimed to test the functional consequences of infection on organoid-derived neurons and astrocytes. In order to investigate Ca2+ channel activities, it was necessary to dissociate the treated day 30 and day 60 organoids and plate the resulting cells onto Matrigel-coated coverslips. Organoid-derived neurons and astrocytes reestablished extensions by 2 weeks postplating. We observed clear GFP expression in the HCMV-infected cells from both day 30 (Fig. 13A) and day 60 organoids (data not shown), and the overall number of GFP-positive cells was reduced by MBV coadministration (Fig. 13B). We next performed live-cell imaging on the dissociated organoids as described above. The GFP-positive HCMV-infected cells from both day 30 and day 60 organoids had significantly reduced calcium baseline levels prior to ATP stimulation (Fig. 13C and E, left panels). We observed few ATP-responding cells in the dissociated organoids at both day 30 (Fig. 13C, middle panel) and day 60 (Fig. 13E, middle panel) from any of the treatment groups, which may be a function of the developmentally later generation of astrocytes than of neurons (40). However, no GFP-positive cells under the HCMV-infected conditions responded to ATP at either time point regardless of the presence of MBV (Fig. 13C and E, right panel). Nevertheless, the few responding GFP-negative cells under the infected conditions exhibited normal Ca2+ responses to ATP stimulation compared to those of the mock conditions (Fig. 13C and E, right panels), and under the day 30 organoid condition, we found that MBV cotreatment significantly increased the number of responding GFP-negative cells to ATP stimulation compared to that under the HCMV condition alone (Fig. 13C, middle panel). There were no significant differences in time to respond to ATP or time to recover from stimulation in the day 30 organoids (Fig. 14A).
FIG 13.
HCMV infection reduces stimulus-evoked Ca2+ responses in organoid-derived neural cells. (A) Day 30 organoids were mock infected or infected using HCMV TB40/E-eGFP at 0.5 IU/cell and treated with DMSO vehicle control (+vehicle) or 10 μM maribavir (+MBV). Representative bright-field and fluorescent images of dissociated neurons and astrocytes were taken at 14 days postplating. (B) The mean GFP fluorescence decreased in HCMV-infected cells with MBV cotreatment. (C) Intracellular Ca2+ levels were measured at 14 days postplating with HCMV-infected cells separated into GFP-positive (G+) and -negative (G−) populations. Intracellular Ca2+ levels were measured prior to stimulation (left panel), and the total number of cells responding to 10 μM ATP stimulation (middle panel) and the percent Ca2+ response over baseline are shown (right panel). (D) Stimulation using 50 μM KCl as described for panel C. (E) Day 60 organoids were mock treated or infected as described for panel A. Intracellular Ca2+ levels were measured at 14 days postplating prior to stimulation (left panel), and the total number of cells responding to 10 μM ATP stimulation (middle panel) and the percent Ca2+ response over baseline are shown (right panel). (F) Stimulation using 50 μM KCl as described for panel E. Data were collected from four biological replicate experiments with 100 cells analyzed in each replicate. (*, P < 0.05; **, P < 0.01; ***, P < 0.001; ns, not significant, as determined by ANOVA or chi-square test).
FIG 14.
HCMV infection altered organoid-derived neuronal response to KCl stimulation. (A) The time to respond to ATP stimulation (left panel) or recover from ATP (right panel) across the treatment groups. (B) The time to respond to KCl (left panel) or recover from KCl (right panel). Data were collected from four biological replicate experiments with 100 cells analyzed in each replicate. (***, P < 0.001, determined by ANOVA).
Based on the immunocytochemistry results, the organoid system generated early layer-specific neurons. Therefore, we tested neuronal Ca2+ function upon KCl stimulation using dissociated cells from both day 30 and day 60 organoids. HCMV-infected GFP-positive cells at both time points again demonstrated a significant reduction in baseline Ca2+ levels prior to KCl stimulation (Fig. 13D and F, left panels). In day 30 organoids, there were no HCMV-infected GFP-positive neurons that responded to KCl stimulation, and coadministration of MBV did not increase the number of responding GFP-positive cells (Fig. 13D, middle panel). However, MBV cotreatment significantly increased the number of infected GFP-negative cells responding to KCl stimulation compared to the that of HCMV infection conditions alone, restoring the number of responding cells to levels observed under mock conditions (Fig. 13D, middle panel). Surprisingly, the day 30 organoid-derived GFP-negative cells under the HCMV infection condition exhibited significantly higher amplitudes following KCl stimulation than under the mock conditions (Fig. 13D, right panel), suggesting hyperexcitability, whereas MBV cotreatment normalized the response amplitude (Fig. 13D, right panel). We also observed significant variations in the time to respond and time to recover from KCl stimulation in the day 30 organoids across all conditions (Fig. 14B), further supporting altered excitability properties in HCMV-infected neurons. Of note, MBV treatment alone caused small but significant changes in the time to respond and recover from KCl stimulation compared to that of the vehicle-alone condition (Fig. 14B), highlighting potential off-target electrophysiological impacts of MBV administration. In day 60 organoids, again there were no HCMV-infected GFP-positive neurons that responded to KCl stimulation (Fig. 13F, middle panel), and MBV cotreatment did not dramatically improve this (Fig. 13F, middle panel). However, MBV cotreatment did significantly increase and normalize the number of infected GFP-negative cells that responded to KCl stimulation (Fig. 13F, middle panel). The Ca2+ response amplitude of all responding cells was consistent across the conditions (Fig. 13F, right panel), indicating that the hyperexcitability noted in the day 30 organoids was not maintained in the day 60 organoid population. Overall, these data demonstrate that HCMV infection disrupts ATP- and KCl-stimulated Ca2+ function in cortical organoid-derived cells, which could dramatically impact early brain development. The addition of the antiviral MBV may offer some protective benefits in neural tissues by limiting the number of cells overtly infected and allowing for the maintenance of relatively normal cellular Ca2+ function in this GFP-negative cell population. However, MBV has virtually no effect on Ca2+ function in the HCMV-infected GFP-positive cell population.
DISCUSSION
Congenital HCMV infection poses a serious health risk to the developing human brain, and the advent of the three-dimensional cortical organoid system offers a valuable view into the early stages of human brain development to allow for investigation into the effects of HCMV infection. We show that although HCMV appears to infect a small subset of cells (Fig. 6), infection alters both organoid structure and developing neural function. With regard to overall organoid structure, HCMV-infected organoids lacked robust rosette formation (Fig. 8 and 12) and the generation of more terminally differentiated, layer-specific neurons (Fig. 12). Rosette formation in stem cell culture systems is a hallmark of developing NPCs, and their organization and protein expression suggest formation of neuroepithelial cells of the developing neural tube (39, 41). The progenitor cells within the rosette are then capable of neurogenesis and gliogenesis to populate the developing brain (37, 42). Although overall expression levels of Sox2- and Pax6-positive NPC populations appear relatively unaffected by HCMV infection (Fig. 7), their distribution and organization are altered (Fig. 8 and 9). This could have important consequences and may hinder appropriate migration and subsequent differentiation into the proper neuronal subpopulations. For example, Pax6 is required for neurogenesis and patterning of the mammalian cortex (43, 44). However, as there is a close link between regionalization of Pax6 expression and the resulting cell fate decisions (45, 46), mislocalized Pax6-expressing NPCs (Fig. 9C) could alter the downstream differentiation profile, contributing to a generalized decrease in neurogenesis. This is evident in infected organoids with altered Tuj1 staining (Fig. 11C) and a specific reduction in layer-specific Ctip2-positive neurons (Fig. 12C). Interestingly, loss of Ctip2 expression in mouse brain disrupts corticospinal tract development (47), a critical white matter cortical projection tract controlling movements of the limbs and trunk, suggesting a potential contributor to motor delay in cCMV-infected infants.
Microcephaly is a severe clinical outcome associated with cCMV infection (6). The smaller head size in infected babies is routinely associated with smaller and less developed brains. This contributes to impaired neural function and cognitive delay. How HCMV infection specifically causes the reduction in brain size is not well known, but our data using human iPSC-derived cortical organoids suggest that HCMV disrupts NPC organization and the transition to more terminally differentiated populations. This is consistent with studies suggesting that microcephaly is associated with altered NPC differentiation (7). Interestingly, our data are largely consistent with studies evaluating the effect of Zika infection in stem cell-derived organoids (48). Zika infection in cortical organoids has been shown to induce abnormal rosette formation, increased NPC cell death, and abnormal terminal differentiation, resulting in smaller and more disorganized organoids (7, 49–51).
We have demonstrated that HCMV-infected cells are no longer capable of generating normal ATP and KCl stimulation-evoked Ca2+ responses (Fig. 3 and 13). This observation correlates well with the altered neural differentiation and organization within the organoid because Ca2+ signaling is critical for nearly all essential components of neural development, including NPC proliferation, migration, and differentiation (52–56). Intracellular Ca2+ levels regulate neurodevelopment through activating downstream calcium modulators, transcription factors, and signaling cascades that control such key processes as Sox2 gene expression (57). Interestingly, Ca2+ signaling also plays an important role in the rate of NPC migration, whereby lower levels are needed initially to keep NPCs in a migratory state whereas increased Ca2+ signaling arrests migration when cells get to their appropriate positions (58–60). As such, the diminished Ca2+ signaling in the HCMV-infected organoids may have been sufficient to allow early Sox2 and Pax6 expression to proceed and initiate cellular migration but was not sufficient to allow for proper organization and terminal differentiation. NPCs use several different channels and mechanisms to regulate intracellular Ca2+ signaling, including L-type Ca2+ channels, transient receptor potential (TRP) channels, and gap junctions, so future studies will be required to examine which processes are most relevant to HCMV infection in human neural tissues.
We observed that coadministration with MBV, an antiviral against HCMV, decreased GFP spread and fluorescence intensity following HCMV infection in two-dimensional cultures derived from either NPCs (Fig. 1 and 3) or dissociated organoids (Fig. 13). Therefore, we hypothesized that the number of GFP-negative cells in the MBV-treated infection would be greater than under the HCMV infection condition alone and more consistent with mock infection conditions. In dissociated NPCs, we did not observe an overall increase in the number of GFP-negative cells responding to ATP or KCl with MBV (Fig. 3). However, there was an increase in the number of responding GFP-negative cells derived from the organoids (Fig. 13). These data highlight potential mechanistic differences between two-dimensional and three-dimensional model systems. It has been observed that neurons, astrocytes, and other cells change their signaling and proteomic profiles upon infection (61–63). Therefore, it is possible that HCMV infection-induced changes in the surrounding microenvironment may have hindered neural maturation and Ca2+ signaling properties under the two-dimensional NPC condition but that the three-dimensional culturing conditions mitigated HCMV-mediated effects. During infection of the three-dimensional tissues, we observed similar degrees of GFP spread between vehicle- and MBV-treated tissues (Fig. 6), yet infection in dissociated NPCs showed a significant reduction in GFP spread with MBV cotreatment (Fig. 1). We speculate that a higher concentration of MBV is required to penetrate the intact organoid to reduce HCMV spread. Alternatively, it is conceivable that HCMV spread is less dependent on the viral kinase target of MBV in a multicellular three-dimensional tissue. This is consistent with observations that HCMV TB40/E cell-associated production is less susceptible to MBV than cell-free virus production (64). Regardless, few GFP-positive cells were responsive to stimulation, suggesting that once cells are infected, MBV cannot protect or restore neuron and astrocyte functions. A recent study used stem cell-derived NPCs and organoids to screen small-molecule inhibitors of Zika infection and found that a combination of a neuroprotective agent and an antiviral agent improved NPC survival (65). The modest benefit of MBV treatment on organoid structure (Fig. 8 and 12), on terminal differentiation, as shown in our previous work (18), and on neural function (Fig. 13) may indicate that MBV, either alone or in combination with other neuroprotective agents, could help mitigate developmental defects in congenital HCMV infection.
In summary, this report demonstrates severe functional and developmental consequences to human neural development upon HCMV infection. The use of iPSC-derived organoids offers a unique insight into the effects of HCMV infection in the human brain, which may help identify species-specific mechanisms to target for future therapeutic discovery.
MATERIALS AND METHODS
Cell culture and virus.
Viral stocks were prepared by infecting MRC-5 fibroblasts (ATCC) with HCMV strain TB40/E encoding GFP (66, 67). Cell culture medium was collected and pelleted through a sorbitol cushion (20% sorbitol, 50 mM Tris-HCl, pH 7.2, 1 mM MgCl2) at 55,000 × g for 1 h in a Sorvall WX-90 ultracentrifuge and SureSpin 630 rotor (ThermoFisher Scientific). Titers of viral stocks were determined by a limited dilution assay with the 50% tissue culture infectious dose (TCID50) in MRC-5 cells in a 96-well dish. At 2 weeks postinfection, HCMV IE1-positive cells were counted to determine viral titers, reported as the number of infectious units (IU) per milliliter. IE1-positive cells were determined using a mouse anti-HCMV IE1 antibody (clone 1B12; generously provided by Tom Shenk, Princeton University, Princeton, NJ).
MRC-5 fibroblasts were cultured in Dulbecco’s modified Eagle medium (DMEM) (ThermoFisher Scientific) containing 7% fetal bovine serum (FBS) (Atlanta Biologicals) and 1% penicillin-streptomycin (ThermoFisher Scientific). Cells were plated at 1.0 × 10⁴ cells per well of a 24-well plate onto Matrigel-coated coverslips. Matrigel was diluted in DMEM, placed on coverslips for approximately 12 h, and aspirated off prior to plating cells. For experiments involving plated cells, infections were completed using a multiplicity of 0.5 IU per cell. Mock- or HCMV-infected cells were treated with 1 μM maribavir (MBV) (provided by ViroPharma, now Shire Plc) or dimethyl sulfoxide (DMSO) as a vehicle control starting at 2 hpi. Compounds were replaced every 24 h, and at 2 and 5 dpi, cells were used for calcium imaging experiments.
Three independent iPSC cell lines derived from healthy individuals were used in this study (4.2, 21.5, and hB53) (68–70). iPSCs were maintained in Essential 8 medium (ThermoFisher Scientific) and were grown under feeder-free conditions on Matrigel (Corning). Neural progenitor cells (NPCs) were differentiated and maintained as neurospheres (EZ spheres) in Stemline (Millipore Sigma) supplemented with 0.5% N-2 supplement (ThermoFisher Scientific), 100 ng/ml EGF (Miltenyi Biotech), 100 ng/ml fibroblast growth factor (FGF; Stem Cell Technologies), and 5 μg/ml heparin (Millipore Sigma) as described previously (37). EZ spheres were dissociated using TrypLE (ThermoFisher Scientific) and seeded at 3.0 × 10⁴ cells per well onto Matrigel-coated coverslips. Plated NPCs were grown in Neurobasal medium (ThermoFisher Scientific) supplemented with 2% B-27 (ThermoFisher Scientific) and 1% antibiotic-antimycotic (ThermoFisher Scientific). At 7 days postplating, NPCs were infected with HCMV at 0.5 IU/cell. At 2 hpi, viral medium was removed, and cells were treated with 1 μM MBV or DMSO as a vehicle control. These compounds were replaced every 24 h, with treatments continuing for 14 days. NPCs were used for calcium imaging experiments at 14 dpi.
Cortical organoids.
Cortical organoid cultures were differentiated from iPSCs according to a previously established protocol (7). Briefly, iPSCs were seeded at 9 × 10³ cells per well onto 96-well ultralow attachment plates for embryoid body (EB) formation and grown in Essential 8 medium for 5 days. At day 6, the induction of neural epithelium was initiated by growing EBs in 24-well ultralow attachment plates and neural induction medium containing DMEM/F12 (Millipore Sigma) supplemented with 1% N-2, 1% GlutaMAX (ThermoFisher Scientific), 1% nonessential amino acids (NEAA) (ThermoFisher Scientific), and 1 μg/ml heparin (Millipore Sigma). At day 11, neural tissues were embedded in Matrigel droplets, transferred to 60- by 15-mm dishes, and grown in organoid medium without vitamin A containing DMEM/F12 supplemented with 1% B-27 without vitamin A (ThermoFisher Scientific), 1% GlutaMAX, 1% antibiotic antimycotic, 0.5% N-2, 0.5% NEAA, 2.5 μg/ml insulin (Millipore Sigma), and beta-mercaptoethanol (ThermoFisher Scientific). From this point on, organoids were maintained on a rocker which elicited the circulation of nutrients and prevented organoids from sticking to the dish. On day 15 and after, organoids were grown in organoid medium with vitamin A containing Neurobasal medium supplemented with 1% B-27 with vitamin A, 1% GlutaMAX, 1% antibiotic antimycotic, 0.5% N-2, 0.5% NEAA, 2.5 μg/ml insulin, and beta-mercaptoethanol. Organoids at day 30 and day 60 were infected with HCMV. Multiplicity was approximated by calculating the two-dimensional area of each organoid and infecting each at 1 IU/μm2. At 2 hpi, viral medium was removed, and organoids were treated with 10 μM MBV or DMSO. These compounds were replaced every 24 h, with treatments continuing for 14 days. The organoids were continuously rocked on a rocking shaker in the incubator during the course of the experiment. At 14 dpi, organoids were either dissociated and plated or fixed for staining. For dissociation, organoids were incubated with Accutase (ThermoFisher Scientific) and plated at a concentration of 3.0 × 10⁴ cells per well of a 24-well dish onto Matrigel-coated coverslips. At 1 h postplating, the cells were again treated with 1 μM MBV or DMSO. Treatments were replaced every 24 h for 14 days and then used for calcium imaging experiments.
Calcium imaging.
Calcium imaging experiments were performed as described previously (38). Briefly, live-cell calcium imaging was performed using the ratiometric dual-fluorescent calcium indicator FURA-2AM (ThermoFisher Scientific). Coverslips were loaded with 2.5 μl of FURA-2AM in 2% bovine serum albumin (BSA) in extracellular normal HEPES (ENH) buffer (150 μM NaCl, 10 μM HEPES, 8 μM glucose, 5.6 μM KCl, 2 μM CaCl2, 1 μM MgCl2) for 1 h, washed with ENH buffer for 20 min, and mounted onto a perfusion chamber. Bright-field and fluorescent images were taken before recordings. Coverslips were superfused with ENH buffer at 6 ml/min for 1 min prior to stimulation. To stimulate purinergic responses, coverslips were superfused with 10 μM ATP in ENH buffer for 1 min starting at 100 s after the start of recording. To stimulate voltage-gated channels, coverslips were superfused with 50 mM KCl in ENH buffer for 30 s at 175 s after the start of recording. Cells were washed with buffer between stimulations, with average baseline levels determined 30 s prior to each stimulation. NIS Elements (Nikon) was used for image acquisition and analysis. A region of interest (ROI) selection tool was used to record calcium signals from cells. Fifty ROIs were analyzed for fibroblasts, and 100 ROIs were used for both NPCs and dissociated organoids in each experiment. Data are plotted as the ratio of bound (340 nm) to unbound (380 nm) intracellular Ca2+ over time in seconds.
RNA and immunofluorescence analysis.
RNA was isolated from individual cortical organoids, and reverse transcription-PCR (RT-PCR) analysis was performed as previously described (37). Briefly, total RNA was isolated using an RNeasy Mini kit (Qiagen) with on-column DNase treatment, and cDNA was generated from 1 μg of total RNA using random hexamers and SuperScript III (Invitrogen). PCR was performed for Pax6 (5′-AACAGATGGGCGCAGACGGC-3′; 5′-GGGCTGTGTCTGTTCGGCCC-3′) and glyceraldehyde-3-phosphate dehydrogenase (GAPDH) (5′-GTGGACCTGACCTGCCGTCT-3′; 5′-GGAGGAGTGGGTGTCGCTGT-3′) at 94°C for 10 min followed by 30 cycles of 94°C for 1 min, 60°C for 1 min, and 72°C for 1.5 min. PCR was performed for Sox2 (5′-AGTCTCCAAGCGACGAAAAA-3′ and 5′-GCAAGAAGCCTCTCCTTG-3′) as described above using an annealing temperature of 55°C.
Cortical organoids were fixed with 4% paraformaldehyde (PFA) overnight at 4°C, washed with phosphate-buffered saline (PBS), and placed in 30% sucrose in PBS. Fixed organoids were then embedded in a cryosectioning mold using optimum cutting temperature (OCT) compound (Fisher Scientific) and frozen on dry ice. Cryosectioning was performed using a cryostat, and 20-μm sections were obtained. Sections were mounted directly after cryosectioning and allowed to dry before immunofluorescence analysis was performed. For immunofluorescence, sections were blocked with 5% normal donkey serum and 0.1% Triton in PBS for 30 min, incubated in primary antibodies overnight at 4°C, and incubated in secondary antibodies for 1 h at room temperature. The nuclear stain Hoechst was used to label nuclei. Primary antibodies used were Sox2 (rabbit, 09-0024; Stemgent), Pax6 (mouse; Developmental Studies Hybridoma Bank [DSHB]), Tuj1 (chicken, GTX85469; GeneTex), Tuj1 (mouse, T8660; Millipore Sigma), S100β (mouse, S2532; Millipore Sigma), and Ctip2 (rat, ab18465; Abcam). Species-appropriate fluorescent secondary antibodies were used. An upright TS100 Nikon fluorescence microscope and NIS Elements were used for imaging and analysis.
Statistical analysis.
At least three independent differentiations were performed for each experiment. Calcium imaging results were analyzed by analysis of variance (ANOVA), a chi-square test, Fisher’s exact test, and Student’s t test with multiple-comparison post hoc analysis as indicated in the figure legends. Significance level was determined at a P value of <0.05.
ACKNOWLEDGMENTS
We thank Erika Shaw for assistance with organoid immunocytochemistry and Xiaowen Bai and Thiago Aruza for assistance with the organoid protocol. We also thank Katie Cataldo, Olivia Koehn, and Rebekah Mokry for feedback, assistance with cell culture, and viral stock preparation. We thank Ravit Arav-Boger and the Arav-Boger and Hudson labs for their feedback on these studies. We thank the Department of Biostatistics for statistical analysis consultation.
A.J.J. was supported by the Maternal Fetal Medicine Fellowship Program in the Department of Obstetrics and Gynecology at the Medical College of Wisconsin. Research reported in this publication was supported by the National Institute of Allergy and Infectious Diseases division of the National Institutes of Health under award numbers R01AI132414 (A.D.E. and S.S.T.) and R01AI083281 (S.S.T.). The content is solely the responsibility of the authors and does not necessarily represent the official views of the National Institutes of Health.
We have no conflicts of interests related to the manuscript to declare.
S.L.S., A.J.J., S.S.T., and A.D.E. were responsible for study design. S.L.S., B.S.O., A.J.J., E.R.S., S.S.T., and A.D.E. conducted experiments and analyzed the data. S.L.S. and B.S.O. contributed to writing the manuscript. S.S.T. and A.D.E. wrote and edited the final manuscript.
REFERENCES
- 1.Mocarski ES, Shenk T, Griffiths PD, Pass RF. 2013. Cytomegaloviruses, p 1960–2014. In Knipe DM, Howley PM, Cohen JI, Griffin DE, Lamb RA, Martin MA, Rancaniello VR, Roizman B (ed), Fields virology, 6 ed, vol 2 Lippincott Williams & Wilkins, Philadelphia, PA. [Google Scholar]
- 2.Murphy E, Yu D, Grimwood J, Schmutz J, Dickson M, Jarvis MA, Hahn G, Nelson JA, Myers RM, Shenk TE. 2003. Coding potential of laboratory and clinical strains of human cytomegalovirus. Proc Natl Acad Sci U S A 100:14976–14981. doi: 10.1073/pnas.2136652100. [DOI] [PMC free article] [PubMed] [Google Scholar]
- 3.Weekes MP, Tomasec P, Huttlin EL, Fielding CA, Nusinow D, Stanton RJ, Wang EC, Aicheler R, Murrell I, Wilkinson GW, Lehner PJ, Gygi SP. 2014. Quantitative temporal viromics: an approach to investigate host-pathogen interaction. Cell 157:1460–1472. doi: 10.1016/j.cell.2014.04.028. [DOI] [PMC free article] [PubMed] [Google Scholar]
- 4.Stern-Ginossar N, Weisburd B, Michalski A, Le VT, Hein MY, Huang SX, Ma M, Shen B, Qian SB, Hengel H, Mann M, Ingolia NT, Weissman JS. 2012. Decoding human cytomegalovirus. Science 338:1088–1093. doi: 10.1126/science.1227919. [DOI] [PMC free article] [PubMed] [Google Scholar]
- 5.Britt WJ, Prichard MN. 2018. New therapies for human cytomegalovirus infections. Antiviral Res 159:153–174. doi: 10.1016/j.antiviral.2018.09.003. [DOI] [PubMed] [Google Scholar]
- 6.Pass RF, Arav-Boger R. 2018. Maternal and fetal cytomegalovirus infection: diagnosis, management, and prevention. F1000Res 7:255. doi: 10.12688/f1000research.12517.1. [DOI] [PMC free article] [PubMed] [Google Scholar]
- 7.Lancaster MA, Renner M, Martin CA, Wenzel D, Bicknell LS, Hurles ME, Homfray T, Penninger JM, Jackson AP, Knoblich JA. 2013. Cerebral organoids model human brain development and microcephaly. Nature 501:373–379. doi: 10.1038/nature12517. [DOI] [PMC free article] [PubMed] [Google Scholar]
- 8.Luo MH, Schwartz PH, Fortunato EA. 2008. Neonatal neural progenitor cells and their neuronal and glial cell derivatives are fully permissive for human cytomegalovirus infection. J Virol 82:9994–10007. doi: 10.1128/JVI.00943-08. [DOI] [PMC free article] [PubMed] [Google Scholar]
- 9.Cheeran MC, Hu S, Ni HT, Sheng W, Palmquist JM, Peterson PK, Lokensgard JR. 2005. Neural precursor cell susceptibility to human cytomegalovirus diverges along glial or neuronal differentiation pathways. J Neurosci Res 82:839–850. doi: 10.1002/jnr.20682. [DOI] [PubMed] [Google Scholar]
- 10.McCarthy M, Auger D, Whittemore SR. 2000. Human cytomegalovirus causes productive infection and neuronal injury in differentiating fetal human central nervous system neuroepithelial precursor cells. J Hum Virol 3:215–228. [PubMed] [Google Scholar]
- 11.Odeberg J, Wolmer N, Falci S, Westgren M, Sundtröm E, Seiger A, Söderberg-Nauclér C. 2007. Late human cytomegalovirus (HCMV) proteins inhibit differentiation of human neural precursor cells into astrocytes. J Neurosci Res 85:583–593. doi: 10.1002/jnr.21144. [DOI] [PubMed] [Google Scholar]
- 12.Pan X, Li XJ, Liu XJ, Yuan H, Li JF, Duan YL, Ye HQ, Fu YR, Qiao GH, Wu CC, Yang B, Tian XH, Hu KH, Miao LF, Chen XL, Zheng J, Rayner S, Schwartz PH, Britt WJ, Xu J, Luo MH. 2013. Later passages of neural progenitor cells from neonatal brain are more permissive for human cytomegalovirus infection. J Virol 87:10968–10979. doi: 10.1128/JVI.01120-13. [DOI] [PMC free article] [PubMed] [Google Scholar]
- 13.Gonzalez-Sanchez HM, Monsivais-Urenda A, Salazar-Aldrete CA, Hernandez-Salinas A, Noyola DE, Jimenez-Capdeville ME, Martinez-Serrano A, Castillo CG. 2015. Effects of cytomegalovirus infection in human neural precursor cells depend on their differentiation state. J Neurovirol 21:346–357. doi: 10.1007/s13365-015-0315-5. [DOI] [PubMed] [Google Scholar]
- 14.Luo MH, Hannemann H, Kulkarni AS, Schwartz PH, O'Dowd JM, Fortunato EA. 2010. Human cytomegalovirus infection causes premature and abnormal differentiation of human neural progenitor cells. J Virol 84:3528–3541. doi: 10.1128/JVI.02161-09. [DOI] [PMC free article] [PubMed] [Google Scholar]
- 15.Wu CC, Jiang X, Wang XZ, Liu XJ, Li XJ, Yang B, Ye HQ, Harwardt T, Jiang M, Xia HM, Wang W, Britt WJ, Paulus C, Nevels M, Luo MH. 2018. Human cytomegalovirus immediate early 1 protein causes loss of SOX2 from neural progenitor cells by trapping unphosphorylated STAT3 in the nucleus. J Virol 92:e00340-18. doi: 10.1128/JVI.00340-18. [DOI] [PMC free article] [PubMed] [Google Scholar]
- 16.Liu XJ, Yang B, Huang SN, Wu CC, Li XJ, Cheng S, Jiang X, Hu F, Ming YZ, Nevels M, Britt WJ, Rayner S, Tang Q, Zeng WB, Zhao F, Luo MH. 2017. Human cytomegalovirus IE1 downregulates Hes1 in neural progenitor cells as a potential E3 ubiquitin ligase. PLoS Pathog 13:e1006542. doi: 10.1371/journal.ppat.1006542. [DOI] [PMC free article] [PubMed] [Google Scholar]
- 17.Odeberg J, Wolmer N, Falci S, Westgren M, Seiger A, Soderberg-Naucler C. 2006. Human cytomegalovirus inhibits neuronal differentiation and induces apoptosis in human neural precursor cells. J Virol 80:8929–8939. doi: 10.1128/JVI.00676-06. [DOI] [PMC free article] [PubMed] [Google Scholar]
- 18.Bigley TM, McGivern JV, Ebert AD, Terhune SS. 2016. Impact of a cytomegalovirus kinase inhibitor on infection and neuronal progenitor cell differentiation. Antiviral Res 129:67–73. doi: 10.1016/j.antiviral.2016.02.007. [DOI] [PMC free article] [PubMed] [Google Scholar]
- 19.Reitsma JM, Sato H, Nevels M, Terhune SS, Paulus C. 2013. Human cytomegalovirus IE1 protein disrupts interleukin-6 signaling by sequestering STAT3 in the nucleus. J Virol 87:10763–10776. doi: 10.1128/JVI.01197-13. [DOI] [PMC free article] [PubMed] [Google Scholar]
- 20.D'Aiuto L, Di Maio R, Heath B, Raimondi G, Milosevic J, Watson AM, Bamne M, Parks WT, Yang L, Lin B, Miki T, Mich-Basso JD, Arav-Boger R, Sibille E, Sabunciyan S, Yolken R, Nimgaonkar V. 2012. Human induced pluripotent stem cell-derived models to investigate human cytomegalovirus infection in neural cells. PLoS One 7:e49700. doi: 10.1371/journal.pone.0049700. [DOI] [PMC free article] [PubMed] [Google Scholar]
- 21.Lin JH, Takano T, Arcuino G, Wang X, Hu F, Darzynkiewicz Z, Nunes M, Goldman SA, Nedergaard M. 2007. Purinergic signaling regulates neural progenitor cell expansion and neurogenesis. Dev Biol 302:356–366. doi: 10.1016/j.ydbio.2006.09.017. [DOI] [PMC free article] [PubMed] [Google Scholar]
- 22.Spitzer NC, Root CM, Borodinsky LN. 2004. Orchestrating neuronal differentiation: patterns of Ca2+ spikes specify transmitter choice. Trends Neurosci 27:415–421. doi: 10.1016/j.tins.2004.05.003. [DOI] [PubMed] [Google Scholar]
- 23.Gu X, Spitzer NC. 1995. Distinct aspects of neuronal differentiation encoded by frequency of spontaneous Ca2+ transients. Nature 375:784–787. doi: 10.1038/375784a0. [DOI] [PubMed] [Google Scholar]
- 24.Scemes E, Duval N, Meda P. 2003. Reduced expression of P2Y1 receptors in connexin43-null mice alters calcium signaling and migration of neural progenitor cells. J Neurosci 23:11444–11452. doi: 10.1523/JNEUROSCI.23-36-11444.2003. [DOI] [PMC free article] [PubMed] [Google Scholar]
- 25.Sanches G, de Alencar LS, Ventura AL. 2002. ATP induces proliferation of retinal cells in culture via activation of PKC and extracellular signal-regulated kinase cascade. Int J Dev Neurosci 20:21–27. doi: 10.1016/S0736-5748(02)00004-7. [DOI] [PubMed] [Google Scholar]
- 26.Lui JH, Hansen DV, Kriegstein AR. 2011. Development and evolution of the human neocortex. Cell 146:18–36. doi: 10.1016/j.cell.2011.06.030. [DOI] [PMC free article] [PubMed] [Google Scholar]
- 27.Keay S, Baldwin BR, Smith MW, Wasserman SS, Goldman WF. 1995. Increases in [Ca2+]i mediated by the 92.5-kDa putative cell membrane receptor for HCMV gp86. Am J Physiol 269:C11–C21. doi: 10.1152/ajpcell.1995.269.1.C11. [DOI] [PubMed] [Google Scholar]
- 28.Nokta M, Eaton D, Steinsland OS, Albrecht T. 1987. Ca2+ responses in cytomegalovirus-infected fibroblasts of human origin. Virology 157:259–267. doi: 10.1016/0042-6822(87)90268-6. [DOI] [PubMed] [Google Scholar]
- 29.Mercorelli B, Luganini A, Celegato M, Palu G, Gribaudo G, Loregian A. 2018. Repurposing the clinically approved calcium antagonist manidipine dihydrochloride as a new early inhibitor of human cytomegalovirus targeting the immediate-early 2 (IE2) protein. Antiviral Res 150:130–136. doi: 10.1016/j.antiviral.2017.12.014. [DOI] [PubMed] [Google Scholar]
- 30.Isler JA, Maguire TG, Alwine JC. 2005. Production of infectious human cytomegalovirus virions is inhibited by drugs that disrupt calcium homeostasis in the endoplasmic reticulum. J Virol 79:15388–15397. doi: 10.1128/JVI.79.24.15388-15397.2005. [DOI] [PMC free article] [PubMed] [Google Scholar]
- 31.Sharon-Friling R, Goodhouse J, Colberg-Poley AM, Shenk T. 2006. Human cytomegalovirus pUL37x1 induces the release of endoplasmic reticulum calcium stores. Proc Natl Acad Sci U S A 103:19117–19122. doi: 10.1073/pnas.0609353103. [DOI] [PMC free article] [PubMed] [Google Scholar]
- 32.McCormick AL, Smith VL, Chow D, Mocarski ES. 2003. Disruption of mitochondrial networks by the human cytomegalovirus UL37 gene product viral mitochondrion-localized inhibitor of apoptosis. J Virol 77:631–641. doi: 10.1128/jvi.77.1.631-641.2003. [DOI] [PMC free article] [PubMed] [Google Scholar]
- 33.Luganini A, Di Nardo G, Munaron L, Gilardi G, Fiorio Pla A, Gribaudo G. 2018. Human cytomegalovirus US21 protein is a viroporin that modulates calcium homeostasis and protects cells against apoptosis. Proc Natl Acad Sci U S A 115:E12370–E12377. doi: 10.1073/pnas.1813183115. [DOI] [PMC free article] [PubMed] [Google Scholar]
- 34.Wang X, Huong SM, Chiu ML, Raab-Traub N, Huang ES. 2003. Epidermal growth factor receptor is a cellular receptor for human cytomegalovirus. Nature 424:456–461. doi: 10.1038/nature01818. [DOI] [PubMed] [Google Scholar]
- 35.Penfold ME, Dairaghi DJ, Duke GM, Saederup N, Mocarski ES, Kemble GW, Schall TJ. 1999. Cytomegalovirus encodes a potent alpha chemokine. Proc Natl Acad Sci U S A 96:9839–9844. doi: 10.1073/pnas.96.17.9839. [DOI] [PMC free article] [PubMed] [Google Scholar]
- 36.Vieira J, Schall TJ, Corey L, Geballe AP. 1998. Functional analysis of the human cytomegalovirus US28 gene by insertion mutagenesis with the green fluorescent protein gene. J Virol 72:8158–8165. [DOI] [PMC free article] [PubMed] [Google Scholar]
- 37.Ebert AD, Shelley BC, Hurley AM, Onorati M, Castiglioni V, Patitucci TN, Svendsen SP, Mattis VB, McGivern JV, Schwab AJ, Sareen D, Kim HW, Cattaneo E, Svendsen CN. 2013. EZ spheres: a stable and expandable culture system for the generation of pre-rosette multipotent stem cells from human ESCs and iPSCs. Stem Cell Res 10:417–427. doi: 10.1016/j.scr.2013.01.009. [DOI] [PMC free article] [PubMed] [Google Scholar]
- 38.McGivern JV, Patitucci TN, Nord JA, Barabas MA, Stucky CL, Ebert AD. 2013. Spinal muscular atrophy astrocytes exhibit abnormal calcium regulation and reduced growth factor production. Glia 61:1418–1428. doi: 10.1002/glia.22522. [DOI] [PMC free article] [PubMed] [Google Scholar]
- 39.Pankratz MT, Li XJ, Lavaute TM, Lyons EA, Chen X, Zhang SC. 2007. Directed neural differentiation of human embryonic stem cells via an obligated primitive anterior stage. Stem Cells 25:1511–1520. doi: 10.1634/stemcells.2006-0707. [DOI] [PMC free article] [PubMed] [Google Scholar]
- 40.Kriegstein A, Alvarez-Buylla A. 2009. The glial nature of embryonic and adult neural stem cells. Annu Rev Neurosci 32:149–184. doi: 10.1146/annurev.neuro.051508.135600. [DOI] [PMC free article] [PubMed] [Google Scholar]
- 41.Elkabetz Y, Panagiotakos G, Al Shamy G, Socci ND, Tabar V, Studer L. 2008. Human ES cell-derived neural rosettes reveal a functionally distinct early neural stem cell stage. Genes Dev 22:152–165. doi: 10.1101/gad.1616208. [DOI] [PMC free article] [PubMed] [Google Scholar]
- 42.Koch P, Opitz T, Steinbeck JA, Ladewig J, Brustle O. 2009. A rosette-type, self-renewing human ES cell-derived neural stem cell with potential for in vitro instruction and synaptic integration. Proc Natl Acad Sci U S A 106:3225–3230. doi: 10.1073/pnas.0808387106. [DOI] [PMC free article] [PubMed] [Google Scholar]
- 43.Gotz M, Stoykova A, Gruss P. 1998. Pax6 controls radial glia differentiation in the cerebral cortex. Neuron 21:1031–1044. doi: 10.1016/S0896-6273(00)80621-2. [DOI] [PubMed] [Google Scholar]
- 44.Heins N, Malatesta P, Cecconi F, Nakafuku M, Tucker KL, Hack MA, Chapouton P, Barde YA, Gotz M. 2002. Glial cells generate neurons: the role of the transcription factor Pax6. Nat Neurosci 5:308–315. doi: 10.1038/nn828. [DOI] [PubMed] [Google Scholar]
- 45.Bertrand N, Castro DS, Guillemot F. 2002. Proneural genes and the specification of neural cell types. Nat Rev Neurosci 3:517–530. doi: 10.1038/nrn874. [DOI] [PubMed] [Google Scholar]
- 46.Campbell K, Gotz M. 2002. Radial glia: multi-purpose cells for vertebrate brain development. Trends Neurosci 25:235–238. doi: 10.1016/S0166-2236(02)02156-2. [DOI] [PubMed] [Google Scholar]
- 47.Arlotta P, Molyneaux BJ, Chen J, Inoue J, Kominami R, Macklis JD. 2005. Neuronal subtype-specific genes that control corticospinal motor neuron development in vivo. Neuron 45:207–221. doi: 10.1016/j.neuron.2004.12.036. [DOI] [PubMed] [Google Scholar]
- 48.Qian X, Nguyen HN, Jacob F, Song H, Ming GL. 2017. Using brain organoids to understand Zika virus-induced microcephaly. Development 144:952–957. doi: 10.1242/dev.140707. [DOI] [PMC free article] [PubMed] [Google Scholar]
- 49.Gabriel E, Ramani A, Karow U, Gottardo M, Natarajan K, Gooi LM, Goranci-Buzhala G, Krut O, Peters F, Nikolic M, Kuivanen S, Korhonen E, Smura T, Vapalahti O, Papantonis A, Schmidt-Chanasit J, Riparbelli M, Callaini G, Krönke M, Utermöhlen O, Gopalakrishnan J. 2017. Recent Zika virus isolates induce premature differentiation of neural progenitors in human brain organoids. Cell Stem Cell 20:397–406.e5. doi: 10.1016/j.stem.2016.12.005. [DOI] [PubMed] [Google Scholar]
- 50.Cugola FR, Fernandes IR, Russo FB, Freitas BC, Dias JLM, Guimarães KP, Benazzato C, Almeida N, Pignatari GC, Romero S, Polonio CM, Cunha I, Freitas CL, Brandão WN, Rossato C, Andrade DG, Faria DDP, Garcez AT, Buchpigel CA, Braconi CT, Mendes E, Sall AA, Zanotto PMDA, Peron JPS, Muotri AR, Beltrão-Braga PCB. 2016. The Brazilian Zika virus strain causes birth defects in experimental models. Nature 534:267–271. doi: 10.1038/nature18296. [DOI] [PMC free article] [PubMed] [Google Scholar]
- 51.Garcez PP, Loiola EC, Madeiro da Costa R, Higa LM, Trindade P, Delvecchio R, Nascimento JM, Brindeiro R, Tanuri A, Rehen SK. 2016. Zika virus impairs growth in human neurospheres and brain organoids. Science 352:816–818. doi: 10.1126/science.aaf6116. [DOI] [PubMed] [Google Scholar]
- 52.Spitzer NC. 2006. Electrical activity in early neuronal development. Nature 444:707–712. doi: 10.1038/nature05300. [DOI] [PubMed] [Google Scholar]
- 53.Zheng JQ, Poo MM. 2007. Calcium signaling in neuronal motility. Annu Rev Cell Dev Biol 23:375–404. doi: 10.1146/annurev.cellbio.23.090506.123221. [DOI] [PubMed] [Google Scholar]
- 54.Rosenberg SS, Spitzer NC. 2011. Calcium signaling in neuronal development. Cold Spring Harb Perspect Biol 3:a004259. doi: 10.1101/cshperspect.a004259. [DOI] [PMC free article] [PubMed] [Google Scholar]
- 55.Toth AB, Shum AK, Prakriya M. 2016. Regulation of neurogenesis by calcium signaling. Cell Calcium 59:124–134. doi: 10.1016/j.ceca.2016.02.011. [DOI] [PMC free article] [PubMed] [Google Scholar]
- 56.Somasundaram A, Shum AK, McBride HJ, Kessler JA, Feske S, Miller RJ, Prakriya M. 2014. Store-operated CRAC channels regulate gene expression and proliferation in neural progenitor cells. J Neurosci 34:9107–9123. doi: 10.1523/JNEUROSCI.0263-14.2014. [DOI] [PMC free article] [PubMed] [Google Scholar]
- 57.Papanayotou C, De Almeida I, Liao P, Oliveira NM, Lu SQ, Kougioumtzidou E, Zhu L, Shaw A, Sheng G, Streit A, Yu D, Wah Soong T, Stern CD. 2013. Calfacilitin is a calcium channel modulator essential for initiation of neural plate development. Nat Commun 4:1837. doi: 10.1038/ncomms2864. [DOI] [PMC free article] [PubMed] [Google Scholar]
- 58.Komuro H, Rakic P. 1996. Intracellular Ca2+ fluctuations modulate the rate of neuronal migration. Neuron 17:275–285. doi: 10.1016/S0896-6273(00)80159-2. [DOI] [PubMed] [Google Scholar]
- 59.Bando Y, Irie K, Shimomura T, Umeshima H, Kushida Y, Kengaku M, Fujiyoshi Y, Hirano T, Tagawa Y. 2016. Control of spontaneous Ca2+ transients is critical for neuronal maturation in the developing neocortex. Cereb Cortex 26:106–117. doi: 10.1093/cercor/bhu180. [DOI] [PubMed] [Google Scholar]
- 60.Liu X, Hashimoto-Torii K, Torii M, Ding C, Rakic P. 2010. Gap junctions/hemichannels modulate interkinetic nuclear migration in the forebrain precursors. J Neurosci 30:4197–4209. doi: 10.1523/JNEUROSCI.4187-09.2010. [DOI] [PMC free article] [PubMed] [Google Scholar]
- 61.Dhanwani R, Khan M, Alam SI, Rao PV, Parida M. 2011. Differential proteome analysis of chikungunya virus-infected new-born mice tissues reveal implication of stress, inflammatory and apoptotic pathways in disease pathogenesis. Proteomics 11:1936–1951. doi: 10.1002/pmic.201000500. [DOI] [PubMed] [Google Scholar]
- 62.Sengupta N, Ghosh S, Vasaikar SV, Gomes J, Basu A. 2014. Modulation of neuronal proteome profile in response to Japanese encephalitis virus infection. PLoS One 9:e90211. doi: 10.1371/journal.pone.0090211. [DOI] [PMC free article] [PubMed] [Google Scholar]
- 63.Beys-da-Silva WO, Rosa RL, Santi L, Berger M, Park SK, Campos AR, Terraciano P, Varela APM, Teixeira TF, Roehe PM, Quincozes-Santos A, Yates JR III, Souza DO, Cirne-Lima EO, Guimaraes JA. 30 October 2018. Zika virus infection of human mesenchymal stem cells promotes differential expression of proteins linked to several neurological diseases. Mol Neurobiol doi: 10.1007/s12035-018-1417-x. [DOI] [PMC free article] [PubMed] [Google Scholar]
- 64.Wang D, Li G, Schauflinger M, Nguyen CC, Hall ED, Yurochko AD, von Einem J, Kamil JP. 2013. The ULb′ region of the human cytomegalovirus genome confers an increased requirement for the viral protein kinase UL97. J Virol 87:6359–6376. doi: 10.1128/JVI.03477-12. [DOI] [PMC free article] [PubMed] [Google Scholar]
- 65.Xu M, Lee EM, Wen Z, Cheng Y, Huang WK, Qian X, Tcw J, Kouznetsova J, Ogden SC, Hammack C, Jacob F, Nguyen HN, Itkin M, Hanna C, Shinn P, Allen C, Michael SG, Simeonov A, Huang W, Christian KM, Goate A, Brennand KJ, Huang R, Xia M, Ming GL, Zheng W, Song H, Tang H. 2016. Identification of small-molecule inhibitors of Zika virus infection and induced neural cell death via a drug repurposing screen. Nat Med 22:1101–1107. doi: 10.1038/nm.4184. [DOI] [PMC free article] [PubMed] [Google Scholar]
- 66.Sinzger C, Hahn G, Digel M, Katona R, Sampaio KL, Messerle M, Hengel H, Koszinowski U, Brune W, Adler B. 2008. Cloning and sequencing of a highly productive, endotheliotropic virus strain derived from human cytomegalovirus TB40/E. J Gen Virol 89:359–368. doi: 10.1099/vir.0.83286-0. [DOI] [PubMed] [Google Scholar]
- 67.Umashankar M, Petrucelli A, Cicchini L, Caposio P, Kreklywich CN, Rak M, Bughio F, Goldman DC, Hamlin KL, Nelson JA, Fleming WH, Streblow DN, Goodrum F. 2011. A novel human cytomegalovirus locus modulates cell type-specific outcomes of infection. PLoS Pathog 7:e1002444. doi: 10.1371/journal.ppat.1002444. [DOI] [PMC free article] [PubMed] [Google Scholar]
- 68.Riedel M, Jou CJ, Lai S, Lux RL, Moreno AP, Spitzer KW, Christians E, Tristani-Firouzi M, Benjamin IJ. 2014. Functional and pharmacological analysis of cardiomyocytes differentiated from human peripheral blood mononuclear-derived pluripotent stem cells. Stem Cell Rep 3:131–141. doi: 10.1016/j.stemcr.2014.04.017. [DOI] [PMC free article] [PubMed] [Google Scholar]
- 69.Ebert AD, Yu J, Rose FF Jr, Mattis VB, Lorson CL, Thomson JA, Svendsen CN. 2009. Induced pluripotent stem cells from a spinal muscular atrophy patient. Nature 457:277–280. doi: 10.1038/nature07677. [DOI] [PMC free article] [PubMed] [Google Scholar]
- 70.Schwab AJ, Ebert AD. 2015. Neurite aggregation and calcium dysfunction in iPSC-derived sensory neurons with Parkinson’s disease-related LRRK2 G2019S mutation. Stem Cell Rep 5:1039–1052. doi: 10.1016/j.stemcr.2015.11.004. [DOI] [PMC free article] [PubMed] [Google Scholar]


