Abstract
The temporal trend of hospitalizations, cost, and outcomes associated with preeclampsia with severe features have been inadequately studied. The publicly available Healthcare Cost and Utilization Project (HCUP) National Inpatient Sample (NIS) database was accessed to examine the temporal trend of total number of discharges, age, death, and mean charges per admission associated with preeclampsia with severe features. Eleven-year temporal trends (2004 to 2014) of these measures were compared using linear regression and run charts using the statistical process control rule. From 2004 to 2014, the total number of discharges related to preeclampsia with severe features increased both for Hawai‘i and the U.S. (United States) (Hawai‘i: 104 to 231; U.S.: 35,082 to 55,235; both P<.0001). The corresponding rates of discharges per 100,000 population also both increased (Hawai‘i: 8.2 to 16.3; U.S.: 12.0 to 17.3; both P<.0001). Comparing the temporal trends between Hawai‘i and the U.S., Hawai‘i had a significantly higher average annual increase in the rate of incidence than the national level (an annual increase rate of 9.2% in Hawai‘i vs 4.2% nationally; P=.0004). The cost of hospitalization for preeclampsia with severe features also showed an increased trend for both Hawai‘i and the U.S. (Hawai‘i: 33.1% increase, P=.0005; U.S.: 41.1% increase, P<.0001). In the U.S., in-hospital mortality rates associated with this condition decreased from 0.09% in 2004 to 0.02% in 2014 (P=.03). In conclusion, the number of discharges related to preeclampsia with severe features increased over an 11-year period in Hawai‘i and the U.S., and the rate of increase was higher in Hawai‘i than the U.S. Maternal mortality rates from this condition also declined over the study period.
Keywords: Preeclampsia, preeclampsia with severe features, temporal trends
Introduction
Preeclampsia is a pregnancy-specific hypertensive disorder that complicates 3%–6% of pregnancies1 and is one of the leading causes of maternal morbidity and mortality worldwide.2–4 In the U.S., the prevalence of preeclampsia has increased over the past three decades, affecting 2.4% of pregnancies in 1980 to 3.8% in 2010.1,5 This increase in incidence seems, in part, due to recent trends of delaying pregnancies to a later age and the increased rate of obesity and cardiovascular risk factors among pregnant women.1,6–8 Furthermore, racial minorities are at higher risk for preeclampsia.7,9 A recent study showed that Native Hawaiians, Other Pacific Islanders, and Filipinas are at higher risk compared to Whites and Asians.10
Preeclampsia with severe features is a separate clinical entity that is distinguished from a diagnosis of preeclampsia without severe features since it has higher rate of morbidity and mortality. Preeclampsia with severe features is defined as new onset hypertension in pregnancies greater than 20 weeks gestation and includes a systolic blood pressure of ≥ 160 mmHg or a diastolic blood pressure of ≥ 110 mmHg, pulmonary edema, liver transaminase levels two times the upper limit of normal, elevated creatinine levels, severe persistent right upper-quadrant pain, or new-onset cerebral or visual disturbances.11 Women who have preeclampsia with severe features require hospitalization for fetal and maternal monitoring, as the condition is associated with increased risk of maternal mortality and higher rates of maternal morbidities, such as eclampsia, pulmonary edema, acute renal or liver failure, and stroke.12,13
Over the last three decades, the diagnostic criteria used to define preeclampsia and management of the syndrome has been modified several times.14,15 Most recently, presence of proteinuria and peripheral edema are not required for diagnosis, where signs of end organ damage and blood pressure requiring urgent therapy signify presence of the syndrome.14,16 Although no preventative intervention has been shown to change the overall incidence of preeclampsia, the use of low-dose aspirin does appear to reduce the risk of preeclampsia in women with risk factors.14,15 Notably, patients with preeclampsia with severe features and eclampsia often require more frequent monitoring, interventions, and a higher level of care, and require a longer length of hospital stay compared to those without severe features.15
It has been estimated that the diagnosis of preeclampsia increases hospitalization costs by $6,583 per birth to manage underlying associated comorbidities simultaneous to preeclampsia.5 In 2012, the cost of preeclampsia within the first 12 months of delivery was $2.18 billion in the U.S. due to prolonged monitoring and therapeutic procedures required to manage this condition and the cost associated with caring for births of early gestational age.5,17 These types of tertiary intensive care that require longer hospital stay, additional diagnostic tests, and therapeutic procedures may contribute to the ever-increasing cost of health care.18 In Hawai‘i, the cost burden of other acute medical conditions have been reported to be disproportionately placed on Asians and Pacific Islanders, compared to Whites.19 Given the disparity in incidence, cost, and outcome of other medical conditions between Hawai‘i and the U.S., it would be important to assess whether a similar difference may exist for preeclampsia. To date, temporal trends of hospitalization, cost and outcome associated specifically to preeclampsia with severe features in Hawai‘i, compared to the mainland U.S., have been inadequately studied. Thus, we sought to assess changes in the number of hospitalizations and age of the patient and hospital charges associated with preeclampsia with severe features over an 11-year period. Comparison of the data between Hawai‘i and the United States were evaluated to assess any geographic differences.
Methods
Data Source
We obtained data for this study from HCUPnet, a public online query system from the Healthcare Cost and Utilization Project (HCUP) managed by the Agency for Healthcare Research and Quality (AHRQ). HCUP databases are derived from administrative data and contain aggregate data of clinical and nonclinical information including diagnoses and procedures, discharge status, patient demographics, and charges for each state. Since we utilized publicly-accessible, de-identified administrative level, aggregate data, rather than patient-specific data, this study was exempt from institutional review board approval. We accessed the data by searching inpatient statistics specifically related to preeclampsia with severe features. The ICD-9-CM codes used to abstract the data on preeclampsia with severe features were 642.5x. We retrieved nationwide and state inpatient statistics on the total number of discharges, age (mean), length of stay, hospital charges, and deaths from the years 2004 to 2014. The dataset accounted for a total of 473,286 discharges.
Statistical Analysis
The data were summarized by descriptive statistics. All hospital charge data were inflated-adjusted using the appropriate Consumer Price Index (https://www.bls.gov/cpi/) and converted to 2014 U.S. dollars. We compared the 11-year temporal trends using simple linear regression by SAS version 9.4 (SAS Institute Inc., Cary, NC), where raw discharge data were first adjusted by population census data (www.census.gov) for both U.S. and Hawai’i, per 100,000 population level. To examine the interaction of the temporal trends between U.S. and Hawai‘i, the population-adjusted discharge data were first transformed into percentages relative to 2004 data before regression analyses, to alleviate the impact of different magnitude scales between U.S. and Hawai‘i data. Nonrandom temporal trends (or “specialcause variation”) were also demonstrated by run charts using the statistical process control decision rule.20 there are 6 or more consecutive data points always going up or going down over time. Two-sided P < .05 was considered statistically significant without multiple comparison adjustments.
Results
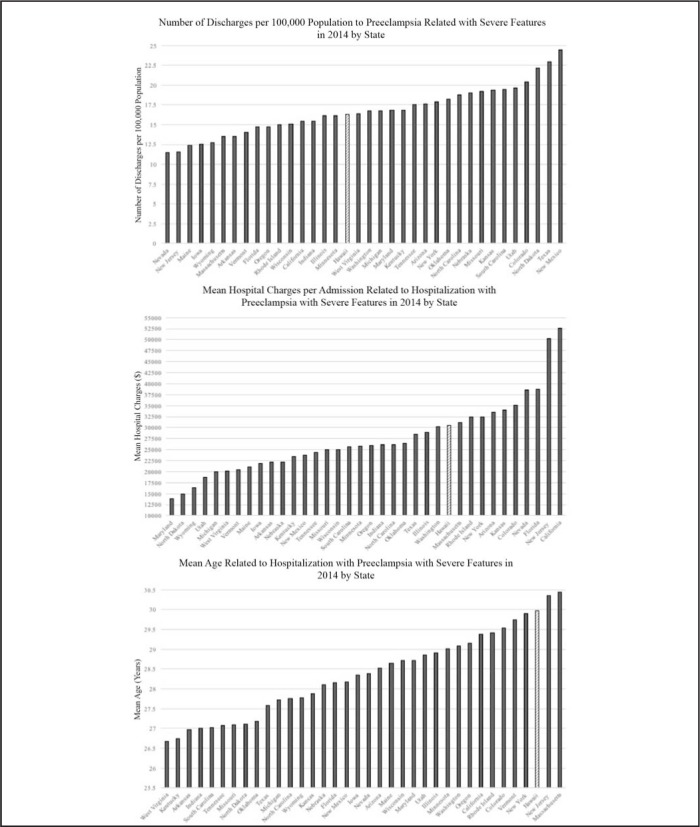
A cross-sectional state-by-state comparison of discharges, hospital charges, and mean age related to preeclampsia with severe features in 2014 is illustrated in Figure 1. A total of 36 states had data related to preeclampsia with severe features in 2014. Among the 36 states, Hawai‘i ranked 17th lowest in hospitalizations (16.3 discharges per 100,000 persons), 26th in hospital charges ($30,599), and 34th in mean age (30.0 years).
Figure 1.

Cross Sectional State-by-State Comparisons of Preeclampsia with Severe Features in 2014 Regarding (Top) Discharges, (Middle) Hospital Charge, and (Bottom) Mean Age of Patients.
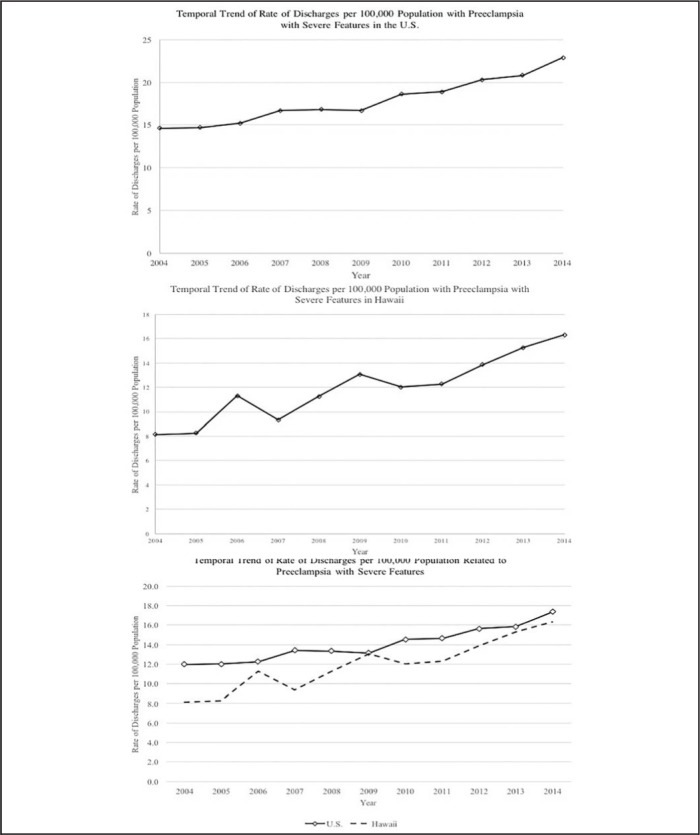
Temporal trends of hospitalizations with severe preeclampsia are shown in Figure 2. Nationally, after population adjustment, the total number of discharges significantly increased (P < .0001) from 35,082 in 2004 to 55,235 in 2014 by an average annual increase rate of 4.2% (95% CI = 3.4%-5.1%). From 2009 and 2014, the total number of discharges with preeclampsia with severe features consistently increased each year, which was statistically significant using the statistical process control decision rule. In Hawai‘i, after population adjustment, the total number of discharges also significantly increased (P < .0001) from 104 in 2004 to 231 in 2014 with an average annual increase rate of 9.2% (95% CI = 6.8%–11.7%). Assessing the interaction of the temporal trend of discharges between the United States and Hawai‘i demonstrated that Hawai‘i had a significantly higher average increase in the rate of discharges compared to the national level (P = .0004). The estimated difference in the slopes of Hawai‘i and the nation was 5.0% (95% CI = 2.6%–7.4%). Similar estimates were found if we further adjusted for annual mean age in the regression analyses: 5.0% (95% CI = 2.5%7.5%, P = .0006).
Figure 2.

11-Year Temporal Trends of Discharges Related to Preeclampsia with Severe Features in (Top) the United States and (Middle) Hawai‘i; and Temporal Trend of Rate of Discharges per 100,000 Population Related to Preeclampsia with Severe Features in the United States and Hawai‘i (bottom).
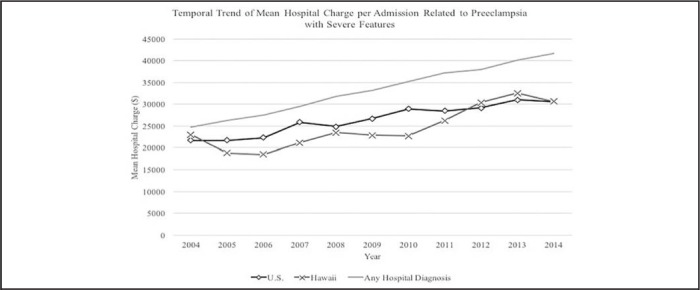
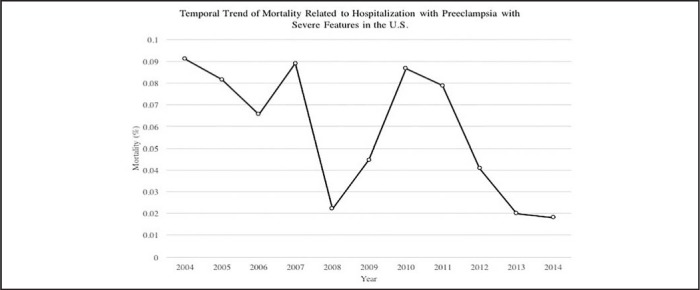
Overall, Figure 3 shows the regression results of mean hospital charges per admission associated with preeclampsia with severe features have been increasing from 2004 to 2014 even after adjusting for inflation. Nationally, the mean charge per hospitalization changed from $21,700 in 2004 to $30,622 in 2014 by a mean increase of $1,016 per year (95% CI = $817- 1,214, P < .0001). In Hawai‘i, the mean charge increased from $22,982 in 2004 to $30,599 in 2014 by an average increase of $1,257 per year (95% CI = $724–1,791, P = .0005). The hospital charges associated with preeclampsia with severe features in the U.S. and in Hawai‘i both follow the steady up trend found in the hospital charges associated with any hospital diagnosis, suggesting that the rate of increase is not significantly higher than the increased rate of overall healthcare costs. Lastly, the 11-year national trend (2004–2014) of mortality due to preeclampsia with severe features significantly decreased from 0.09% in 2004 to 0.02% in 2014 (Figure 4) (annual reduction of 0.0058%, P = .029).
Figure 3.

11-Year Temporal Trend of Mean Hospital Charges per Admission Associated with Preeclampsia with Severe Features in the United States and Hawai‘i.
Figure 4.

11-year U.S. Trend of Mortality Due to Preeclampsia with Severe Features.
Discussion
Overall, there was an increased rate of hospitalization in patients with preeclampsia with severe features for both the U.S. and the State of Hawai‘i from 2004 to 2014. The national trend of hospitalization had an overall 57.4% increase in 11 years, which is consistent with previous population-based studies.1,21 The significant finding of this study is that Hawai‘i had a greater temporal increase in hospitalizations with preeclampsia with severe features, with an overall 122.1% increase in an 11-year period compared to the U.S. This increase in the rate of hospitalization for this condition is disproportionately higher than the 1.4% increase of livebirths for Hawai‘i (hhdw.org). More public awareness and further study to assess the factors contributing to this disproportionate increase in the rate of preeclampsia with severe features in Hawai‘i may be needed.
Risk factors for preeclampsia include obesity, pregestational diabetes, preexisting hypertension, those with a family history of preeclampsia, and women who suffer from medical conditions such as antiphospholipid syndrome.6,7,22 Hawai‘i has high proportion of Asian Americans, Native Hawaiians, and Pacific Islanders, with some ethnic groups having higher prevalence of obesity, diabetes, and hypertension compared to Whites.10,23–25
If the population of ethnic minority groups with high cardiovascular risks are increasing in Hawai‘i, it may potentially contribute to the observed increase in the rates of preeclampsia with severe features in Hawai‘i. However, the data on the temporal change in high-risk ethnic populations in Hawai‘i is lacking, and thus this is speculative.
The analyses of the mean hospital charges associated with this condition demonstrated a significant increase from 2004 to 2014 both nationally and in Hawai‘i. There was a steady national mean increase of $1,016/year, and the rate of increase in Hawai‘i was found to be on average $1,257/year. The increase in hospital charges associated with preeclampsia with severe features in the nation and in Hawai‘i correspond to the up-trend found in the hospital charges associated with any hospital diagnosis, suggesting that the increased rate of costs for preeclampsia was driven by an increase in healthcare costs in general rather than costs specific to this diagnosis. Lastly, the in-hospital mortality rate due to preeclampsia with severe features did show a statistically significant decrease from 2004 to 2014.
There are some limitations to our study, which are mostly associated with the lack of patient-level, detailed clinical information due to the use of a claims database. Since the database did not provide statistics on all the states, the 36 states that were used to generalize the statistics on preeclampsia with severe features may not accurately represent the United States. Furthermore, the diagnostic criteria of preeclampsia with severe features have changed during the period that was analyzed for this study, which may have affected the number of reported diagnoses. Lastly, the reported cost in this study was limited to the charges associated with maternal hospitalization and did not account for any potential cost-savings associated with neonatal hospitalization.
In summary, we showed a significantly increasing rate of preeclampsia with severe features in Hawai‘i compared to the nation, and a marginal decrease in mortality rates despite substantial increases in the health care expenditures related to preeclampsia with severe features. The rate of preeclampsia with severe features in Hawai‘i is increasing at a concerning rate.
Conflict of Interest
None of the authors identify any conflicts of interest.
References
- 1.Ananth CV, Keyes KM, Wapner RJ. Pre-eclampsia rates in the United States, 1980–2010: age-period-cohort analysis. BMJ: British Medical Journal. 2013;347 doi: 10.1136/bmj.f6564. [DOI] [PMC free article] [PubMed] [Google Scholar]
- 2.Khan KS, Wojdyla D, Say L, Gulmezoglu AM, Van Look PF. WHO analysis of causes of maternal death: a systematic review. Lancet. 2006;367:1066–74. doi: 10.1016/S0140-6736(06)68397-9. [DOI] [PubMed] [Google Scholar]
- 3.Kuklina EV, Ayala C, Callaghan WM. Hypertensive disorders and severe obstetric morbidity in the United States. Obstetrics and Gynecology. 2009;113:1299–306. doi: 10.1097/AOG.0b013e3181a45b25. [DOI] [PubMed] [Google Scholar]
- 4.Liu S, Joseph KS, Bartholomew S, et al. Temporal trends and regional variations in severe maternal morbidity in Canada, 2003 to 2007. Journal of Obstetrics and Gynaecology. Canada : JOGC = Journal d’obstetrique et gynecologie du Canada : JOGC. 2010;32:847–55. doi: 10.1016/S1701-2163(16)34656-4. [DOI] [PubMed] [Google Scholar]
- 5.Stevens W, Shih T, Incerti D, et al. Short-term costs of preeclampsia to the United States health care system. American Journal of Obstetrics and Gynecology. 2017;217:237–48. doi: 10.1016/j.ajog.2017.04.032. [DOI] [PubMed] [Google Scholar]
- 6.English FA, Kenny LC, McCarthy FP. Risk factors and effective management of preeclampsia. Integrated Blood Pressure Control. 2015;8:7–12. doi: 10.2147/IBPC.S50641. [DOI] [PMC free article] [PubMed] [Google Scholar]
- 7.Pare E, Parry S, McElrath TF, Pucci D, Newton A, Lim KH. Clinical risk factors for preeclampsia in the 21st century. Obstetrics and Gynecology. 2014;124:763–70. doi: 10.1097/AOG.0000000000000451. [DOI] [PubMed] [Google Scholar]
- 8.Steegers EA, von Dadelszen P, Duvekot JJ, Pijnenborg R. Pre-eclampsia. Lancet. 2010;376:631–44. doi: 10.1016/S0140-6736(10)60279-6. [DOI] [PubMed] [Google Scholar]
- 9.Jian G, A. SD, R. SC, M. ES. Maternal ethnicity and pre-eclampsia in New York City, 1995–2003. Paediatric and Perinatal Epidemiology. 2012;26:45–52. doi: 10.1111/j.1365-3016.2011.01222.x. [DOI] [PMC free article] [PubMed] [Google Scholar]
- 10.Nakagawa K, Lim E, Harvey S, Miyamura J, Juarez DT. Racial/Ethnic Disparities in the Association Between Preeclampsia Risk Factors and Preeclampsia Among Women Residing in Hawaii. Matern Child Health J. 2016;20:1814–24. doi: 10.1007/s10995-016-1984-2. [DOI] [PMC free article] [PubMed] [Google Scholar]
- 11.Leeman L, Dresang LT, Fontaine P. Hypertensive Disorders of Pregnancy. American Family Physician. 2016;93:121–7. [PubMed] [Google Scholar]
- 12.Nankali A, Malek-khosravi S, Zangeneh M, Rezaei M, Hemati Z, Kohzadi M. Maternal Complications Associated with Severe Preeclampsia. Journal of Obstetrics and Gynaecology of India. 2013;63:112–5. doi: 10.1007/s13224-012-0283-0. [DOI] [PMC free article] [PubMed] [Google Scholar]
- 13.Ghulmiyyah L, Sibai B. Maternal mortality from preeclampsia/eclampsia. Seminars in Perinatology. 2012;36:56–9. doi: 10.1053/j.semperi.2011.09.011. [DOI] [PubMed] [Google Scholar]
- 14.Jackson JR, Gregg AR. Updates on the Recognition, Prevention and Management of Hypertension in Pregnancy. Obstetrics and Gynecology Clinics of North America. 2017;44:219–30. doi: 10.1016/j.ogc.2017.02.007. [DOI] [PubMed] [Google Scholar]
- 15.Snydal S. Major changes in diagnosis and management of preeclampsia. Journal of Midwifery & Women’s Health. 2014;59:596–605. doi: 10.1111/jmwh.12260. [DOI] [PubMed] [Google Scholar]
- 16.Hypertension in pregnancy. Report of the American College of Obstetricians and Gynecologists’ Task Force on Hypertension in Pregnancy. Obstetrics and Gynecology. 2013;122:1122–31. doi: 10.1097/01.AOG.0000437382.03963.88. [DOI] [PubMed] [Google Scholar]
- 17.Li R, Tsigas EZ, Callaghan WM. Health and economic burden of preeclampsia: no time for complacency. American Journal of Obstetrics & Gynecology. 2017;217:235–6. doi: 10.1016/j.ajog.2017.06.011. [DOI] [PMC free article] [PubMed] [Google Scholar]
- 18.Fred HL. Cutting the Cost of Health Care: The Physician’s Role. Texas Heart Institute Journal. 2016;43:4–6. doi: 10.14503/THIJ-15-5646. [DOI] [PMC free article] [PubMed] [Google Scholar]
- 19.Sentell TL, Ahn HJ, Miyamura J, Juarez DT. Cost Burden of Potentially Preventable Hospitalizations for Cardiovascular Disease and Diabetes for Asian Americans, Pacific Islanders, and Whites in Hawai‘i. J Health Care Poor Underserved. 2015 May;26((2 Suppl)):63–82. doi: 10.1353/hpu.2015.0068. [DOI] [PMC free article] [PubMed] [Google Scholar]
- 20.Perla RJ, Provost LP, Murray SK. The run chart: a simple analytical tool for learning from variation in healthcare processes. BMJ Qual Saf. 2011;20:46–51. doi: 10.1136/bmjqs.2009.037895. [DOI] [PubMed] [Google Scholar]
- 21.Wallis AB, Saftlas AF, Hsia J, Atrash HK. Secular trends in the rates of preeclampsia, eclampsia, and gestational hypertension, United States, 1987–2004. American Journal of Hypertension. 2008;21:521–6. doi: 10.1038/ajh.2008.20. [DOI] [PubMed] [Google Scholar]
- 22.Turner JA. Diagnosis and management of pre-eclampsia: an update. International Journal of Women’s Health. 2010;2:327–37. doi: 10.2147/IJWH.S8550. [DOI] [PMC free article] [PubMed] [Google Scholar]
- 23.Mau MK, Sinclair K, Saito EP, Baumhofer KN, Kaholokula JK. Cardiometabolic health disparities in native Hawaiians and other Pacific Islanders. Epidemiologic Reviews. 2009;31:113–29. doi: 10.1093/ajerev/mxp004. [DOI] [PMC free article] [PubMed] [Google Scholar]
- 24.Aluli NE, Reyes PW, Tsark J. Cardiovascular disease disparities in native Hawaiians. Journal of the Cardiometabolic Syndrome. 2007;2:250–3. doi: 10.1111/j.1559-4564.2007.07560.x. [DOI] [PubMed] [Google Scholar]
- 25.Moy KL, Sallis JF, David KJ. Health Indicators of Native Hawaiian and Pacific Islanders in the United States. Journal of Community Health. 2010;35:81–92. doi: 10.1007/s10900-009-9194-0. [DOI] [PMC free article] [PubMed] [Google Scholar]


