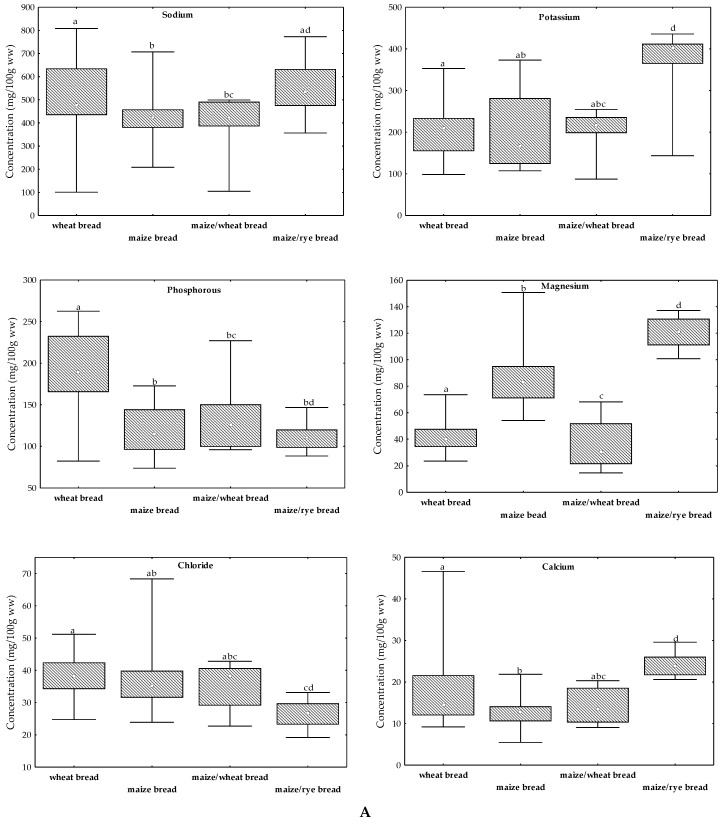
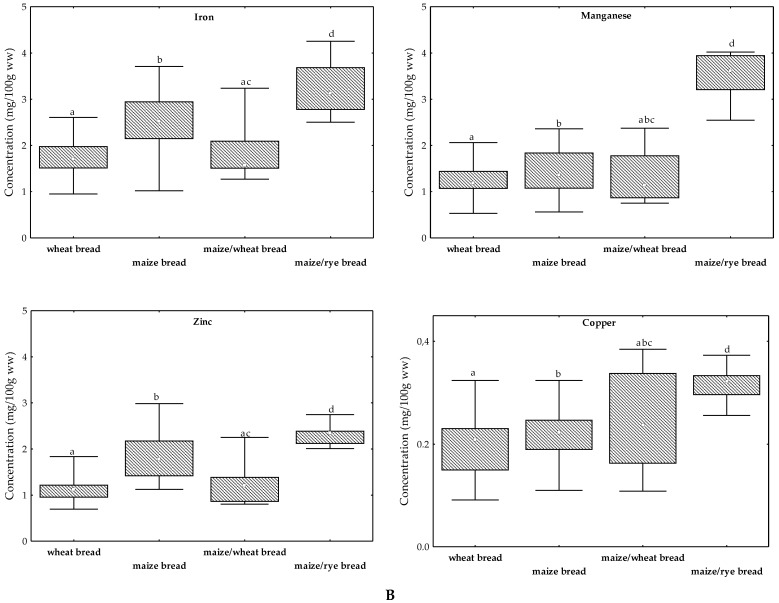
Figure 1.
Concentrations (□ Median,  25–75% and
  range, mg/100 g ww) of (A) macroelements and (B) microelements in breads. Each letter (a−d) corresponds to a type of bread (a, wheat bread; b, maize bread; c, maize/wheat bread; d, maize/rye bread). The same letter in a box plot indicates that the given medians are not statistically different (p > 0.05).


