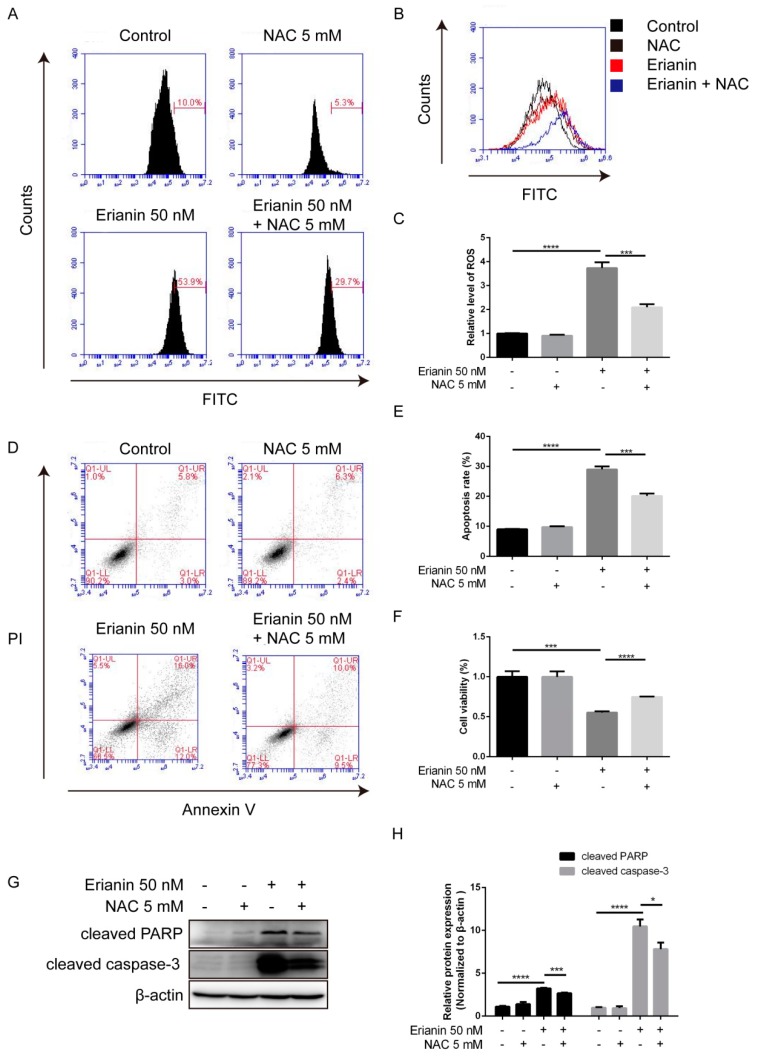
Figure 6.
ROS-mediated erianin-induced apoptosis and anti-proliferation in HaCaT cells. Cells were pretreated with 5 mM of NAC for 2 h and then incubated with 50 nM of erianin for 24 h. (A) Fluorescence intensity was analyzed by flow cytometry. (B) Representative images of ROS production. (C) The mean fluorescence intensity was normalized to the untreated group. (D) Cellular apoptosis was assayed by Annexin V/PI staining and detected by flow cytometry. (E) This histogram shows the statistical apoptosis rate in (D). Apoptosis rate = Q1-LR + Q1-UR. (F) Cell viability was detected by the MTT assay. (G) Western blotting for cleaved PARP and cleaved caspase-3. (H) The relative expression intensity of each protein was normalized to the internal control β-actin. The values are expressed as mean ± SD (n = 3). * p < 0.05, ** p < 0.01, *** p < 0.005, **** p < 0.001, significantly different compared with the untreated group and the NAC-treated group.

