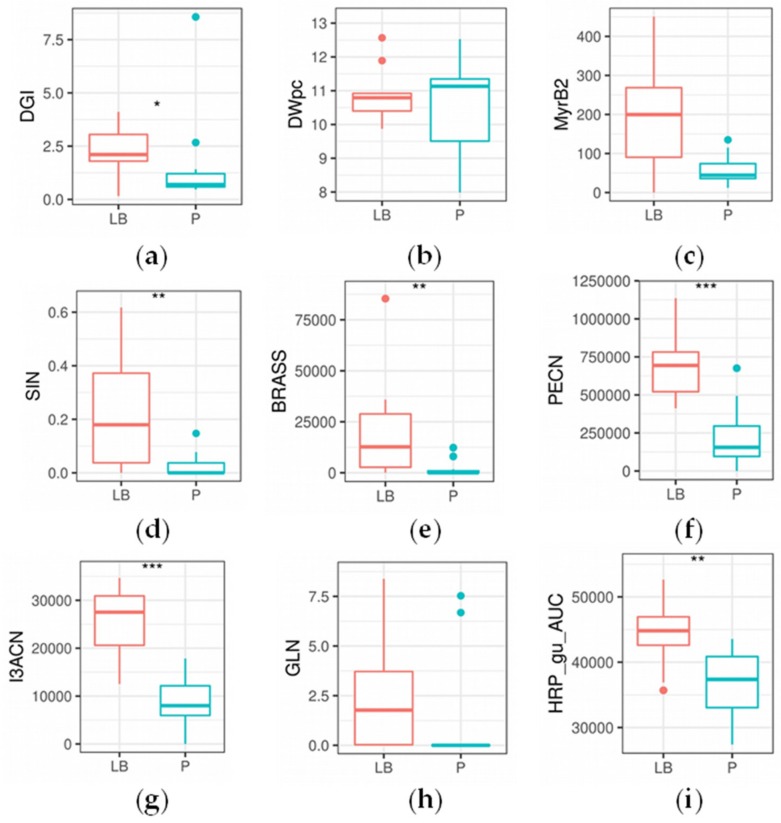
Figure 4.
Boxplots showing statistical differences in glucosinolate and breakdown product concentration, enzymatic activity and general parameters between the horseradish hairy root culture lines of petiole (P) and leaf blade (LB) origin (n = 11 and n = 10, respectively). Significant changes are marked as follows: * p < 0.05; ** p < 0.01; *** p < 0.001; Kruskal–Wallis test. Subplots (a) daily growth index; (b) dry weight (%); (c) Myrosinase, activity of the second band as measured by on-gel analysis; (d) sinigrin content (µg mg−1); (e) glucobrassicin content (abundance); (f) 3-phenylpropionitrile content (abundance); (g) indole-3-acetonitrile content (abundance); (h) gluconasturtiin content (µg mg−1); (i) horseradish peroxidase content activity, as measured on-gel analysis with guaiacol as substrate.

