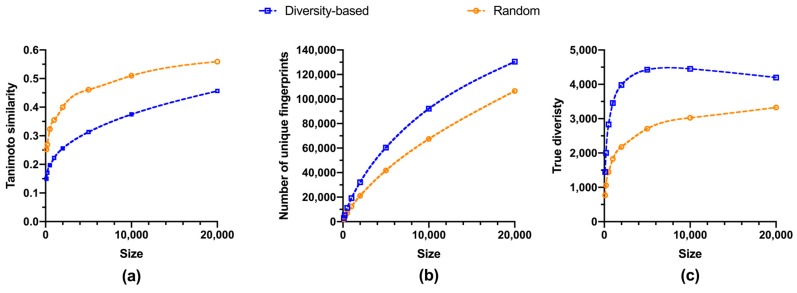
Figure 3.
Structural diversity vs size of fluorinated fragment libraries, with the former measured by: (a) Average of the similarity of each compound to its closest neighbor; (b) total number of unique fingerprints (richness); (c) true diversity calculated by equation 1. Dash curves are generated from cubic spline fitting. Metrics for random selections are average values of triplicates (Table S2).

