

Abstract
The nervous system transmits signals between neurons via neurotransmitter release during synaptic vesicle fusion. In order to observe neurotransmitter uptake and release from individual presynaptic terminals directly, we designed fluorescent false neurotransmitters as substrates for the synaptic vesicle monoamine transporter. Using these probes to image dopamine release in the striatum, we made several observations pertinent to synaptic plasticity. We found that the fraction of synaptic vesicles releasing neurotransmitter per stimulus was dependent on the stimulus frequency. A kinetically distinct “reserve” synaptic vesicle population was not observed under these experimental conditions. A frequency-dependent heterogeneity of presynaptic terminals was revealed that was dependent in part on D2 dopamine receptors, indicating a mechanism for frequency-dependent coding of presynaptic selection.
Decision making, memory, and learning require activation and modification of particular synapses. Synaptic transmission in turn requires neurotransmitter accumulation into synaptic vesicles followed by neurotransmitter release during synaptic vesicle fusion with the plasma membrane. Optical methods have been developed to observe synaptic vesicle membrane fusion (1–4), but there has been no means for observing neurotransmitter release from individual synapses in the brain.
We designed optical tracers of monoamine neurotransmitters, or fluorescent false neurotransmitters (FFNs), inspired by classic reports that tyramine, amphetamine, and other phenylethyl-amines can be taken up into secretory vesicles and discharged during exocytosis (5). We designed FFNs by targeting neuronal vesicular mono-amine transporter 2 (VMAT2), which carries monoamine neurotransmitters from the cytoplasm into synaptic vesicles (6). VMAT2 is relatively nonspecific and transports cellular monoamines (such as dopamine, serotonin, and norepinephrine) as well as synthetic amines (such as amphetamine, 3,4-methylenedioxymethamphetamine, and 1-methyl-4-phenylpyridinium) (7, 8). We pre-dicted that bulkier fluorescent monoamines might also be substrates (9) and developed compound FFN511 [Fig. 1A and fig. S1; design criteria are in the supporting online material (SOM)] (10). FFN511 inhibited serotonin binding to VMAT2-containing membranes, providing an apparent half maximal inhibitory concentration IC50 of 1 μM, a value close to dopamine itself (7).
Fig. 1.
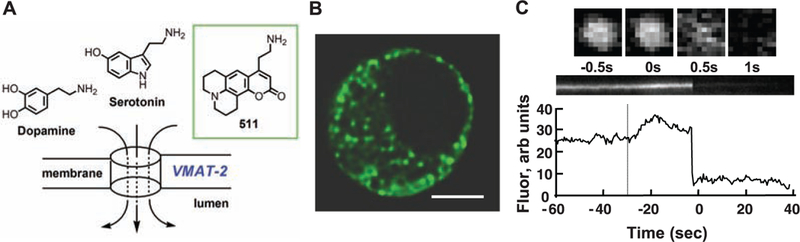
In mouse chromaffin cells, FFN511 is accumulated in LDCVs and is released by exocytosis. (A) Chemical structure of FFN511. (B) Multiphoton image of a chromaffin cell reveals a distribution of FFN511 that is consistent with LDCVs. Scale bar, 5 μm. (C) FFN511 exocytosis from a LDCV observed with TIRFM images acquired at 500 ms intervals. The upper row shows consecutive images of a single vesicle. Orthogonal section through this vesicle and its integrated intensity are in the middle and lower panels. The dotted line indicates stimulation by high potassium; the delay after stimulation is typically observed in this preparation (movie S1).
In adrenal chromaffin cells, catecholamines are stored in large dense core vesicles (LDCVs) that possess the vesicular monoamine transporter 1 (VMAT1). FFN511 accumulated in a pattern consistent with LDCVs in cultured mouse chromaffin cells (Fig. 1B), and the accumulation was abolished by the lipophilic base chloroquine, which collapses the vesicle pH gradient (fig. S2) (11). Exposure to 350 nM FFN511 (30 min) had no effect on the quantal size of evoked catecholamine release (fig. S3), and total internal reflection fluorescence microscopy (TIRFM) showed that FFN511 undergoes stimulation-dependent exocytosis from LDCVs (Fig. 1C, fig. S4, and movie S1) (12).
We then examined FFN511 accumulation and release in mouse brain using multiphoton microscopy. FFN511 incubation of acutely prepared slices from the striatum resulted in fluorescent puncta that correlated well with the size of axon terminals (~1 μm) (Fig. 2). No label was observed in striatal cell bodies [chiefly medium spiny neurons (MSNs)], indicating that accumulation into lysosomes or other acidic organelles was below detection limits. As expected, no labeling was observed in the corpus callosum (CC), which lacks monoamine terminals, and sparser distribution was observed in the cortex (Fig. 2, A and G) and hippocampus than in the striatum.
Fig. 2.
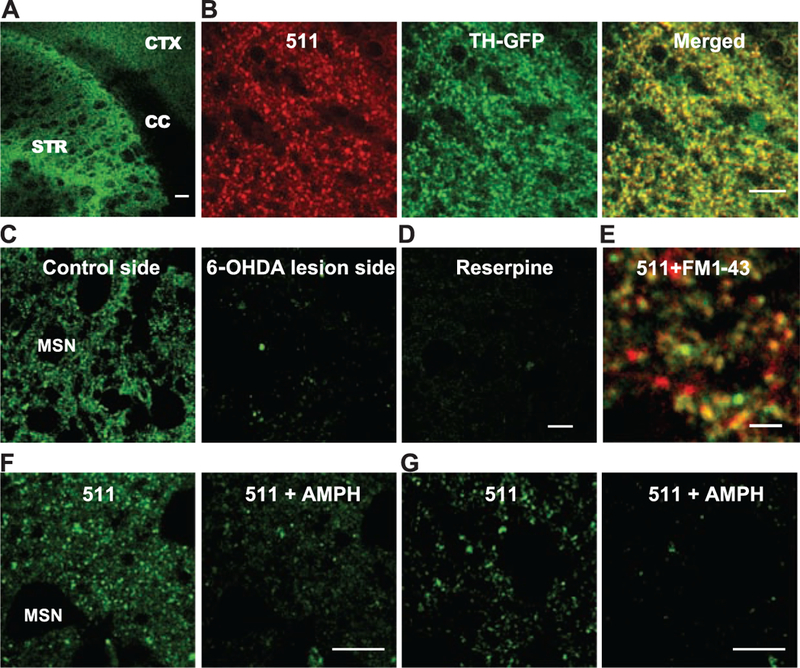
FFN511 labels dopamine terminals in live cortical-striatal acute slices. (A) Labeling by FFN511 in acute live cortical-striatal slice: abundant labeling in the striatum (STR), sparser labeling in cortex (CTX), and no label in corpus callosum (CC). Scale bar, 100 μm. (B) Overall pattern of FFN511 (red) and TH-GFP (green) fluorescent markers shows extensive overlap (yellow) as expected for dopamine terminals. The GFP-label (green) is cytosolic and thus fills both terminals and axons, whereas FFN511 labels terminals and is more punctate. Scale bar, 10 μm. (C) Nearly complete inhibition of striatal FFN511 labeling 21 days after unilateral 6-OHDA lesion. Striatal slices were examined by means of cyclic voltammetry to ensure the complete loss of dopamine release in the lesion side. (D) FFN511 labeling was strongly inhibited by reserpine (20 μM). Scale bar for C and D, 10 μm. (E) Colocalization of FM1–43–(red) and FFN511-labeled (green) terminals. Slices were sequentially loaded with 10 μM FM1–43 and 5 μM FFN511. A representative image from four independent experiments depicts extensive colocalization of FFN511- and FM1–43–labeled terminals. Scale bar, 4 μm. (F and G) Destaining of FFN511 from the striatum (F) and mPFC (G) by amphetamine. (Left) Before amphetamine; (Right) after 20 min of 20 μM amphetamine. Scale bar, 10 μm.
Extensive experimental evidence was accumulated in order to confirm that FFN511 labels dopamine presynaptic terminals in striatum, including (i) the overlap of FFN511 signal with that of green fluorescent protein (GFP) by using striatal slices prepared from transgenic mice expressing GFP under the control of the tyrosine hydroxylase (TH) promoter (Fig. 2B) (13); (ii) exclusion of FFN511 from γ-aminobutyric acid (GABA)–releasing striatopallidal MSNs by use of bacterial artificial chromosome (BAC)–transgenic mice that express enhanced green fluorescent protein (EGFP) under the control of the promoter of dopamine D2 receptor (D2R) (fig. S5 and movie S2); (iii) loss of FFN511 labeling by lesioning dopamine neurons by in vivo injection of the selective dopaminergic neurotoxin 6-hydroxydopamine (6-OHDA) into the striatum of one hemisphere (Fig. 2C) (14); (iv) inhibition of FFN511 labeling by the VMAT2 inhibitors reserpine (Fig. 2D) and Ro 4–1284 (fig. S6); and (v) an extensive overlap of FFN511 with the endocytic synaptic vesicle marker FM1–43 (Fig. 2E and fig. S7). Further-more, amphetamine (20 μM for 20 min), which redistributes vesicular dopamine to the cytosol and induces dopamine release without synaptic vesicle fusion (15), caused a substantial loss of fluorescence in striatum (Fig. 2F) and the medial prefrontal cortex (mPFC) (Fig. 2G).
Levels of FFN511 sufficient to label terminals in the striatum (10 μM for 30 min) did not significantly alter evoked dopamine release as measured with cyclic voltammetry (a reduction of 7.5 ± 4%, mean ± SEM, n = 4 slices, P > 0.5). FFN511 cannot be oxidized during electrochemical detection, and higher concentrations of FFN511 (40 μM) decreased the evoked dopamine release by 35.4 ± 1.4% (n = 3 slices), presumably by displacing vesicular dopamine. The probe thus acts as an optical tracer of dopamine, and is sufficiently fluorescent so as to provide resolution of individual dopamine terminals at concentrations that do not interfere with normal catecholamine accumulation and transmission.
We examined activity-dependent release of FFN511 from dopamine synaptic terminals using a “pulse-chase” protocol in which an acute striatal brain slice was labeled with FFN511 (10 μM for 30 min) and then stimulated with current applied by a bipolar electrode (Fig. 3A and movie S3) or high potassium (fig. S8). Bipolar stimulation at 1, 4, and 20 Hz each evoked exponential destaining (Fig. 3B) with a mean half-time (t1/2) of destaining of 330, 257, and 114 s, respectively, whereas negligible destaining occurred in the absence of stimulation or when stimuli were applied, but calcium channels were blocked by 200 μM cadmium (Fig. 3B). For each stimulus frequency and at all times during the protracted stimuli, the destaining was well described by a single exponential. Thus, under these experimental conditions, neurotransmitter accumulation-competent presynaptic terminals do not display a population of kinetically distinct “reserve” synaptic vesicles.
Fig. 3.
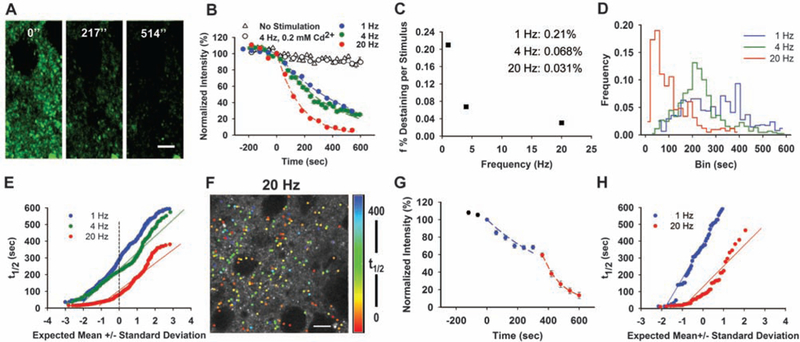
Frequency-dependent induction of multiple dopamine terminal populations. (A) Local stimulation at 4 Hz resulted in destaining from the terminals. Stimulation began at t = 0. Scale bar: 5 μm. (B) Destaining of FFN511 at4 Hz is Ca2+- and frequency-dependent. Controls received no stimulation (153 puncta from 3 slices). Destaining with cadmium chloride (200 μM) was identical to unstimulated controls (475 puncta from 5 slices). The destaining curves for each stimulation frequency were fit by a single exponential decay function and half-life (t1/2) values calculated as τ × 0.693 (1 Hz, 765 puncta from 9 slices; 4 Hz, 410 puncta from 7 slices; 20 Hz, 416 puncta from 6 slices). (C) The dependence of mean fractional release parameter (f, i.e., destaining per stimulus) on stimulus frequency. (D) Histogram of t1/2 values of individual dopamine terminals stimulated at 1 Hz, 4 Hz, and 20 Hz. Bin size, 20 s. (E) Normal probability plot of half-time values for each terminal at 1, 4, and 20 Hz. The deviation from normality was increased with stimulation frequency. (F) Spatial distribution of FFN511 destaining rates of individual puncta stimulated at 20 Hz are shown in false color. Scale bar, 10 μm. (G) Averaged destaining kinetics of 60 puncta from one region of a slice stimulated consecutively first at 1 Hz (blue) and then at 20 Hz (red). (H) Distribution of t1/2 values for the terminals in G; distribution at 1 Hz was well fit by a normal distribution, whereas the distribution deviated from normality at 20 Hz (movie S3).
This approach provides a means to address the long-standing question of the fractional neurotransmitter released from terminals during stimulation-dependent exocytosis. The data suggest that 0.03 to 0.21% of dopamine synaptic vesicles fused per stimulus, depending on the stimulation frequency (Fig. 3C). The apparent low probability of release is consistent with cyclic voltammetry recordings that indicate that stimulation-dependent release of dopamine represents a very small fraction of that released with amphetamine (16). There was a depression at more rapid stimulation, with twofold less destaining per pulse at 4 Hz and sixfold less destaining per pulse at 20 Hz than at 1 Hz (Fig. 3C). If dopamine terminals are mostly releasing neurotransmitter by full fusion of the synaptic vesicle (17), these measurements indicate the fraction of transmitter accumulation–competent synaptic vesicles fused per stimulus and revealed a stimulation-dependent form of presynaptic plasticity. The level of fractional destaining was enhanced with higher extracellular calcium (table S1), suggesting that frequency-dependent effects may be related to an activity-dependent decrease of calcium entry per stimulus, although other possibilities such as altered fusion mechanisms, depletion of a readily releasable pool, or decreased signal propagation through axons cannot be ruled out.
We next analyzed the heterogeneity within large ensembles of dopamine terminals in the striatum. The distribution of individual terminal activities showed a rightward skew at all stimulus frequencies when individual terminal half-times were displayed as histograms [P < 0.005, different from normal distribution by Kolmogorov-Smirnov (KS) test for all three frequencies] (Fig. 3D). In normal probability plots, in which normally distributed data are linear, multimodal distributions can be seen that deviate further from normality with increased stimulus frequency (1 Hz, D = 0.0628; 4 Hz, D = 0.1160; 20 Hz, D = 0.1321; D statistics were obtained with the KS test and indicate the deviation from normality) (Fig. 3E). All distributions were different from normal distribution and from each other (P < 0.005, KS test). The highly skewed distribution at 20 Hz indicates multiple populations of presynaptic terminals, including the most active population in which the probability of terminal content release per stimulus (Pterminal) is ~0.2% and the slowest population, with Pterminal ~ 0.005%. The spatial distribution of presynaptic activity appeared to be complex, with very active and inactive terminals often nearby (Fig. 3F). There was no relationship between initial fluorescent intensity and terminal destaining rates (fig. S9), suggesting that the heterogeneity in terminal activity was unrelated to the number of functional synaptic vesicles. To examine whether terminal heterogeneity may be due to variation in the depolarization of the terminals, we stimulated the same slice preparation at two frequencies and measured FFN511 destaining, first at 1 Hz and then at 20 Hz (Fig. 3, G and H). The distribution of half-time values obtained from the same set of presynaptic terminals is well fit by a normal distribution at 1 Hz (D = 0.062, P >0.1, KS test) (Fig. 3, G and H, blue) and is in an apparent multiple population distribution at 20 Hz that is not fit by a normal distribution (D = 0.194, P < 0.0001, KS test) (Fig. 3, G and H, red). This confirms that presynaptic terminal heterogeneity is stimulation frequency–dependent, although we cannot exclude the possibility that this is due to differences in axonal action potential propagation. Differential activity of individual glutamate presynaptic terminals has been observed by using either postsynaptic electrophysiological measurements (18,19) or optical imaging, indicating membrane fusion (4); FFN511 reveals heterogeneity of dopamine release from individual terminals in the striatum and shows that this is a dynamic phenomenon dependent on stimulation frequency.
Cyclic voltammetry recordings in the striatum indicate that dopamine D2R activation inhibits the evoked release of dopamine in a frequency-dependent manner (20), and we thus examined how the frequency-dependent dopamine terminal heterogeneity was affected by the D2R antagonist sulpiride (10 μM for 20 min) (Fig. 4). There was no significant change in the mean values of terminal kinetics at 1 and 4 Hz, although sulpiride accelerated release in the slow population of terminals more than one SD slower than the expected mean (Fig. 4, A and B). At 20 Hz, however, sulpiride increased the mean t1/2 by more than 50% (mean t1/2 = 106.2 ± 4.0 s for control versus 161.0 ± 4.7 s for sulpiride), slowing the destaining kinetics of >65% of the terminals (Fig. 4C). The distributions of the destaining kinetics were closer to normal in the presence of sulpiride (D = 0.0445 at 1 Hz with sulpiride versus D = 0.0628 with 1 Hz control; D = 0.0729 at 4 Hz with sulpiride versus D = 0.1160 with 4 Hz control; D = 0.1033 at 20 Hz with sulpiride versus D = 0.1321 with 20 Hz control by KS normality test). Except for 1 Hz with sulpiride, all distributions deviated from normality (P < 0.005) and from the corresponding controls (P < 0.001), confirming that the emergence of multiple populations was dependent in large part on D2R activation. Consistently, cyclic voltammetry recordings confirm that sulpiride enhanced dopamine release by the second stimulus pulse at 20 Hz (2 single pulses with an interval of 0.05 s) (fig. S10A), and enhanced dopamine release by 2 pulses at 20 Hz but did not enhance dopamine release by 30 pulses at 20 Hz (fig. S10B). The phenomenon of frequency and pulse-dependent reversal of receptor inhibition of dopamine overflow has been identified using nicotinic antagonists (21, 22). Thus the activity-dependent terminal heterogeneity is associated with receptor-mediated responses, and indicates the presence of frequency-dependent coding (23) that may determine how particular synapses are activated during decision-making, habit formation, and learning.
Fig. 4.
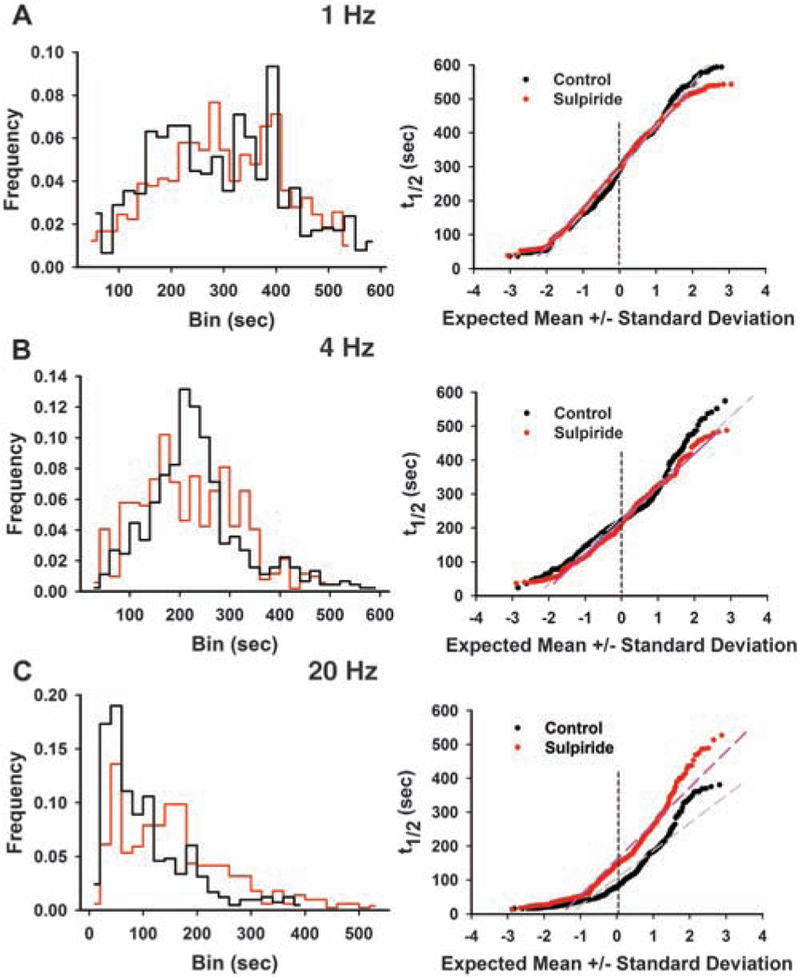
Effect of dopamine D2R antagonist sulpiride on presynaptic terminal populations is frequency-dependent. (A) Effect of sulpiride on dopamine terminals stimulated at 1 Hz (765 puncta from 9 slices for the control and 901 puncta from 8 slices for sulpiride). Normal probability plot reveals that sulpiride accelerated transmitter release from the slowest terminals. (B) Effect of sulpiride on dopamine terminals stimulated at 4 Hz (519 puncta from 10 slices for the control, and 520 puncta from 5 slices for sulpiride). The effect of sulpiride was similar to that at 1 Hz stimulation. (C) Effect of sulpiride on dopamine terminals stimulated at 20 Hz (416 puncta from 6 slices for the control and 508 puncta from 4 slices for sulpiride). Sulpiride inhibited release from >65% of the terminals, except for the most active population. At each stimulation frequency, sulpiride shifted the entire population of the t1/2 values closer to a normal distribution.
Spatial heterogeneity of dopamine release has been demonstrated by means of electrochemical recordings with a resolution of ~100 μm (24) and has been suggested to play an important role in the modulation of synaptic circuitry involved in motivation, reward, and learning. Here we find that the activity of individual dopaminergic presynaptic terminals is modulated by neuronal activity and receptor activation. FFNs enable optical measurements of key presynaptic processes in the central nervous system, including accumulation of a vesicle transporter substrate and release by evoked activity or drugs such as amphetamine, at unprecedented spatial resolution. FFN511 is compatible with GFP-based tags, the FM1–43 endocytic marker, and other optical probes, which will allow the construction of fine-resolution maps of synaptic micro-circuitry and presynaptic activity, particularly in regions such as the hippocampus and cortex where monoamine innervation can be too sparse for electrochemical recording.
Supplementary Material
Footnotes
Supporting Online Material
References and Notes
- 1.Betz WJ, Bewick GS, Science 255, 200 (1992). [DOI] [PubMed] [Google Scholar]
- 2.Miesenbock G, De Angelis DA, Rothman JE, Nature 394, 192 (1998). [DOI] [PubMed] [Google Scholar]
- 3.Zhang Q, Li Y, Tsien RW, Science 323, 1448 (2009). [DOI] [PMC free article] [PubMed] [Google Scholar]
- 4.Murthy VN, Sejnowski TJ, Stevens CF, Neuron 18, 599 (1997). [DOI] [PubMed] [Google Scholar]
- 5.Kopin IJ, Annu. Rev. Pharmacol. 8, 377 (1968). [DOI] [PubMed] [Google Scholar]
- 6.Merickel A, Rosandich P, Peter D, Edwards RH, J. Biol. Chem. 270, 25798 (1995). [DOI] [PubMed] [Google Scholar]
- 7.Partilla JS et al. , J. Pharmacol. Exp. Ther. 319, 237 (2006). [DOI] [PubMed] [Google Scholar]
- 8.Liu Y et al. , Cell 70, 539 (1992). [DOI] [PubMed] [Google Scholar]
- 9.Chen G, Yee DJ, Gubernator NG, Sames D, J. Am. Chem. Soc. 127, 4544 (2005). [DOI] [PubMed] [Google Scholar]
- 10. Materials and methods are available as supporting material on Science Online.
- 11.Sulzer D, Rayport S, Neuron 5, 797 (1990). [DOI] [PubMed] [Google Scholar]
- 12.Steyer JA, Horstmann H, Almers W, Nature 388, 474 (1997). [DOI] [PubMed] [Google Scholar]
- 13.Sawamoto K et al. , Proc. Natl. Acad. Sci. U.S.A. 98, 6423 (2001). [DOI] [PMC free article] [PubMed] [Google Scholar]
- 14.Oo TF, Siman R, Burke RE, Exp. Neurol. 175, 1 (2002). [DOI] [PubMed] [Google Scholar]
- 15.Sulzer D, Sonders MS, Poulsen NW, Galli A, Prog. Neurobiol. 75, 406 (2005). [DOI] [PubMed] [Google Scholar]
- 16.Schmitz Y, Lee CJ, Schmauss C, Gonon F, Sulzer D, Neurosci J. 21, 5916 (2001). [DOI] [PMC free article] [PubMed] [Google Scholar]
- 17.Staal RG, Mosharov EV, Sulzer D, Nat. Neurosci. 7, 341 (2004). [DOI] [PubMed] [Google Scholar]
- 18.Hessler NA, Shirke AM, Malinow R, Nature 366, 569 (1993). [DOI] [PubMed] [Google Scholar]
- 19.Rosenmund C, Clements JD, Westbrook GL, Science 262, 754 (1993). [DOI] [PubMed] [Google Scholar]
- 20.Schmitz Y, Schmauss C, Sulzer D, Neurosci J. 15, 8002 (2002). [DOI] [PMC free article] [PubMed] [Google Scholar]
- 21.Rice ME, Cragg SJ, Nat. Neurosci. 7, 583 (2004). [DOI] [PubMed] [Google Scholar]
- 22.Zhang H, Sulzer D, Nat. Neurosci. 7, 581 (2004). [DOI] [PubMed] [Google Scholar]
- 23.Bamford NS et al. , Neuron 42, 653 (2004). [DOI] [PubMed] [Google Scholar]
- 24.Wightman RM et al. , Eur. J. Neurosci. 26, 2046 (2007). [DOI] [PubMed] [Google Scholar]
- 25. We thank R. Burke for 6-OHDA injections and advice, M. Sonders for discussion, M. Siu for imaging analysis programming, and J. Schmoranzer for technical support with the TIRFM setup. Columbia University has applied for a patent on fluorescent false neurotransmitters. D. Sames thanks The G. Harold and Leila Y. Mathers Charitable Foundation and Columbia University’s Research Initiatives in Science and Engineering. D. Sulzer thanks the National Institute on Drug Abuse (NIDA), the National Institute of Mental Health (NIMH), and the Picower and Parkinson’s Disease Foundations. H.Z. thanks the National Alliance for Research on Schizophrenia and Depression. R.H.E. thanks the Michael J. Fox Foundation, the National Parkinson Foundation, NIDA, and NIMH.
Associated Data
This section collects any data citations, data availability statements, or supplementary materials included in this article.