

Abstract
Background and Aims:
Nonalcoholic steatohepatitis (NASH) is a leading cause of liver transplantation and many trials are underway to evaluate potential therapies. The farnesoid X receptor ligand obeticholic acid in NASH treatment trial evaluated the effects of obeticholic acid vs placebo on histologic response (defined as decrease in nonalcoholic fatty liver disease activity score [NAS] by ≥2, with no worsening of fibrosis); 45% of patients had a histologic response to obeticholic acid (25 mg) and 21% had a response to placebo (P<.01). We performed a secondary analysis of data from this trial to identify clinical parameters associated with a histologic response.
Methods:
We used a logistic regression model with a stepwise selection procedure to identify baseline and early on-treatment factors associated with a histologic response at 72 weeks. Baseline demographics, liver histology, medical history, concomitant medications, cardiometabolic parameters, and serum biochemistry as well as the changes over the course of the trial (at weeks 12 and 24) were evaluated as potential predictors of a histologic response. The model was cross-validated by a jackknife method and performance was evaluated with the area under the receiver operating characteristic curve (AUROC).
Results:
The logistic regression model found obeticholic acid treatment, baseline NAS>5, baseline triglycerides≤154 mg/dL, baseline international normalized ratio≤1, baseline aspartate aminotransferase≤49 U/L, and a decrease in alanine aminotransferase at week 24 by 17 U/L or more, to be significantly associated with histologic response (AUROC, 0.83; 95% CI, 0.77–0.89; P<.0001).
Conclusions:
In a secondary analysis of data from a clinical trial of obeticholic acid in patients with NASH, we identified routine clinical and laboratory paramenters during the first 24 weeks of treatment (such as baseline NAS, triglyceride levels, and a decrease in alanine aminotransferase) to significantly associate with histologic markers of response.
Keywords: FLINT Trial, OCA, FXR agonist, NAFLD
INTRODUCTION
Non-alcoholic steatohepatitis (NASH) is a progressive liver disease that can lead to cirrhosis, hepatic decompensation, hepatocellular carcinoma, or death1–4. It is among the top three indications for liver transplantation and is likely to become the leading indication for liver transplant in the coming decades.5 There are several investigational products that are currently being evaluated for NASH that have demonstrated some preliminary histologic or radiographic benefit.6 Pharmacological agents such as vitamin E, pioglitazone, and pentoxifylline use are associated with improvement in liver histology in patients with NASH. However, no therapies have been approved for the management of NASH7.
Obeticholic acid (OCA), a potent and selective farnesoid X receptor (FXR) agonist, has shown promise in the treatment of non-alcoholic fatty liver disease (NAFLD), NASH, and NASH-related fibrosis8,9. Preclinical studies have demonstrated that treatment with OCA can improve liver fibrosis and treat cirrhosis10. Recently, the Farnesoid X Receptor Ligand Obeticholic Acid in NASH Treatment (FLINT) trial demonstrated that ≥2 point improvement in the NAFLD activity score (NAS) without worsening of fibrosis occurred in 45% of OCA-treated patients compared to 21% of Placebo-treated patients (p=0.0002)8.
The rising prevalence of NAFLD and NASH has led to widespread interest in identifying clinical and biochemical predictors of NASH and response to treatment11–13. Early identification of advanced fibrosis in NAFLD and predictors of NASH are critical for identifying treatment candidates and improving outcomes. Utilizing data from the FLINT trial, the objective of this analysis was to identify clinical predictors of histologic response and to utilize the identified predictors in a multivariable-adjusted model which could predict histologic response (as defined by the FLINT primary endpoint) in patients with NASH.
METHODS
Study Overview
The FLINT trial was a 72-week, multicenter, randomized, placebo-controlled study conducted by the NASH Clinical Research Network (CRN) at 8 clinical sites that assessed the safety and efficacy of once daily OCA 25 mg compared to Placebo in noncirrhotic patients with biopsy evidence of NASH (N=283)8. All patients enrolled in the study were over age 18 years, with NAS ≥4 (with a score of ≥1 in steatosis [range 0–3], lobular inflammation [range 0–3], and hepatocellular ballooning [range 0–2]), and had a liver biopsy within 90 days of study initiation demonstrating histological evidence of NASH. Grading and staging of baseline and end of study biopsies were performed by the pathology committee of the NASH CRN using NASH CRN histologic scoring system14. Exclusion criteria included evidence of cirrhosis, other causes of liver disease, and substantial alcohol consumption as defined by the American Association for the Study of the Liver (AASLD) guidelines7. Patients were randomly assigned to OCA 25 mg or Placebo with randomization stratified by clinical center and diabetes status. Patients, investigators, clinical staff, and pathologists were masked to treatment assignment. A planned interim analysis established that the primary endpoint was met and, at the recommendation of the data safety monitoring board, final biopsies were not obtained in 39 patients receiving OCA and 44 patients receiving Placebo. These patients were not included in this analysis8.
Statistical Methods
A total of 283 patients were randomized and dosed in FLINT (OCA 25 mg, n=141; Placebo, n=142); 200 patients had a liver biopsy at both baseline and Week 72 (OCA 25 mg, n=102; Placebo, n=98), and were included in this analysis8. Fifty of 102 (49%) OCA-treated patients achieved histologic response and 23 of 98 (23%) Placebo-treated patients achieved histologic response8. A multivariable logistic regression model with stepwise selection procedure was performed to identify potential predictors of histological response at Week 72. Model selection was based on Akaike information criterion (AIC) and Bayesian information criterion (BIC)15,16. AIC and BIC assessed the model’s goodness of fit and applied a penalty based on the number of selected predictors. Baseline values for demographics, medical history/co-morbidity, vitamin E use, metabolic factors, histology, liver and serum biochemistry, and changes in those parameters over the course of the trial at 12 and 24 weeks were evaluated as potential clinical parameters predicting histologic response and are listed in Supplemental Table 1. These parameters were used to build a model for predicting histologic response. The area under the receiver operating characteristic curve (AUROC), sensitivity, specificity, positive predictive value (PPV), negative predictive value (NPV), and percent of correctly classified cases were calculated to evaluate the effectiveness of the prediction. A scheme of model development is shown in Supplemental Figure 1. Model development and statistical analysis was performed on SAS 9.4 (SAS Institute Inc., North Carolina).
In the stepwise selection model, a significance level of 0.1 was defined to allow a variable into the model, and a significance level of 0.15 was defined for a variable to stay in the model as other parameters were introduced. Significance of parameters within the model was assessed by Wald Chi-square test. Baseline and on-treatment parameters that had numeric values were dichotomized by the median values of the overall population (n=200) shown in Table 1 and Supplemental Table 2. Non-numerical categorical parameters were assessed as yes or no for specific criteria and are shown in Table 1 and Supplemental Table 2. To maximize the inclusion of patients used in model construction, as some patients had missing values for some parameters, predictors were divided into three categories. Stepwise selection was then performed in each of the following categories:
Table 1. Baseline Characteristics.
| Histologic Responders (n=73) |
Histologic Non-Responders (n=127) |
Overall (n=200) |
|
|---|---|---|---|
| Age (years) | 53.0 (47.0, 60.0) | 53.0 (41.0, 59.0) | 53.0 (42.5, 59.5) |
| BMI (kg/m2) | 33.3 (30.1, 37.2) | 33.7 (30.3, 38.7) | 33.6 (30.2, 37.9) |
| AST (U/L) | 51.0 (37.0, 85.0) | 48.0 (35.0, 70.0) | 49.0 (35.0, 71.5) |
| ALT (U/L) | 72.0 (54.0, 115.0) | 62.0 (42.0, 105.0) | 67.5 (48.0, 106.5) |
| ALP (U/L) | 74.0 (62.0, 100.0) | 77.0 (61.0, 93.0) | 75.5 (61.5, 96.5) |
| GGT (U/L) | 41.0 (33.0, 73.0) | 53.0 (33.0, 91.0) | 46.0 (33.0, 88.0) |
| Total Bilirubin (mg/dL) | 0.6 (0.4, 0.8) | 0.6 (0.4, 0.8) | 0.6 (0.4, 0.8) |
| HDL-C (mg/dL) | 42.0 (34.0, 47.5) | 41.0 (36.0, 50.0) | 42.0 (35.0, 50.0) |
| LDL-C (mg/dL) | 106.0 (83.0, 130.0) | 114.0 (83.0, 143.0) | 111.5 (83.0, 139.0) |
| Triglycerides (mg/dL) | 138.0 (112.0, 194.0) | 162.0 (114.0, 210.0) | 154.0 (113.0, 206.0) |
| Cholesterol (mg/dL) | 183.0 (157.0, 209.0) | 188.0 (159.0, 230.0) | 186.5 (158.5, 222.0) |
| Creatinine (mg/dL) | 0.8 (0.7, 0.9) | 0.8 (0.7, 0.9) | 0.8 (0.7, 0.9) |
| Uric Acid (mg/dL) | 6.3 (5.4, 7.0) | 6.1 (5.2, 7.2) | 6.2 (5.3, 7.1) |
| Platelets (109/L) | 241.0 (204.0, 268.0) | 238.0 (203.0, 287.0) | 238.5 (203.0, 278.0) |
| INR | 1.0 (1.0, 1.0) | 1.0 (1.0, 1.1) | 1.0 (1.0, 1.0) |
| SBP (mmHg) | 131.0 (122.0, 146.0) | 132.0 (122.0, 144.0) | 132.0 (122.0, 145.0) |
| NAS | 6.0 (5.0, 7.0) | 5.0 (4.0, 6.0) | 5.0 (4.0, 6.0) |
| Ballooning | 2.0 (1.0, 2.0) | 1.0 (1.0, 2.0) | 2.0 (1.0, 2.0) |
| Inflammation | 2.0 (2.0, 3.0) | 2.0 (1.0, 2.0) | 2.0 (1.0, 2.0) |
| Steatosis | 2.0 (2.0, 3.0) | 2.0 (1.0, 3.0) | 2.0 (1.5, 3.0) |
| Fibrosis Stage | 2.0 (1.0, 3.0) | 2.0 (1.0, 3.0) | 2.0 (1.0, 3.0) |
Values shown are Median (Q1, Q3).
BMI: body mass index; AST: aspartate aminotransferase; ALT: alanine aminotransferase; ALP: alkaline phosphatase; GGT: gamma glutamyl transpeptidase; HDL-C high-density lipoprotein cholesterol; LDL-C: low-density lipoprotein cholesterol; INR: international normalized ratio; SBP: systolic blood pressure; NAS: nonalcoholic fatty liver disease activity score.
Baseline parameters: age, sex, alanine aminotransferase (ALT), aspartate aminotransferase (AST), gamma-glutamyl transpeptidase (GGT), alkaline phosphatase (ALP), total bilirubin, high-density lipoprotein cholesterol (HDL-C), low-density lipoprotein cholesterol (LDL-C), total cholesterol, triglycerides, platelet count, serum creatinine, uric acid, body mass index (BMI), systolic blood pressure (SBP), diabetes status, history of cardiovascular disease, history of hyperlipidemia, history of hypertension, vitamin E use, NAS, fibrosis stage, inflammation grade, steatosis grade, ballooning grade, international normalized ratio (INR), and treatment group. Within this category, baseline NAS, OCA treatment, baseline INR, Vitamin E use and baseline triglyceride levels were selected as potential predictors of histologic response.
Baseline and on-treatment changes in liver enzymes and chemistry: ALT, AST, GGT ALP, total bilirubin, platelets, serum creatinine, and uric acid. Within this category, baseline AST, ALT decrease at Week 24, AST decrease at Week 24, and platelet increase at Week 24 were selected as potential predictors of histologic response.
Baseline and on-treatment changes in cardiometabolic parameters: BMI; weight, SBP, HDL-C, LDL-C, triglycerides, and cholesterol. Baseline triglycerides, weight change at Week 24 and triglyceride change at Week 24, and SBP change at Week 12 were selected as potential predictors.
Stepwise selection was performed on the parameters selected from each category. OCA treatment, baseline NAS, baseline INR, baseline triglycerides, baseline AST, Vitamin E use and ALT change at Week 24 were selected as parameters predicting histologic response. However, vitamin E use was removed from the model as the significance level was greater than 0.05 and its removal resulted in an improved BIC value. Weight loss was not a parameter selected in stepwise selection, a previous analysis demonstrated that weight loss alone does not explain the effects of histologic improvement observed in this population.17
The final model was internally validated by jackknife method, which systematically removes one observation (patient) at a time and reassesses the entire model. Odds ratios and 95% (CI) were calculated for each of the selected predictors. Model performance was assessed by the AUROC and an optimal probability cut point was selected by maximizing the sensitivity and specificity of the curve.
In addition, univariate analysis was performed to assess all variables between histologic responders and non-responders. Significance in the univariate analysis was determined by comparing the number of patients above or below median values of the overall population between the patients who did or did not achieve the FLINT response criteria using a Fisher’s exact test.
RESULTS
Baseline characteristics of the overall FLINT trial population have been previously reported. Most baseline parameters were balanced between patients who did or did not achieve histologic improvement (Table 1). In general, patients who achieved histologic improvement had greater reductions in median liver biochemistry levels at Weeks 12 and 24 compared to patients who did not achieve histologic improvement as shown in Supplemental Table 2.
Univariate Analysis
All parameters assessed by stepwise selection were evaluated by univariate analysis which are shown in Table 2 and Supplemental Table 3; parameters selected by stepwise selection are highlighted in these tables. At baseline, of the parameters selected as predictors of histologic response, OCA treatment (p<0.01) and NAS (p<0.0001) were statistically significant between patients who did or did not achieve histologic response, while INR, triglycerides and AST were not. The frequency of several on-treatment parameters shown in Supplemental Table 3 were significant between groups, potentially driven by the treatment effects of OCA. ALT change at Week 24, which was selected as a predictor in the final model, was significantly different between both groups (p<0.0001). Table 3 shows the median (Q1, Q3) values of the selected parameters by randomized treatment group. All of the selected parameters show the same trends in values between histologic responders and non-responders regardless of randomized treatment group.
Table 2. Univariate Analysis of Frequency of Key Baseline Characteristics.
| n (%) | Histologic Responders (n=73) |
Histologic Non-Responders (n=127) |
P-values |
|---|---|---|---|
| OCA 25 mg | 50 (68.5%) | 52 (40.9%) | 0.0002 |
| Age (years) ≤53.0 | 37 (50.7%) | 68 (53.5%) | 0.7691 |
| Male | 23 (31.5%) | 44 (34.6%) | 0.7559 |
| BMI (kg/m2) ≤33.6 | 40 (54.8%) | 60 (47.2%) | 0.3782 |
| AST (U/L) ≤49.0 | 35 (47.9%) | 67 (52.8%) | 0.5581 |
| ALT (U/L) ≤67.5 | 33 (45.2%) | 67 (52.8%) | 0.3782 |
| ALP (U/L) ≤75.5 | 39 (53.4%) | 61 (48.0%) | 0.5570 |
| Platelets (109/L) ≤238.5 | 36 (49.3%) | 64 (50.4%) | 1.0000 |
| INR <1.0 | 62 (84.9%) | 94 (74.6%) | 0.1082 |
| Cholesterol (mg/dL) ≤186.5 | 38 (52.1%) | 62 (48.8%) | 0.7691 |
| Triglycerides (mg/dL) ≤154.0 | 43 (58.9%) | 58 (45.7%) | 0.0793 |
| Cardiovascular Disease | 3 (4.1%) | 8 (6.3%) | 0.7492 |
| Diabetes | 42 (57.5%) | 65 (51.2%) | 0.4618 |
| Hyperlipidemia | 43 (58.9%) | 82 (64.6%) | 0.4508 |
| Hypertension | 45 (61.6%) | 78 (61.4%) | 1.0000 |
| Vitamin E | 23 (31.5%) | 22 (17.3%) | 0.0571 |
| NAS ≤5.0 | 22 (30.1%) | 84 (66.1%) | <0.0001 |
| Inflammation ≤2.0 | 52 (71.2%) | 112 (88.2%) | 0.0039 |
| Ballooning 0–1 | 22 (30.1%) | 70 (55.1%) | 0.0007 |
| Steatosis ≤2.0 | 39 (53.4%) | 86 (67.7%) | 0.0497 |
| Fibrosis Stage ≤2.0 | 48 (65.8%) | 87 (68.5%) | 0.7544 |
P-values were determined by Fisher Exact Test. Parameter cut offs are based on the median value for the overall population (n=200). Baseline parameters selected by the model are highlighted gray (significant in multivariable analysis). The statistical comparison above evaluates whether there was a difference in the number of patients having below or equal the median value of the overall population for numerical values or “yes” for non-numerical values between responders and non-responders.
OCA: obeticholic acid. BMI: body mass index; AST: aspartate aminotransferase; ALT: alanine aminotransferase; ALP: alkaline phosphatase; INR: international normalized ratio; NAS: nonalcoholic fatty liver disease activity score.
Table 3. Values of Selected Model Parameters by Randomized Treatment Group.
| OCA 25 mg | Placebo | |||
|---|---|---|---|---|
| Histologic Responders n=50 |
Histologic Non-Responders n=52 |
Histologic Responders n=23 |
Histologic Non-Responders n=75 |
|
| Baseline NAS | 6.0 (5.0, 7.0) | 4.5 (4.0, 6.0) | 6.0 (5.0, 7.0) | 5.0 (4.0, 6.0) |
| Baseline Triglycerides (mg/dL) | 142.0 (116.0, 199.0) | 174.5 (149.5, 222.5) | 126.0 (96.0, 189.0) | 151.0 (109.0, 201.0) |
| Baseline INR | 1.0 (1.0, 1.0) | 1.0 (1.0, 1.1) | 1.0 (0.9, 1.0) | 1.0 (1.0, 1.0) |
| Baseline AST (U/L) | 54.0 (37.0, 93.0) | 49.0 (35.0, 74.0) | 49.0 (34.0, 80.0) | 46.0 (33.0, 69.0) |
| ALT change at Week 24 (U/L) | −37.5 (−70.0, −23.0) | −10.5 (−32.5, −3.5,) | −23.5 (−49.0, −12.0) | −1.0 (−22.0, 8.0) |
Values shown are Median (Q1, Q3).
OCA: obeticholic acid, NAS: nonalcoholic fatty liver disease activity score; INR: international normalized ratio; AST: aspartate aminotransferase; ALT: alanine aminotransferase
Multivariable Analysis
All variables selected by the stepwise selection process were independently significant (p<0.05) predictors of histologic improvement as shown in Figure 1 by the odds ratios and 95% CI. Figure 2 contains the ROC curve for the model for the overall population. The model performance characteristics as well as the actual predictive model are shown in Table 4. When the model was applied to the overall population, the AUROC (95% CI) was 0.83 (0.77–0.89); p<0.0001. Next, the model was applied to just OCA-treated patients or just Placebo-treated patients as an additional assessment of model performance. As shown in Figure 2, the AUROC was greater for the OCA patients than Placebo patients which is consistent with a model that is sensitive to treatment. The performance of the model in the overall population was very similar when tested on only OCA patients (nearly identical AUROC, 95% CI). At a cut point of 0.39, the model correctly predicted the histologic status of 77% of patients in the overall population. Individual patient probability values and prediction/histologic status are shown in Figure 3. At a probability cut point of 0.39, it is clear from Figure 3 that the model correctly predicts the histologic response or nonresponse of the majority of both OCA-treated patients and Placebo-treated patients. Additionally, as can be seen in Figure 3, there are fewer false predictions of non-responders than there are of responders which is consistent with the higher NPV and lower PPV values shown in Table 4.
Figure 1. Forest Plot of Predictors of Histologic Response.
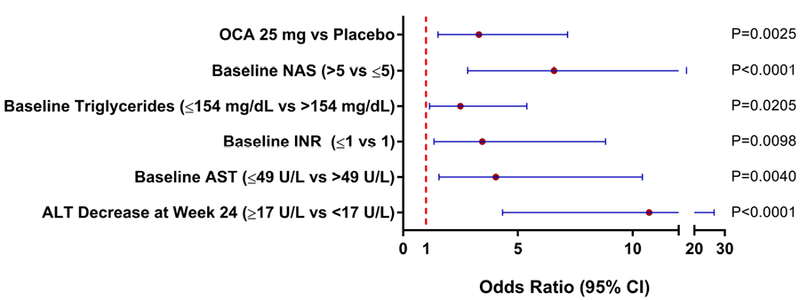
Plot shows the odds ratio and 95% CI for each of the selected predictors of responses, if the odds ratio is >1, the predictor is associated with higher odds of histological response. Significance of each of the selected predictors was assessed using a Wald Chi-Square test.
Figure 2. Receiver Operator Characteristic Curves.
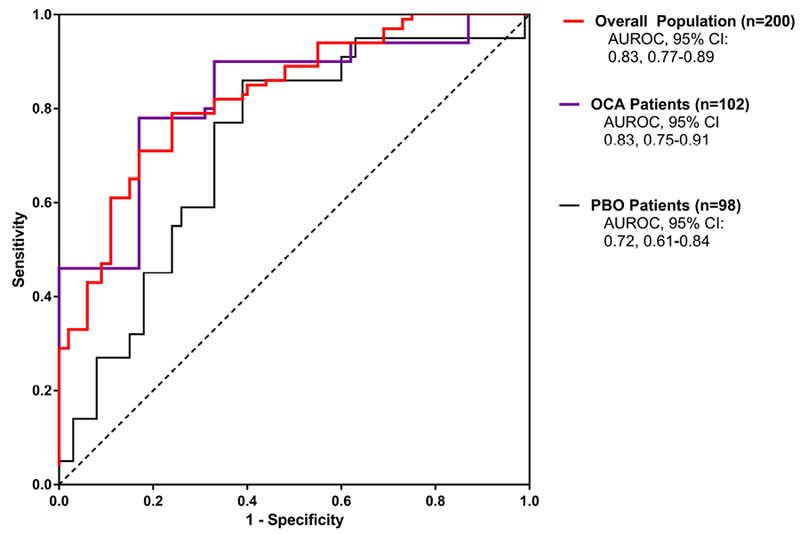
The ROC curve for the overall population (n=200) is shown in red; the ROC curve for patients receiving OCA (n=102) is shown in purple and the ROC curve for patients receiving Placebo (n=98) is shown in black. The model was significant when applied to the overall population as well as each of the treatment groups (p<0.0001 for all).
Table 4. Model Performance Parameters.
| Model Performance | |
|---|---|
| Cross-validated AUROC (95% CI) | 0.83 (0.77–0.89); p<0.0001 |
| PPV | 65.5% |
| NPV | 86.2% |
| Sensitivity | 79.2% |
| Specificity | 75.8% |
| AIC | 190 |
| BIC | 213 |
| Correct Prediction of Histologic Response | 77% |
| Probability Cutoff of Histologic Response | 0.39 |
| Clinical Model for Probability of Response to OCA | |
|
=−3.8520+1.1941*Treatment(OCA=1, PBO=0) −1.8836* baseline NAS(1 when<=5; 0 when >5) + 1.3949*Baseline AST (1 when <=49 U/L; 0 when >49 U/L) + 2.3717*ALT change at week 24 (1 when <=−17 U/L, 0 when >−17 U/L) +0.9124* Baseline Triglycerides (1 when <=154 mg/dL, 0 when >154 mg/dL) + 1.2376* Baseline INR (1 when <=1, 0 when >1) | |
P-value of the AUROC determined by a chi-square test.
For use of the clinical model, the selected parameters are input into the model and if the resultant probability is above 0.39 then the patient is predicted to achieve histologic response at Week 72.
AUROC: area under the receiver operator characteristic curve; PPV: positive predictive value; NPV: negative predictive value; AIC: Akaike information criterion; BIC: Bayesian information criterion; OCA: obeticholic acid; NAS: nonalcoholic fatty liver disease activity score; AST: aspartate aminotransferase; ALT: alanine aminotransferase; INR: international normalized ratio
Figure 3. Scatterplot of Model Predictions.
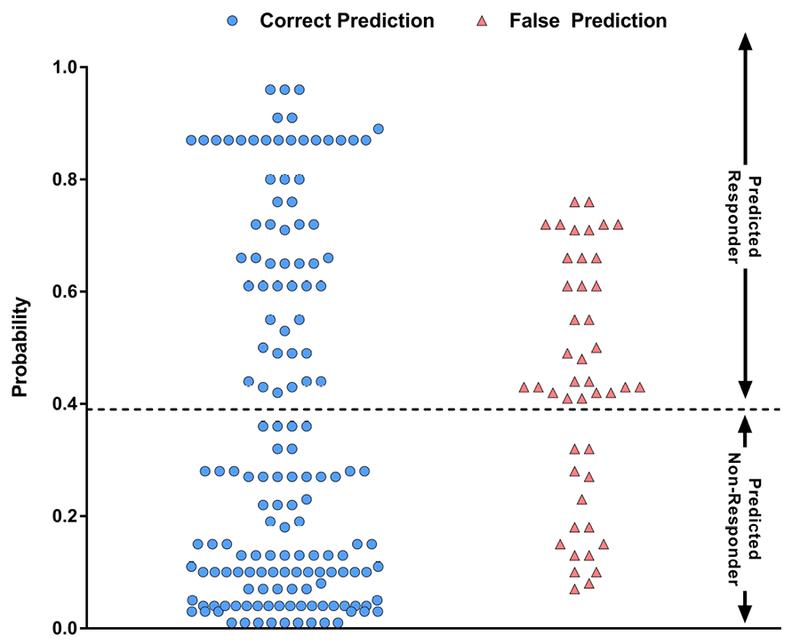
Scatterplot shows the probability of histologic response and accuracy of each prediction for all patients assessed in this analysis.
In a follow on exploratory analysis, OCA usage was manually removed from the model. The remaining selected parameters continued to be significant in multivariable analysis and AST change from baseline to Week 24 was selected into the model as shown in Supplemental Table 4.
Sensitivity Analysis
In an exploratory sensitivity analysis, in Placebo treated subjects, with the existing model OCA (Yes/No) was substituted for Vitamin E (Yes/No). OCA treated subjects were excluded from this experimental analysis as OCA usage may confound the results. In this analysis, utilizing the existing model substituting Vitamin E usage for OCA and making no other modifications to parameters or coefficients, the AUROC was 0.82. The Vitamin E substituted model shows similar performance to the OCA-treated patients and improved performance to the placebo-treated patients for a 2-point improvement in NAS (see Supplemental Table 5). This shows (as a proof-of principle) that this model could potentially be modified for other interventions, however, the probability cutoff may need to be optimized.
DISCUSSION
This study demonstrates that clinical parameters measured at baseline and during early therapy may be helpful in predicting improvement in liver histology in patients with NASH. This analysis identified OCA use, baseline NAS >5, baseline triglycerides ≤154 mg/dL, baseline INR ≤1, baseline AST ≤49 U/L, decrease in ALT at Week 24 ≥17 U/L as being significant predictors of histologic response and were integrated into a model to predict the probability of patients achieving histologic improvement. This model may potentially be used for future clinical trial design, specifically with regards to patient selection. Critically, this model may be used to identify patients with NASH who will have a high probability of achieving histologic improvement to OCA.
In assessing the biological plausibility of the selected predictors of histologic responsein this analysis, it is interesting to note that the trends for each of the selected predictors was the same when comparing histologic responders to non-responders regardless of treatment group (OCA vs. Placebo). The role of a high baseline NAS in predicting response could be explained by a high NAS making a quantitatively larger and thus more measurable change in NAS more likely. Fasting triglyceride levels are a reflection of hepatic secretion and peripheral lipolysis and uptake. It is hypothesized that lower baseline triglyceride levels may be reflective of a liver which is less burdened by triglyceride secretion, which in turn may have greater capacity/functionality for improvement. INR is a component of many algorithms (such as the model for end-stage liver disease [MELD] score) and evaluations of overall liver health, which is consistent in this analysis with normal INR being selected as predictive of histologic response. The predictive threshold for INR is low (INR≤1.0), which may be a result of the methodology of this study as cutoff thresholds for all continuous and ordinal parameters were derived from the median values of the total cohort. Notably, histologic responders had higher baseline AST compared with non-responders; however, the selected predictor of response was lower baseline AST. It is likely that lower baseline AST in combination with a greater reduction in ALT at Week 24 result in AST and ALT levels that are closer to normal, both of which are metrics of liver injury. Finally, as OCA treatment has been associated with histologic improvement as the primary endpoint of the FLINT trial, the selection of OCA as a predictor of response is consistent with the findings of the FLINT trial.
Collectively, it is hypothesized that the selected predictors may indicate that the patients most likely to achieve histologic response are those with higher disease activity, but still with largely conserved liver function allowing for potential healing/improvement. There was no evidence of an association between pruritus and histologic response. There are several aspects in the development of this model which are advantageous and add to the generalizability of the results of this analysis. For example, this model was derived from the FLINT trial which was a randomized, double-blind, placebo-controlled trial. Histologic interpretation of liver biopsy specimens was blinded, performed by expert pathologists, and used a widely accepted scoring system for histologic assessment. The analysis was internally cross validated using a jackknife method. The predictors identified in this analysis are readily available clinical and biochemical characteristics that are routinely available to clinicians and may be applied to daily practice. Finally, this model utilizes parameters which were dichotomized by the median values of the overall FLINT population which is both a strength and a limitation. By dichotomizing the predictors, the model becomes more accessible and easier to use. However, the tradeoff is that the probabilities estimated by the model may not be as granular as continuous assessments as evidenced by the stepwise probabilities observed among individual patients in this analysis.
Additional limitations of this analysis include a model designed around a given set of dates for patient enrollment; a different sampling frequency may have produced different results in the model. Also, the small sample size limits the generalizability of the results. Patients included in the primary study were recruited from tertiary care centers and might not represent patients encountered in primary care settings. In addition, patients with missing biopsies were excluded from this analysis, which could have biased the results. Another limitation of this model is that it is potentially subject to bias from overfitting, as the number of parameters assessed as potential predictors is near the number of events that are being predicted. Additionally, while Vitamin E usage was a selectable parameter in model development, OCA usage was the only controlled intervention assessed in this analysis. A more robust model could potentially be developed if multiple pharmacological interventions could be considered simultaneously. External validation of this model is needed to verify the findings of this analysis investigating both OCA and other pharmacological interventions to confirm the generalizability of this model. REGENERATE (http://www.ClinicalTrials.gov Identifier: NCT02548351) is a phase 3 study currently ongoing to confirm the clinical benefit of OCA in patients with NASH which may be utilized to confirm many of the findings of this analysis.
In summary, this analysis demonstrates that select baseline characteristics and early changes in clinical parameters may be helpful in predicting histologic response in adults with NASH. Future randomized controlled trials are needed to validate these findings.
Supplementary Material
Acknowledgments
Funding Source:
The FLINT study was funded by Intercept Pharmaceuticals, Inc. and the National Institute of Diabetes and Digestive and Kidney Diseases (NIDDK)
Abbreviations:
- (AIC)
Akaike information criterion
- (ALT)
Alanine aminotransferase
- (ALP)
alkaline phosphatase
- (AASLD)
American Association for the Study of the Liver
- (AST)
aspartate aminotransferase
- (AUROC)
area under the operating characteristic curve
- (BIC)
Bayesian information criterion
- (BMI)
body mass index
- (CRN)
Clinical Research Network
- (FXR)
farnesoid X receptor
- (FLINT)
Farnesoid X Receptor Ligand Obeticholic Acid in NASH Treatment
- (GGT)
gamma-glutamyl transpeptidase
- (HDL-C)
high-density lipoprotein cholesterol
- (INR)
international normalized ratio
- (LDL-C)
low-density lipoprotein cholesterol
- (NAFLD)
non-alcoholic fatty liver disease
- (NAS)
NAFLD Activity Score
- (NASH)
Non-alcoholic steatohepatitis
- (NPV)
negative predictive value
- (OCA)
obeticholic acid
- (PPV)
positive predictive value
- (SBP)
systolic blood pressure
Footnotes
Publisher's Disclaimer: This is a PDF file of an unedited manuscript that has been accepted for publication. As a service to our customers we are providing this early version of the manuscript. The manuscript will undergo copyediting, typesetting, and review of the resulting proof before it is published in its final citable form. Please note that during the production process errors may be discovered which could affect the content, and all legal disclaimers that apply to the journal pertain.
Conflict of Interest Statements:
Dr. Loomba serves on the steering committee of the REGENERATE trial and was the co-chair of the FLINT trial protocol writing committee. Dr. Loomba has received research funding from Intercept Pharmaceutical.
Dr. Sanyal reports no conflicts of interest for this project. Dr. Sanyal is President of Sanyal Biotechnology and has stock options in Genfit, Akarna, Tiziana, Indalo, Durect. He has served as a consultant to AbbVie, Astra Zeneca, Nitto Denko, Ardelyx, Conatus, Nimbus, Amarin, Salix, Tobira, Takeda, Fibrogen, Jannsen, Gilead, Boehringer, Lilly, Zafgen, Novartis, Pfizer, Immuron, Exhalenz and Genfit. He has been an unpaid consultant to Intercept, Echosens, Immuron, Galectin, Fractyl, Syntlogic, Novo Nordisk, Affimune, Chemomab, Nordic Bioscience and Bristol Myers Squibb. His institution has received grant support from Gilead, Salix, Tobira, Bristol Myers, Shire, Intercept, Merck, Astra Zeneca, Malinckrodt, Cumberland and Novartis. He receives royalties from Elsevier and UptoDate.
Dr. Kowdley has ongoing (or in the last 12 months) had consulting activities, advisory arrangements, speakers’ bureau and research grants from Gilead and Intercept Pharmaceuticals. He has also had advisory arrangements from Novartis and received research grants from GSK, Genefit, and Novartis.
Dr. Terrault has served on advisory boards for Intercept Pharmaceuticals.
Dr. Chalasani has ongoing consulting activities (or had in the preceding 12 months) with NuSirt, Abbvie, Eli Lilly, Afimmune (DS Biopharma), Tobira (Allergan), Madrigal, Shire, Cempra, Ardelyx, Axovant, Immuran and Amarin. These consulting activities are generally in the areas of nonalcoholic fatty liver disease and drug hepatotoxicity. Dr. Chalasani receives research grant support from Intercept, Lilly, Gilead, Galectin Therapeutics and Cumberland where his institution receives the funding. Over the last decade, Dr. Chalasani has served as a paid consultant to more than 30 pharmaceutical companies and these outside activities have regularly been disclosed to his institutional authorities.
Dr. Abdelmalek has received grant / research funding from Intercept for studies in NASH. Dr. Abdelmalek has ongoing (or in the last 12 month) had advisory or consulting activities for Immuron, BMS, NGM Bio, Madrigal, TaiwanJ, Pfizer, Lexicon, and Medimmune. Dr. Abdelmalek is on the speaker’s bureau for Alexion. Her institution has received grant funding for NASH research from Conatus, Intercept, Allergan, BMS, NGM Bio, TaiwanJ, Madrigal, Shire, Immuron, Galactin, Genfit, Enanta, Beohringer-Ingelheim, and Gilead. Dr. Abdelmalek receives royalties from UptoDate.
Dr. McCullough has nothing to disclose.
Reshma Shringarpure, Lois Lee, Alexander Liberman, David Shapiro are employees and shareholders of Intercept Pharmaceuticals, Inc.
Beatrice Ferguson and Jianfen Chen were previously employees of Intercept Pharmaceuticals, Inc. and are currently shareholders of Intercept Pharmaceuticals Inc.
Dr. Neuschwander-Tetri has advised/consulted for Galmed, Zafgen, Receptos, Pfizer, Allergan, MedImmune/AstraZeneca, ConSynance, Tobira, Karos, Afimmune, NuSirt, Arrowhead, Reset, and Intercept Pharmaceuticals, Inc.
REFERENCES
- 1.Ekstedt M, Hagstrom H, Nasr P, et al. Fibrosis stage is the strongest predictor for disease-specific mortality in NAFLD after up to 33 years of follow-up. Hepatology 2015;61:1547–54. [DOI] [PubMed] [Google Scholar]
- 2.Soderberg. Decreased Survival of Subjects with Elevated Liver Function Tests During a 28-Year Follow-Up. Hepatology 2010;51:595–602. [DOI] [PubMed] [Google Scholar]
- 3.Matteoni CA, Younossi ZM, Gramlich T, et al. Nonalcoholic fatty liver disease: a spectrum of clinical and pathological severity. Gastroenterology 1999;116:1413–9. [DOI] [PubMed] [Google Scholar]
- 4.Singh S, Allen AM, Wang Z, et al. Fibrosis Progression in Nonalcoholic Fatty Liver vs Nonalcoholic Steatohepatitis: A Systematic Review and Meta-analysis of Paired-Biopsy Studies. Clin Gastroenterol Hepatol 2015;13:643–654. [DOI] [PMC free article] [PubMed] [Google Scholar]
- 5.Charlton MR, Burns JM, Pedersen RA, et al. Frequency and outcomes of liver transplantation for nonalcoholic steatohepatitis in the United States. Gastroenterology 2011;141:1249–53. [DOI] [PubMed] [Google Scholar]
- 6.Gawrieh S, Chalasani N. Emerging Treatments for Nonalcoholic Fatty Liver Disease and Nonalcoholic Steatohepatitis. Clin Liver Dis 2018;22:189–199. [DOI] [PubMed] [Google Scholar]
- 7.Chalasani N, Younossi Z, Lavine JE, et al. The diagnosis and management of non-alcoholic fatty liver disease: practice Guideline by the American Association for the Study of Liver Diseases, American College of Gastroenterology, and the American Gastroenterological Association. Hepatology 2012;55:2005–23. [DOI] [PubMed] [Google Scholar]
- 8.Neuschwander-Tetri BA, Loomba R, Sanyal AJ, et al. Farnesoid X nuclear receptor ligand obeticholic acid for non-cirrhotic, non-alcoholic steatohepatitis (FLINT): a multicentre, randomised, placebo-controlled trial. [published corrections appear in Lancet. 2015;385:946 and Lancet. 2016;387;1618]. The Lancet 2015;385:956–965. [DOI] [PMC free article] [PubMed] [Google Scholar]
- 9.Mudaliar S, Henry RR, Sanyal AJ, et al. Efficacy and safety of the farnesoid X receptor agonist obeticholic acid in patients with type 2 diabetes and nonalcoholic fatty liver disease. Gastroenterology 2013;145:574–82 e1. [DOI] [PubMed] [Google Scholar]
- 10.Albanis E, Alvarez CE, Pruzanski M, et al. Antifibrotic Activity of INT-747, A Novel FXR Activator, In Vitro and in Experimental Liver Fibrosis and Cirrhosis, In American Association for the Study of Liver Diseases, San Francisco, CA, 2005. [Google Scholar]
- 11.Buzzetti E, Lombardi R, De Luca L, et al. Noninvasive Assessment of Fibrosis in Patients with Nonalcoholic Fatty Liver Disease. Int J Endocrinol 2015;2015:343828. [DOI] [PMC free article] [PubMed] [Google Scholar]
- 12.Dowman JK, Tomlinson JW, Newsome PN. Systematic review: the diagnosis and staging of non-alcoholic fatty liver disease and non-alcoholic steatohepatitis. Aliment Pharmacol Ther 2011;33:525–40. [DOI] [PMC free article] [PubMed] [Google Scholar]
- 13.Bazick J, Donithan M, Neuschwander-Tetri BA, et al. Clinical Model for NASH and Advanced Fibrosis in Adult Patients With Diabetes and NAFLD: Guidelines for Referral in NAFLD. Diabetes Care 2015;38:1347–55. [DOI] [PMC free article] [PubMed] [Google Scholar]
- 14.Kleiner DE, Brunt EM, Van Natta M, et al. Design and validation of a histological scoring system for nonalcoholic fatty liver disease. Hepatology 2005;41:1313–21. [DOI] [PubMed] [Google Scholar]
- 15.Schwarz G Estimating Dimension of a Model. Annals of Statistics 1978;6:461–464. [Google Scholar]
- 16.Akaike H Citation Classic - a New Look at the Statistical-Model Identification. Current Contents/Engineering Technology & Applied Sciences 1981:22–22. [Google Scholar]
- 17.Hameed B, Terrault NA, Gill RM, et al. Clinical and metabolic effects associated with weight changes and obeticholic acid in non-alcoholic steatohepatitis. Aliment Pharmacol Ther 2018. [DOI] [PMC free article] [PubMed] [Google Scholar]
Associated Data
This section collects any data citations, data availability statements, or supplementary materials included in this article.