

Intensive surveillance for enterohemorrhagic Escherichia coli (EHEC) serogroup O157 is important to detect outbreaks and to prevent the spread of the bacterium. Recent advances in sequencing technology made molecular surveillance using whole-genome sequence (WGS) realistic. To develop rapid, high-throughput, and cost-effective typing methods for real-time surveillance, typing resolution of WGS and a conventional typing method, multilocus variable-number tandem-repeat analysis (MLVA), was evaluated. Nation-level systematic comparison of MLVA, core genome single nucleotide polymorphism (cgSNP), and core genome multilocus sequence typing (cgMLST) indicated that a combination of WGS and MLVA is a realistic approach to improve EHEC O157 surveillance.
KEYWORDS: core genome SNP analysis, core genome multilocus sequence typing, enterohemorrhagic Escherichia coli, multilocus variable-number tandem-repeat analysis, whole-genome sequencing
ABSTRACT
Due to the potential of enterohemorrhagic Escherichia coli (EHEC) serogroup O157 to cause large food borne outbreaks, national and international surveillance is necessary. For developing an effective method of molecular surveillance, a conventional method, multilocus variable-number tandem-repeat analysis (MLVA), and whole-genome sequencing (WGS) analysis were compared. WGS of 369 isolates of EHEC O157 belonging to 7 major MLVA types and their relatives were subjected to comprehensive in silico typing, core genome single nucleotide polymorphism (cgSNP), and core genome multilocus sequence typing (cgMLST) analyses. The typing resolution was the highest in cgSNP analysis. However, determination of the sequence of the mismatch repair protein gene mutS is necessary because spontaneous deletion of the gene could lead to a hypermutator phenotype. MLVA had sufficient typing resolution for a short-term outbreak investigation and had advantages in rapidity and high throughput. cgMLST showed less typing resolution than cgSNP, but it is less time-consuming and does not require as much computer power. Therefore, cgMLST is suitable for comparisons using large data sets (e.g., international comparison using public databases). In conclusion, screening using MLVA followed by cgMLST and cgSNP analyses would provide the highest typing resolution and improve the accuracy and cost-effectiveness of EHEC O157 surveillance.
IMPORTANCE Intensive surveillance for enterohemorrhagic Escherichia coli (EHEC) serogroup O157 is important to detect outbreaks and to prevent the spread of the bacterium. Recent advances in sequencing technology made molecular surveillance using whole-genome sequence (WGS) realistic. To develop rapid, high-throughput, and cost-effective typing methods for real-time surveillance, typing resolution of WGS and a conventional typing method, multilocus variable-number tandem-repeat analysis (MLVA), was evaluated. Nation-level systematic comparison of MLVA, core genome single nucleotide polymorphism (cgSNP), and core genome multilocus sequence typing (cgMLST) indicated that a combination of WGS and MLVA is a realistic approach to improve EHEC O157 surveillance.
INTRODUCTION
Enterohemorrhagic Escherichia coli (EHEC), an important etiologic agent of food borne illness worldwide, can cause diarrhea, hemorrhagic colitis, and life-threatening hemolytic uremic syndrome (1). The primary reservoir of EHEC is ruminants (2–5), and contaminated beef, raw milk, and fresh produce are often identified as routes of transmission to humans. More than 3,000 cases of infection are reported annually in Japan (6), and the isolates are extensively monitored to detect nationwide outbreaks. EHEC O157:H7/H− is the predominant serotype in Japan and accounts for more than half of all domestic cases (6). EHEC O157 isolated in the local health institutes was collected at the National Institute of Infectious Diseases (NIID), Japan, and relatedness among isolates has been analyzed by molecular typing. Because many isolates should be examined in outbreak investigation, high resolution, rapidity, cost-effectiveness, and high throughput are required for the molecular typing.
The previous “gold standard” for the molecular typing of EHEC O157 was pulsed-field gel electrophoresis, which generates a DNA restriction pattern of the whole genome using rare-cutter enzymes such as XbaI (7, 8). However, 17 loci multilocus variable-number tandem-repeat analysis (MLVA) (9) is currently used in national surveillance in Japan due to its higher typing resolution. MLVA determines the number of the repeat units in multiple loci by sizing the PCR amplicons. In our current procedure, a colony in a pure culture plate is picked and resuspended in two tubes with a PCR mixture. After PCR amplification, fragment size analysis determines the number of repeat units in each locus (9). The entire procedure can be completed within 1 day. MLVA has been used for outbreak investigation of EHEC in some local health institutes in Japan. The method is rapid, easy, and can be high-throughput; thus, it offers an advantage in outbreak investigations compared with other molecular typing methods.
However, MLVA results do not have phylogenetic and isolate information, including virulence factor and antimicrobial resistance profiles. This weakness can be overcome by whole-genome sequence (WGS) analyses. Recent advances in the technology have enabled many laboratories to perform WGS of target bacteria. WGS analyses have been applied to outbreak investigations and national surveillance in some countries (10–12). In addition to its high typing resolution, another advantage of WGS is that most of the conventional molecular characterization can be performed simultaneously in silico. Many Web-based or standalone programs for in silico MLST, virulence profiling, antimicrobial resistance gene detection, and others are available (12, 13). Although molecular typing using WGS is expected to be the next standard (14), continued use of MLVA may be warranted in the investigation of outbreaks due to its rapidity and cost-effectiveness. In the meantime, there is scarce information on the systematic evaluation of MLVA. It is important to determine the ability and limitations of MLVA, as this typing method is routinely used in outbreak investigations. The objectives of this study were (i) to evaluate the 17-loci MLVA scheme at the genomic level, (ii) to develop a WGS analysis workflow, and (iii) to examine the applicability of core genome single nucleotide polymorphism (cgSNP) and core genome multilocus sequence typing (cgMLST) analysis in national surveillance. Based on the results, a realistic approach using both MLVA and WGS in the national surveillance of EHEC O157 is discussed.
RESULTS
Comprehensive characterization of the isolates by WGS.
In our automated in silico analyses pipeline, the whole analyses, including quality trimming of short reads, de novo assembly, and in silico gene typing, required approximately 20 minutes per isolate by using a computer with 20 CPU cores (Intel Xeon E5-2687W v.3, 3.10 GHz) and 128 GB memory. Complete information of the isolates and contigs is shown in Table S1 and S2 in the supplemental material. The results showed that phylogenetic group, MLST, and ribosomal multilocus sequence typing (rMLST) displayed low variation in each MLVA group (Table S1). In contrast, the profiles of virulence genes, plasmid replicons, and antimicrobial resistance genes showed variation in each MLVA group. The variation in plasmid replicons suggested rapid gain and loss of plasmids. Notably, absence of the IncFIB and IncFII plasmid was coupled with the absence of plasmid-encoded virulence genes, including ehxA, espP, and etpD, suggesting the loss of pO157 in five isolates (JE157-ML025, 044, 172, 175, and 193). These results were confirmed by using additional PCR. Additionally, some chromosome-encoded virulence genes, including astA, espF, iha, and tccP, were variable in our data set. Three isolates (JE157-ML010, 016, and 017) carried multiple antimicrobial resistance genes encoding aminoglycoside, β-lactam, streptomycin, sulfonamide, tetracycline, and trimethoprim resistance. Comprehensive in silico typing of the isolates was useful in characterizing the isolates. However, such typing was not sufficient to find the differences in the clonal populations, prompting us to further analyze the genome by cgSNP and cgMLST.
mutS deletion in some isolates.
Before further analysis was conducted, the presence of the gene encoding the mismatch repair protein mutS was investigated in all the isolates. Mutation of this gene leads to a hypermutator phenotype (15) that may affect the cgSNP values. Eight of 369 isolates (2.2%) had partial or complete deletion of mutS. The other isolates carried the identical mutS sequence. There were no mutations or indels in the other mismatch repair system protein genes mutL and mutH. The size of the deleted region ranged from 55 bp to 33.4 kb (Fig. 1). Upstream of mutS, deletions were found in various regions, whereas downstream of mutS, deletions were found on or around rpoS or truD. There were no clear repeats or signature sequences around the junction. Among the mutS-deleted isolates, five isolates (JE157-ML037, 068, 076, 150, and 151) had epidemiological links to the other isolates, and relatively high numbers of SNPs were observed (see Fig. S1 in the supplemental material). JE157-ML037 and JE157-ML068 had four and seven SNP loci, respectively, compared to the isolates obtained from the same family member. JE157-ML076 originated from a kindergarten outbreak. The isolates showed a seven to nine SNP loci difference compared with the other isolates from the same outbreak. JE157-ML150 and JE157-ML151 originated from the same foodborne outbreak. These isolates showed 13 to 15 SNP loci that were distinct from the other isolates in the same outbreak. All the other epi-linked isolate pairs showed four or fewer distinct SNP loci, as described below. Therefore, it was suggested that mutS-deleted isolates may have elevated mutation rates and, thus, were excluded from the cgSNP distance analyses.
FIG 1.

Deleted region around mutS in the isolates used in this study. Closed arrows indicate the presence of the gene, and open arrows indicate the absence of the gene. The genes where the junction is located are highlighted in black. The number represents the nucleotide position in the reference strain Sakai.
Phylogenetic relationship of the isolates and cgSNP distance analyses.
In our cgSNP analysis, 1,384 informative loci were determined, excluding 263 clustered SNPs and 133 SNPs in repeat regions. Phylogenetic analysis of cgSNP showed that most of the isolates clustered according to the MLVA group (Fig. 2). The median value of the intra-MLVA group SNP distance was 2 (range, 0 to 116), while that of the inter-MLVA group was 418 (range, 14 to 491) (see Fig. S2 in the supplemental material). However, some of the DLV and TLV isolates were clustered with different MLVA groups. cgSNP distance analyses were performed using 361 isolates, excluding the mutS-deleted isolates. First, the SNP distance between epi-linked isolates was summarized. In the epi-linked isolates, the median value was zero and the maximum value was four (Fig. 3). Second, relationships between SNP distances and the number of MLVA allele difference were analyzed (Fig. 4). When MLVA allele difference was 0 or 1, the median values of SNP loci were 1 and more than 90% of the pairs showed ≤10 loci of SNPs. When the MLVA allele difference was 2 or more, the median value increased to 5 or more, and proportion of pairs showing ≤10 loci of SNPs decreased rapidly. The median joining tree by cgSNP of the G1 to G4 group reinforced the observation that isolates with the same MLVA type or single locus variants (SLV) are clonal, while double locus variants (DLV) and triple locus variants (TLV) have varied genetic distances (see Fig. S3 in the supplemental material). Epi-linked isolates clustered by both MLVA type and cgSNP. In the median joining tree of the G5 to G7 group, accumulation of SNPs and branching of the tree with time were observed (see Fig. S4 in the supplemental material). Even in SLV isolates, up to 10 loci of SNPs had accumulated. To corroborate the accumulation of SNPs over time, the relationship between SNP distance and interval of isolation date was analyzed in all pairs which have zero or one MLVA allele difference (Fig. 5). The proportion of the pairs showing ≤5 SNPs was 98.9% when the interval of the isolation date was ≤60 days, while the value was 55.9% when the interval was more than 60 days. A regression analysis also supports the findings (see Fig. S5 in the supplemental material). When the MLVA allele difference was zero or one, although R2 values were low, a weak positive correlation was found. These results suggested that isolates which were obtained over years are likely to have more SNPs than those obtained during a short period of time even if the MLVA profiles were similar.
FIG 2.

Phylogenetic tree of all strains used in this study. The tree was constructed by the maximum likelihood method with 1,000 bootstrap replicates (42) using a concatenated SNP alignment after removal of recombinant regions. The color of the branch and of the first ring indicates the MLVA group. The color of the second ring indicates the locus variant (LV) in each MLVA group: SLV, single locus variants; DLV, double locus variants; and TLV, triple locus variants.
FIG 3.

Histogram of pairwise SNP distances between the epi-linked isolates.
FIG 4.

Box plots of pairwise SNPs stratified by MLVA allele difference. From the pairwise data matrix of all the isolates, two distance values (cgSNP and MLVA allele difference) were generated. This figure illustrates the relationship of the values. The x axis represents the number of MLVA allele differences. In each value, the number of pairwise cgSNP loci was shown as a box plot (y axis). Circles and crosses represent outliers and means, respectively. The first and third quartile and the maximum and minimum values without outliers are shown. Prop., proportion.
FIG 5.
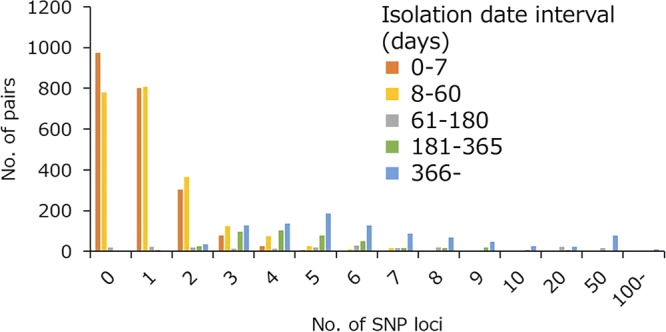
Histogram showing the relationship between the number of SNP loci and interval of isolation date. This figure was generated using cgSNP results of the isolate pairs that have zero or one MLVA allele difference.
cgMLST analysis.
For epidemiological investigations, cgMLST can complement cgSNP because cgMLST analysis requires less time and computer power (16). Allele information of cgMLST was obtained from the draft genome, and the number of different loci was calculated in the same way as in the cgSNP analysis. The distance values of cgMLST were smaller than those of cgSNP as a whole, but the values obtained using the two methods were well correlated (R2 = 0.99) (see Fig. S6 in the supplemental material). The relationship between cgMLST and MLVA distance showed a trend similar to that of cgSNP, but the values were smaller (Fig. 6). However, the pairwise allele distance in the epi-linked pairs was larger, and its range was broader, than in the cgSNP analysis (Fig. 7). The median value was 2 and ranged from 0 to 17. These larger values were found to be related to the presence of “soft-core genes,” which are genes carried by almost all but not all E. coli strains. When these genes were removed, more than 99% of the epi-linked isolates showed no difference in cgMLST (data not shown).
FIG 6.

Box plots of pairwise difference of cgMLST allele stratified by MLVA allele difference. From the pairwise data matrix of all the isolates, two distance values (cgMLST and MLVA allele difference) were generated. This figure illustrates the relationship of the values. The x axis represents the number of MLVA allele differences. In each value, the number of cgMLST allele differences was shown as a box plot (y axis). Circles and crosses represent outliers and means, respectively. The first and third quartile and the maximum and minimum values without outliers are shown. Prop., proportion.
FIG 7.

Histogram of pairwise cgMLST allele differences between epi-linked isolates.
DISCUSSION
In this study, we evaluated the typing resolution of MLVA, cgSNP, and cgMLST in seven major MLVA types and their relatives. The results showed that the typing resolution was the highest in cgSNP. Although MLVA had high typing resolution, SNPs were accumulated when the isolation date was distant, even in the same MLVA type. Epi-linked isolates possessed four or fewer SNP loci, a finding that is concordant with previous reports in EHEC, in which epi-linked isolates showed 7 or fewer SNP loci (10–12, 17). Therefore, it is suggested that the presence of ≤5 SNP loci indicates that the isolates are very closely related, that they may arise from the same source, and that the presence of 6 to 10 SNP loci still indicates a possibility that the isolates originate from the same source. These small numbers of SNPs would be a trigger for epidemiological investigation. In our data set, many isolates without a known epi-link clustered together (Fig. S3 and S4). According to further investigation by local public health institutes, the common source was found in some cases. However, epidemiological information is always important in interpreting the results because the number of SNPs can vary due to numerous factors, including analysis method and sample size. Additionally, in silico typing based on WGS data can replace most conventional genotyping, including gene profiling and MLST. Certain clades (18, 19) or MLST types (20–22) have been suggested to be more pathogenic than others; therefore, this genotype information could complement virulence gene data in evaluating pathogenicity of the isolates. In our analysis pipeline, the entire analysis of one isolate requires approximately 20 minutes. It requires 80 to 90 h to obtain short reads from a pure culture with current methods using the MiSeq platform. Thus, all analyses can be completed within approximately 4 days. This represents less time and labor than some typing methods (e.g., H-typing), which can require several days. In some cases, the cost of whole-genome sequencing can be lower than that of current routine typing (12, 23).
On the other hand, in an outbreak investigation, MLVA still has advantages over WGS analysis because it is rapid and can be high throughput. MLVA is reliable, especially for isolates that are obtained over short periods (e.g., less than several months). EHEC isolates are usually obtained within a period of a few months during outbreaks. Therefore, MLVA has sufficient typing resolution in most cases. Meanwhile, WGS-based analysis will be necessary for long-term phylogenetic studies because some SLV and DLV isolates show larger numbers of SNPs than other isolates. This is reasonable because the locus variants are heterogeneous groups that include different allele variants and different repeat numbers. In a previous study, only a few differences in the number of repeat units were observed in short-term evolution experiments (24). Therefore, it is suggested that strains with large differences in repeat number would be genetically distant. This may explain the large number of SNPs in JE157-ML336 and JE157-ML013. JE157-ML336 had three repeat differences in the O157-3 locus compared with the index type, while the other variants had two or fewer repeat differences. JE157-ML013 had two repeat differences from the index type in the O157-9 locus, while the other variants had only one repeat difference. Another possible explanation for the exceptionally large number of SNPs in SLV and DLV is the existence of different mutation rates for each allele. Although we were unable to examine this statistically due to the small sample size in some allele variants, there was a biased mutation rate in each allele (see Fig. S7 in the supplemental material).
Despite the high typing resolution, we found a region that should receive careful attention in WGS analyses. Partial or complete deletion of the gene encoding the mismatch repair protein MutS and its neighboring region was found in eight (2.2%) of the isolates. MutS repairs mismatches in the newly synthesized strand of DNA, which is not methylated, in cooperation with MutH and MutL (25). LeClerc et al. previously reported that deletion of mutS is likely to be associated with a hypermutator phenotype (15). Additionally, Gong et al. (26) reported that a 6-bp deletion of mutL led to an increase in the mutation rate in Salmonella enterica. In our analysis, mutS-deleted isolates were removed from cgSNP distance analyses because some of them had higher numbers of SNPs between the other epi-linked isolates. The results indicate that it is essential to confirm the presence of an intact mutS sequence prior to SNP analysis. On the other hand, we were not able to detect apparent differences in MLVA type in mutS-deleted isolates. This is concordant with the previous report showing that the mismatch repair system only recognizes mismatches ≤4 bp in length and is not applicable to the MLVA alleles (27). The mechanism of the deletion was unclear because there was no apparent homologous sequence in the junction. It is also unclear when the deletion occurred. One possibility is that the genome region containing mutS was spontaneously deleted during storage. In our laboratory, most of the isolates were stored as stab cultures at room temperature due to space limitations. A study of Faure et al. (28) suggested that long-term stab culture leads to the deletion of large segments of the genome (ca. 20 kb). It is of interest whether the mutS region was lost during storage, and this possibility is now under investigation.
Although cgSNP analysis has high resolution, significant computer resources and time are required to analyze hundreds of isolates, and the addition of a new isolate to a previous analysis is often laborious. Hence, cgMLST analysis was evaluated as a means of developing an efficient surveillance method. cgMLST analysis can save time and computational resources compared with cgSNP. Moreover, interlaboratory comparison is easier than SNP-based analysis (14, 29–31). We used cgMLST rather than whole-genome (wg) MLST because the mechanism of acquisition and loss of DNA is less well understood than that of point mutation and because cgMLST is expected to have practically sufficient resolution (16, 32). Additionally, cgMLST can be run on local computers and, thus, could be incorporated into our automated pipeline. The comparison of cgSNP and cgMLST showed that there was high correlation between the results of the two methods. Although cgMLST profiles were more diverse than cgSNP profiles in epi-linked isolates, this was due to the inclusion of soft-core genes in the current EnteroBase protocol. Additionally, we identified that misassembly, especially in a low-coverage region leads to incorrect allele designation and a large deletion can cause multiple gene loss. These artifacts increase the variation of cgMLST results. Based on these results, it is suggested that cgSNP analysis would generate more reliable results, whereas cgMLST is a more suitable method in comparing phylogenetically diverse and large data sets. Once cgMLST is determined, only a few minutes are required to determine the distance between an outbreak strain and all known cgMLST types. WGS data on more than 70,000 isolates from various countries are available in EnteroBase. The availability of such public databases and cgMLST comparisons makes it possible to investigate the international transmission of EHEC more easily.
According to our analysis, it is suggested that the use of a combination of MLVA and WGS analyses would improve the accuracy and cost-effectiveness of EHEC surveillance. A schematic view of an EHEC O157 surveillance workflow using MLVA and WGS analyses is shown in Fig. 8. In an outbreak investigation, many isolates obtained from different patients, foods, and environments should be examined by molecular typing. Our results showed that it is less important to obtain WGS of all isolates showing the same MLVA type because they are genetically close. Hence, it would be more efficient to obtain the WGS of selected isolates after initial screening using MLVA. Subsequently, comprehensive in silico typing, including cgMLST can be performed by the automated pipeline. Then, using the cgMLST results, a comparison of the genomes of outbreak isolates with those in public databases or with data obtained from other researchers can be performed. Finally, cgSNP analysis using only closely related genotypes will improve the typing resolution (33), and the resulting phylogenetic tree would make it possible to infer the transmission route of the pathogens.
FIG 8.
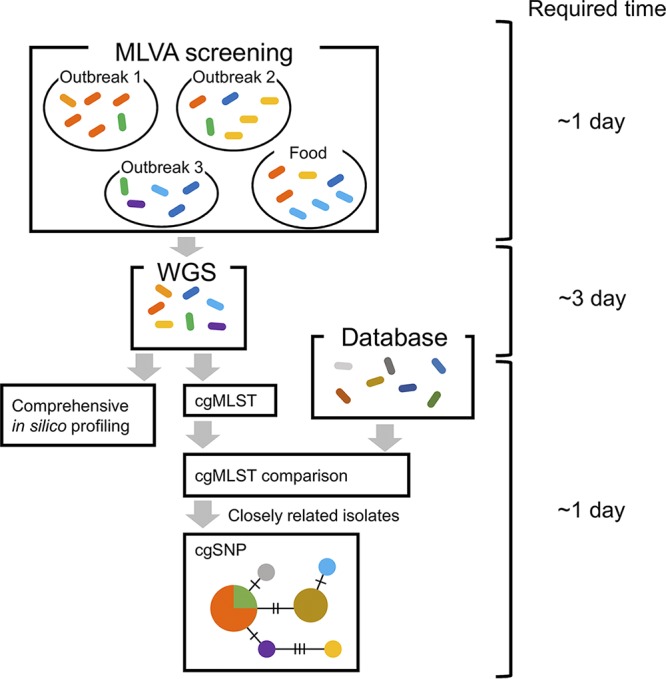
Schematic view of EHEC O157 surveillance workflow using MLVA and WGS analyses. The colored ellipses represent EHEC O157 isolates of different MLVA types. The maximum time required for the analysis is shown on the right.
In conclusion, our data show that MLVA, cgMLST, and cgSNP have sufficient typing resolution for short-term outbreak investigation. MLVA offers advantages in cost, labor, and time, while WGS analysis permits comprehensive strain characterization and high-resolution phylogenetic analysis. Therefore, the use of a combination of these methods will lead to accurate and cost-effective tracking of EHEC.
MATERIALS AND METHODS
Isolates used in this study.
A total of 369 EHEC O157 isolates from patients, asymptomatic carriers, and food were used in this study. These isolates were isolated and identified as E. coli O157 at the local health institutes. Patient information was anonymized in this study. Complete information about the isolates is shown in Table S1. Epidemiological links, including members of the same facility or school, family, and identified common source, have been identified in 169 isolates (45.8%). The epidemiological links of the remaining isolates are unknown. In our national surveillance, all of the EHEC O157 isolates collected in NIID were analyzed by MLVA as described by Izumiya et al. (9). Allele O157-10 was not used because it is hypervariable. A unique identifier (ID) was assigned to each profile, as shown in Table S1. From our collection, EHEC O157 isolates consisting of seven major MLVA types from 2012 to 2017 (MLVA IDs 13m0551, 15m0278, 16m0110, 17m0121, 13m0157, 13m0694, and 14m0004) were selected. These MLVA types are referred as “index types” in this paper. Additionally, single-, double-, and triple-locus variants (SLV, DLV, and TLV, respectively) of these index types were included in the analyses (Table 1). Each index type and its relatives were regarded as an “MLVA group” in this paper. These MLVA groups were selected to include both large outbreak- and sporadic case-related MLVA type. MLVA group G1 to G4 mainly consists of isolates that have been responsible for large outbreaks. Isolates of MLVA group G5 to G7 were obtained over a period of several years, and the epidemiological links of most of the isolates are unknown.
TABLE 1.
Number of isolates of each MLVA group
| MLVA group | Index MLVA type ID | No. of isolates ofa
: |
|||
|---|---|---|---|---|---|
| Index | SLV | DLV | TLV | ||
| G1 | 13m0551 | 56 | 10 | 1 | 7 |
| G2 | 15m0278 | 39 | 9 | 0 | 2 |
| G3 | 16m0110 | 26 | 2 | 0 | 0 |
| G4 | 17m0121 | 41 | 6 | 24 | 2 |
| G5 | 13m0157 | 18 | 11 | 6 | 10 |
| G6 | 13m0694 | 36 | 18 | 19 | 6 |
| G7 | 14m0004 | 5 | 9 | 4 | 2 |
Index, index MLVA type; SLV, single locus variant; DLV, double locus variant; TLV, triple locus variant.
WGS analyses for phylogenetic tree construction and calculation of pairwise SNP distances.
Whole-genome sequences were obtained using the MiSeq platform (Illumina, San Diego, CA, USA). The genomic DNA libraries were prepared using a Nextera XT DNA sample prep kit (Illumina). The pooled libraries were subjected to multiplexed paired-end sequencing (300-mer × 2). Minimum coverage for the analyses was 40×. The short reads were assembled using SPAdes v.3.11.1 with the “–careful” option (34). Contigs of each isolate were comprehensively characterized using an in-house BLAST-based pipeline, which is available upon request, with the following references and databases (last updated at August 2018): serotype (SerotypeFinder 1.1, https://cge.cbs.dtu.dk/services/SerotypeFinder/), phylogenetic group (35), clade (18), presence of virulence genes (VirulenceFinder 1.5, https://cge.cbs.dtu.dk/services/VirulenceFinder/), plasmid replicons (PlasmidFinder 1.3, https://cge.cbs.dtu.dk/services/PlasmidFinder/) and antimicrobial resistance genes (ResFinder 3.0, https://cge.cbs.dtu.dk/services/ResFinder/), MLST (EnteroBase, http://enterobase.warwick.ac.uk/), rMLST (PubMLST, https://pubmlst.org/rmlst/), and cgMLST (16). Short reads were trimmed by sickle (36) with default settings, followed by mapping to the complete genome sequence of EHEC O157 strain Sakai (GenBank accession no. BA000007) by using BWA v.0.7.17 (37). From these mapping data, SNPs in the core genome were identified using SAMtools v.1.7 (38) and VarScan v.2.4.3 (39) with default settings. Repetitive regions longer than 50 bp were detected by MUMmer v.3.2259 (nucmer, repeat-match, and exact-tandems functions) (40) and removed for further analyses, as were prophage regions. SNP clusters (>2 SNPs within 100 bp) were removed to exclude any SNPs in recombinogenic regions (41). The concatenated SNP sequences were used for further analyses. Phylogenetic relationships were determined by reconstructing a phylogenetic tree using the maximum likelihood method with 1,000 bootstraps using RAxML v.8.2.9 (42). The genetic distance of two arbitrary isolates was described as the SNP distance, which is the number of different loci in concatenated SNP sequences. We constructed a distance matrix for all possible pairs of the 361 isolates that have intact mutS using MEGA 7 software (43). To visualize the SNP distance in each MLVA group, a median joining network tree was constructed using PopART software v.1.7 (http://popart.otago.ac.nz). Regression analysis of SNP distance and the interval of isolation date was performed using R v.3.5.0 (44).
Data availability.
The FASTQ sequences and assembled contigs used in this study were deposited in the DNA Data Bank of Japan (http://www.ddbj.nig.ac.jp) under SRA accession number DRA007301.
Supplementary Material
ACKNOWLEDGMENTS
We are grateful to Saomi Ozawa, Yukie Nakajima, Ayumi Takemoto, and Yu Takizawa for technical assistance and WGS analyses. We are also grateful to the members of the EHEC Working Group, who are listed as follows: Yo Morimoto, Keiko Ogawa (Hokkaido Institute of Public Health), Takayuki Konno, Yuko Kumagai (Health and Hygiene Division of Akita Prefectural Research Center for Public Health and Environment), Junji Seto (Yamagata Prefectural Institute of Public Health), Rie Kikuchi (Fukushima Prefectural Institute of Public Health), Yuri Unno, Arimi Nakamoto (Ibaraki Prefectural Institute of Public Health), Yuko Kawai (Gunma Prefectural Institute of Public Health and Environmental Sciences), Chiba City Institute of Health and Environment, Shinichiro Hirai, Eiji Yokoyama (Chiba Prefectural Institute of Public Health), Hiromi Obata, Noriko Konishi (Tokyo Metropolitan Institute of Public Health), Sachiko Homma, Akiko Kubomura, Kuniharu Sasaki, Youko Anzawa (Kawasaki City Institute for Public Health), Atsuko Ogawa, Yuko Matsumoto (Yokohama City Institute of Public Health), Junko Aoki (Niigata Prefectural Institute of Public Health and Environmental Sciences), Keiko Kimata, Junko Isobe (Department of Bacteriology, Toyama Institute of Health), Eriko Kimura (Ishikawa Prefectural Institute of Public Health and Environmental Science), Fukui Prefectural Institute of Public Health and Environmental Science, Makiko Noda, Yukiko Kadokura, Yoshihiko Kameyama (Gifu Prefectural Research Institute for Health and Environmental Sciences), Shizuoka City Institute of Environmental Sciences and Public Health, Kyoto City Institute of Health and Environmental Sciences, Takeshi Ohishi, Satoko Nakajima, Kenji Konaka, Naoki Takeda, Naoki Fujimoto (Kyoto Prefectural Institute of Public Health and Environment), Yuki Wakabayashi (Osaka Institute of Public Health), Sakai City Institute of Public Health, Hyogo Prefectural Institute of Public Health Science, Ryohei Nomoto, Natsuki Hama (Kobe Institute of Health), Nara Prefectural Institute of Health, Hisahiro Kawai, Atsushi Naka, Hiroshi Nakajima, Hideaki Kariya (Okayama Prefectural Institute for Environmental Science and Public Health), Takahiro Hiratsuka (Health and Environment Center, Hiroshima Prefectural Technology Research Institute), Tatsuaki Aota (Hiroshima City Institute of Public Health), Kagawa Prefectural Research Institute for Environmental Sciences and Public Health, Kitakyushu City Institute of Health and Environmental Sciences, Mari Sasaki (Oita Prefectural Institute of Health and Environment), and Shuji Yoshino (Miyazaki Prefectural Institute for Public Health and Environment).
This work was partially supported by the Research Program on Emerging and Re-emerging Infectious Diseases of the Japan Agency for Medical Research and Development (AMED; grant number JP18fk0108065) and by grants-in-aid from the Ministry of Health, Labour, and Welfare of Japan (H30-Shinkogyosei-Ippan-001 and H30-Shokuhin-Wakate-009).
Footnotes
Supplemental material for this article may be found at https://doi.org/10.1128/AEM.00728-19.
REFERENCES
- 1.Pennington H. 2010. Escherichia coli O157. Lancet 376:1428–1435. doi: 10.1016/S0140-6736(10)60963-4. [DOI] [PubMed] [Google Scholar]
- 2.Hussein HS, Bollinger LM. 2005. Prevalence of Shiga toxin-producing Escherichia coli in beef cattle. J Food Prot 68:2224–2241. doi: 10.4315/0362-028X-68.10.2224. [DOI] [PubMed] [Google Scholar]
- 3.Hussein HS, Sakuma T. 2005. Prevalence of Shiga toxin-producing Escherichia coli in dairy cattle and their products. J Dairy Sci 88:450–465. doi: 10.3168/jds.S0022-0302(05)72706-5. [DOI] [PubMed] [Google Scholar]
- 4.Kobayashi H, Shimada J, Nakazawa M, Morozumi T, Pohjanvirta T, Pelkonen S, Yamamoto K. 2001. Prevalence and characteristics of Shiga toxin-producing Escherichia coli from healthy cattle in Japan. Appl Environ Microbiol 67:484–489. doi: 10.1128/AEM.67.1.484-489.2001. [DOI] [PMC free article] [PubMed] [Google Scholar]
- 5.Lee K, Kusumoto M, Iwata T, Iyoda S, Akiba M. 2017. Nationwide investigation of Shiga toxin-producing Escherichia coli among cattle in Japan revealed the risk factors and potentially virulent subgroups. Epidemiol Infect 145:1557–1566. doi: 10.1017/S0950268817000474. [DOI] [PMC free article] [PubMed] [Google Scholar]
- 6.National Institute of Infectious Diseases. 2018. Enterohemorrhagic Escherichia coli (EHEC) infection, as of March 2018, Japan. Infectious Agents Surveillance Report, vol 39, no. 5. National Institute of Infectious Diseases, Tokyo, Japan: https://www.niid.go.jp/niid/en/iasr-vol39-e/865-iasr/8042-459te.html. [Google Scholar]
- 7.Pei Y, Terajima J, Saito Y, Suzuki R, Takai N, Izumiya H, Morita–Ishihara T, Ohnishi M, Miura M, Iyoda S, Mitobe J, Wang B, Watanabe H. 2008. Molecular characterization of enterohemorrhagic Escherichia coli O157:H7 isolates dispersed across Japan by pulsed-field gel electrophoresis and multiple-locus variable-number tandem repeat analysis. Jpn J Infect Dis 61:58–64. [PubMed] [Google Scholar]
- 8.Swaminathan B, Gerner-Smidt P, Ng L-K, Lukinmaa S, Kam K-M, Rolando S, Gutiérrez EP, Binsztein N. 2006. Building PulseNet International: an interconnected system of laboratory networks to facilitate timely public health recognition and response to foodborne disease outbreaks and emerging foodborne diseases. Foodborne Pathog Dis 3:36–50. doi: 10.1089/fpd.2006.3.36. [DOI] [PubMed] [Google Scholar]
- 9.Izumiya H, Pei YX, Terajima J, Ohnishi M, Hayashi T, Iyoda S, Watanabe H. 2010. New system for multilocus variable-number tandem-repeat analysis of the enterohemorrhagic Escherichia coli strains belonging to three major serogroups: O157, O26, and O111. Microbiol Immunol 54:569–577. doi: 10.1111/j.1348-0421.2010.00252.x. [DOI] [PubMed] [Google Scholar]
- 10.Holmes A, Allison L, Ward M, Dallman TJ, Clark R, Fawkes A, Murphy L, Hanson M. 2015. Utility of whole-genome sequencing of Escherichia coli O157 for outbreak detection and epidemiological surveillance. J Clin Microbiol 53:3565–3573. doi: 10.1128/JCM.01066-15. [DOI] [PMC free article] [PubMed] [Google Scholar]
- 11.Dallman TJ, Byrne L, Ashton PM, Cowley LA, Perry NT, Adak G, Petrovska L, Ellis RJ, Elson R, Underwood A, Green J, Hanage WP, Jenkins C, Grant K, Wain J. 2015. Whole-genome sequencing for national surveillance of Shiga toxin-producing Escherichia coli O157. Clin Infect Dis 61:305–312. doi: 10.1093/cid/civ318. [DOI] [PMC free article] [PubMed] [Google Scholar]
- 12.Joensen KG, Scheutz F, Lund O, Hasman H, Kaas RS, Nielsen EM, Aarestrup FM. 2014. Real–time whole-genome sequencing for routine typing, surveillance, and outbreak detection of Verotoxigenic Escherichia coli. J Clin Microbiol 52:1501–1510. doi: 10.1128/JCM.03617-13. [DOI] [PMC free article] [PubMed] [Google Scholar]
- 13.Inouye M, Dashnow H, Raven LA, Schultz MB, Pope BJ, Tomita T, Zobel J, Holt KE. 2014. SRST2: rapid genomic surveillance for public health and hospital microbiology labs. Genome Med 6:90. doi: 10.1186/s13073-014-0090-6. [DOI] [PMC free article] [PubMed] [Google Scholar]
- 14.Nadon C, Van Walle I, Gerner-Smidt P, Campos J, Chinen I, Concepcion-Acevedo J, Gilpin B, Smith AM, Man Kam K, Perez E, Trees E, Kubota K, Takkinen J, Nielsen EM, Carleton H. 2017. PulseNet International: vision for the implementation of whole genome sequencing (WGS) for global food-borne disease surveillance. Euro Surveill 22:30544. doi: 10.2807/1560-7917.ES.2017.22.23.30544. [DOI] [PMC free article] [PubMed] [Google Scholar]
- 15.LeClerc JE, Li B, Payne WL, Cebula TA. 1996. High mutation frequencies among Escherichia coli and Salmonella pathogens. Science 274:1208–1211. doi: 10.1126/science.274.5290.1208. [DOI] [PubMed] [Google Scholar]
- 16.Alikhan NF, Zhou Z, Sergeant MJ, Achtman M. 2018. A genomic overview of the population structure of Salmonella. PLoS Genet 14:e1007261. doi: 10.1371/journal.pgen.1007261. [DOI] [PMC free article] [PubMed] [Google Scholar]
- 17.Lee K, Morita-Ishihara T, Iyoda S, Ogura Y, Hayashi T, Sekizuka T, Kuroda M, Ohnishi M, EHEC Working Group in Japan. 2017. A geographically widespread outbreak investigation and development of a rapid screening method using whole genome sequences of enterohemorrhagic Escherichia coli O121. Front Microbiol 8:701. doi: 10.3389/fmicb.2017.00701. [DOI] [PMC free article] [PubMed] [Google Scholar]
- 18.Manning SD, Motiwala AS, Springman AC, Qi W, Lacher DW, Ouellette LM, Mladonicky JM, Somsel P, Rudrik JT, Dietrich SE, Zhang W, Swaminathan B, Alland D, Whittam TS. 2008. Variation in virulence among clades of Escherichia coli O157:H7 associated with disease outbreaks. Proc Natl Acad Sci U S A 105:4868–4873. doi: 10.1073/pnas.0710834105. [DOI] [PMC free article] [PubMed] [Google Scholar]
- 19.Iyoda S, Manning SD, Seto K, Kimata K, Isobe J, Etoh Y, Ichihara S, Migita Y, Ogata K, Honda M, Kubota T, Kawano K, Matsumoto K, Kudaka J, Asai N, Yabata J, Tominaga K, Terajima J, Morita-Ishihara T, Izumiya H, Ogura Y, Saitoh T, Iguchi A, Kobayashi H, Hara-Kudo Y, Ohnishi M, Arai R, Kawase M, Asano Y, Asoshima N, Chiba K, Furukawa I, Kuroki T, Hamada M, Harada S, Hatakeyama T, Hirochi T, Sakamoto Y, Hiroi M, Takashi K, Horikawa K, Iwabuchi K, Kameyama M, Kasahara H, Kawanishi S, Kikuchi K, Ueno H, Kitahashi T, Kojima Y, Konishi N, et al. 2014. Phylogenetic clades 6 and 8 of enterohemorrhagic Escherichia coli O157:H7 with particular stx subtypes are more frequently found in isolates from hemolytic uremic syndrome patients than from asymptomatic carriers. Open Forum Infect Dis 1:ofu061. doi: 10.1093/ofid/ofu061. [DOI] [PMC free article] [PubMed] [Google Scholar]
- 20.Bletz S, Bielaszewska M, Leopold SR, Kock R, Witten A, Schuldes J, Zhang W, Karch H, Mellmann A. 2013. Evolution of enterohemorrhagic Escherichia coli O26 based on single-nucleotide polymorphisms. Genome Biol Evol 5:1807–1816. doi: 10.1093/gbe/evt136. [DOI] [PMC free article] [PubMed] [Google Scholar]
- 21.Ishijima N, Lee K, Kuwahara T, Nakayama-Imaohji H, Yoneda S, Iguchi A, Ogura Y, Hayashi T, Ohnishi M, Iyoda S. 2017. Identification of a new virulent clade in enterohemorrhagic Escherichia coli O26:H11/H− sequence type 29. Sci Rep 7:43136. doi: 10.1038/srep43136. [DOI] [PMC free article] [PubMed] [Google Scholar]
- 22.Ogura Y, Gotoh Y, Itoh T, Sato MP, Seto K, Yoshino S, Isobe J, Etoh Y, Kurogi M, Kimata K, Maeda E, Pierard D, Kusumoto M, Akiba M, Tominaga K, Kirino Y, Kato Y, Shirahige K, Ooka T, Ishijima N, Lee K, Iyoda S, Mainil JG, Hayashi T. 2017. Population structure of Escherichia coli O26: H11 with recent and repeated stx2 acquisition in multiple lineages. Microb Genom 3:e000141. doi: 10.1099/mgen.0.000141. [DOI] [PMC free article] [PubMed] [Google Scholar]
- 23.Rossen JWA, Friedrich AW, Moran-Gilad J. 2018. Practical issues in implementing whole-genome-sequencing in routine diagnostic microbiology. Clin Microbiol Infect 24:355–360. doi: 10.1016/j.cmi.2017.11.001. [DOI] [PubMed] [Google Scholar]
- 24.Noller AC, McEllistrem MC, Shutt KA, Harrison LH. 2006. Locus-specific mutational events in a multilocus variable-number tandem repeat analysis of Escherichia coli O157:H7. J Clin Microbiol 44:374–377. doi: 10.1128/JCM.44.2.374-377.2006. [DOI] [PMC free article] [PubMed] [Google Scholar]
- 25.Modrich P. 1991. Mechanisms and biological effects of mismatch repair. Annu Rev Genet 25:229–253. doi: 10.1146/annurev.ge.25.120191.001305. [DOI] [PubMed] [Google Scholar]
- 26.Gong J, Liu WQ, Liu GR, Chen F, Li JQ, Xu GM, Wang L, Johnston RN, Eisenstark A, Liu SL. 2007. Spontaneous conversion between mutL and 6 bpΔmutL in Salmonella typhimurium LT7: association with genome diversification and possible roles in bacterial adaptation. Genomics 90:542–549. doi: 10.1016/j.ygeno.2007.06.009. [DOI] [PubMed] [Google Scholar]
- 27.Vogler AJ, Keys C, Nemoto Y, Colman RE, Jay Z, Keim P. 2006. Effect of repeat copy number on variable-number tandem repeat mutations in Escherichia coli O157:H7. J Bacteriol 188:4253–4263. doi: 10.1128/JB.00001-06. [DOI] [PMC free article] [PubMed] [Google Scholar]
- 28.Faure D, Frederick R, Włoch D, Portier P, Blot M, Adams J. 2004. Genomic changes arising in long-term stab cultures of Escherichia coli. J Bacteriol 186:6437–6442. doi: 10.1128/JB.186.19.6437-6442.2004. [DOI] [PMC free article] [PubMed] [Google Scholar]
- 29.Cody AJ, Bray JE, Jolley KA, McCarthy ND, Maiden M. 2017. Core genome multilocus sequence typing scheme for stable, comparative analyses of Campylobacter jejuni and C. coli human disease isolates. J Clin Microbiol 55:2086–2097. doi: 10.1128/JCM.00080-17. [DOI] [PMC free article] [PubMed] [Google Scholar]
- 30.de Been M, Pinholt M, Top J, Bletz S, Mellmann A, van Schaik W, Brouwer E, Rogers M, Kraat Y, Bonten M, Corander J, Westh H, Harmsen D, Willems RJ. 2015. Core genome multilocus sequence typing scheme for high- resolution typing of Enterococcus faecium. J Clin Microbiol 53:3788–3797. doi: 10.1128/JCM.01946-15. [DOI] [PMC free article] [PubMed] [Google Scholar]
- 31.Mellmann A, Bletz S, Boking T, Kipp F, Becker K, Schultes A, Prior K, Harmsen D. 2016. Real-time genome sequencing of resistant bacteria provides precision infection control in an institutional setting. J Clin Microbiol 54:2874–2881. doi: 10.1128/JCM.00790-16. [DOI] [PMC free article] [PubMed] [Google Scholar]
- 32.Pearce ME, Alikhan NF, Dallman TJ, Zhou Z, Grant K, Maiden M. 2018. Comparative analysis of core genome MLST and SNP typing within a European Salmonella serovar Enteritidis outbreak. Int J Food Microbiol 274:1–11. doi: 10.1016/j.ijfoodmicro.2018.02.023. [DOI] [PMC free article] [PubMed] [Google Scholar]
- 33.Kwong JC, Mercoulia K, Tomita T, Easton M, Li HY, Bulach DM, Stinear TP, Seemann T, Howden BP. 2016. Prospective whole-genome sequencing enhances national surveillance of Listeria monocytogenes. J Clin Microbiol 54:333–342. doi: 10.1128/JCM.02344-15. [DOI] [PMC free article] [PubMed] [Google Scholar]
- 34.Bankevich A, Nurk S, Antipov D, Gurevich AA, Dvorkin M, Kulikov AS, Lesin VM, Nikolenko SI, Pham S, Prjibelski AD, Pyshkin AV, Sirotkin AV, Vyahhi N, Tesler G, Alekseyev MA, Pevzner PA. 2012. SPAdes: a new genome assembly algorithm and its applications to single-cell sequencing. J Comput Biol 19:455–477. doi: 10.1089/cmb.2012.0021. [DOI] [PMC free article] [PubMed] [Google Scholar]
- 35.Clermont O, Christenson JK, Denamur E, Gordon DM. 2013. The Clermont Escherichia coli phylo-typing method revisited: improvement of specificity and detection of new phylo-groups. Environ Microbiol Rep 5:58–65. doi: 10.1111/1758-2229.12019. [DOI] [PubMed] [Google Scholar]
- 36.Joshi NA, Fass JN. 2011. Sickle: a sliding-window, adaptive, quality-based trimming tool for FastQ files. https://github.com/najoshi/sickle.
- 37.Li H, Durbin R. 2010. Fast and accurate long-read alignment with Burrows-Wheeler transform. Bioinformatics 26:589–595. doi: 10.1093/bioinformatics/btp698. [DOI] [PMC free article] [PubMed] [Google Scholar]
- 38.Li H. 2011. A statistical framework for SNP calling, mutation discovery, association mapping and population genetical parameter estimation from sequencing data. Bioinformatics 27:2987–2993. doi: 10.1093/bioinformatics/btr509. [DOI] [PMC free article] [PubMed] [Google Scholar]
- 39.Koboldt DC, Zhang Q, Larson DE, Shen D, McLellan MD, Lin L, Miller CA, Mardis ER, Ding L, Wilson RK. 2012. VarScan 2: somatic mutation and copy number alteration discovery in cancer by exome sequencing. Genome Res 22:568–576. doi: 10.1101/gr.129684.111. [DOI] [PMC free article] [PubMed] [Google Scholar]
- 40.Kurtz S, Phillippy A, Delcher AL, Smoot M, Shumway M, Antonescu C, Salzberg SL. 2004. Versatile and open software for comparing large genomes. Genome Biol 5:R12. doi: 10.1186/gb-2004-5-2-r12. [DOI] [PMC free article] [PubMed] [Google Scholar]
- 41.Ogura Y, Mondal SI, Islam MR, Mako T, Arisawa K, Katsura K, Ooka T, Gotoh Y, Murase K, Ohnishi M, Hayashi T. 2015. The Shiga toxin 2 production level in enterohemorrhagic Escherichia coli O157:H7 is correlated with the subtypes of toxin-encoding phage. Sci Rep 5:16663. doi: 10.1038/srep16663. [DOI] [PMC free article] [PubMed] [Google Scholar]
- 42.Stamatakis A. 2014. RAxML version 8: a tool for phylogenetic analysis and post-analysis of large phylogenies. Bioinformatics 30:1312–1313. doi: 10.1093/bioinformatics/btu033. [DOI] [PMC free article] [PubMed] [Google Scholar]
- 43.Kumar S, Stecher G, Tamura K. 2016. MEGA7: molecular evolutionary genetics analysis version 7.0 for bigger datasets. Mol Biol Evol 33:1870. doi: 10.1093/molbev/msw054. [DOI] [PMC free article] [PubMed] [Google Scholar]
- 44.R Core Team. 2018. R: a language and environment for statistical computing. R Foundation for Statistical Computing, Vienna, Austria: http://www.R-project.org. [Google Scholar]
Associated Data
This section collects any data citations, data availability statements, or supplementary materials included in this article.
Supplementary Materials
Data Availability Statement
The FASTQ sequences and assembled contigs used in this study were deposited in the DNA Data Bank of Japan (http://www.ddbj.nig.ac.jp) under SRA accession number DRA007301.