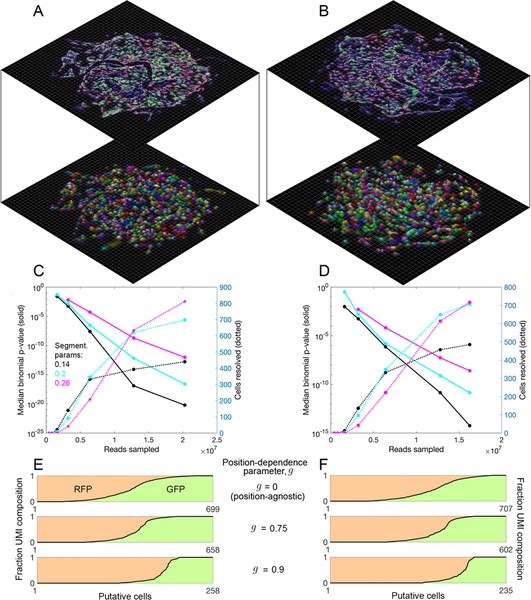
Figure 6. Segmentation of DNA microscopy data recovers cells de novo.
(A,B) Data segmentation recovers putative cells without a priori knowledge. Cell segmentation for samples 1 (A) and 2 (B) by recursive graph-cutting of the UEI matrix is shown with a random color assigned to each inferred cell, qualifying if it contained at least 50 UMIs and had at least one transcript each of ACTB and GAPDH. The minimum conductance threshold was set to 0.2. Surface height and color opacity scale with likelihood density, normalized to the maximum value within each putative cell. (C,D) Segmentation performance. The effects of cell segmentation for samples 1 (C) and 2 (D) with minimum conductance thresholds 0.14 (black), 0.2 (cyan), and 0.26 (magenta) are shown on binomial p-values quantifying segmentation fidelity (solid lines) and putative cell count (dotted lines). (E,F) Inclusion of position information from sMLE inferences improves performance. Shown is the separation of fluorescent protein transgenes among decreasing numbers of identifiable cells for samples 1 (E) and 2 (F), with GFP UMI fraction and RFP UMI fraction shown in green and red shades, respectively.

