Abstract
Large panels of comprehensively characterized human cancer models, including the Cancer Cell Line Encyclopedia (CCLE), have provided a rigorous backbone upon which to study genetic variants, candidate targets, small molecule and biological therapeutics and to identify new marker-driven cancer dependencies. To improve our understanding of the molecular features that contribute to cancer phenotypes including drug responses, here we have expanded the characterizations of cancer cell lines to include genetic, RNA splicing, DNA methylation, histone H3 modification, microRNA expression and reverse-phase protein array data for 1,072 cell lines from various lineages and ethnicities. Integrating these data with functional characterizations such as drug-sensitivity data, short hairpin RNA knockdown and CRISPR–Cas9 knockout data reveals potential targets for cancer drugs and associated biomarkers. Together, this dataset and an accompanying public data portal provide a resource to accelerate cancer research using model cancer cell lines.
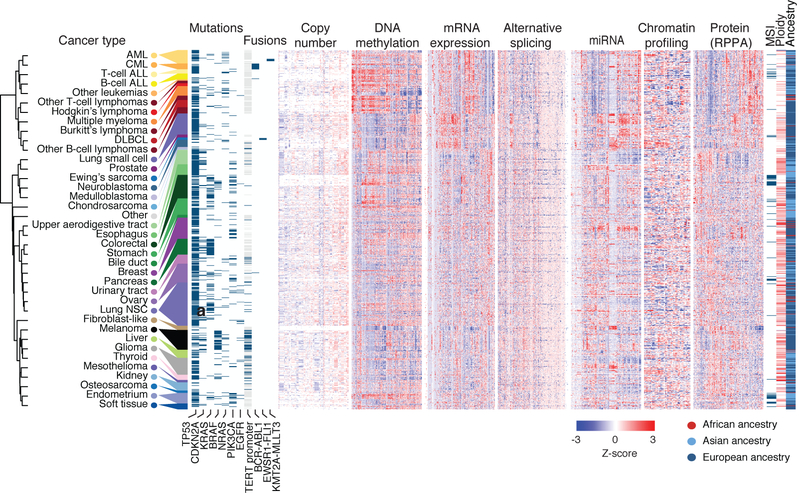
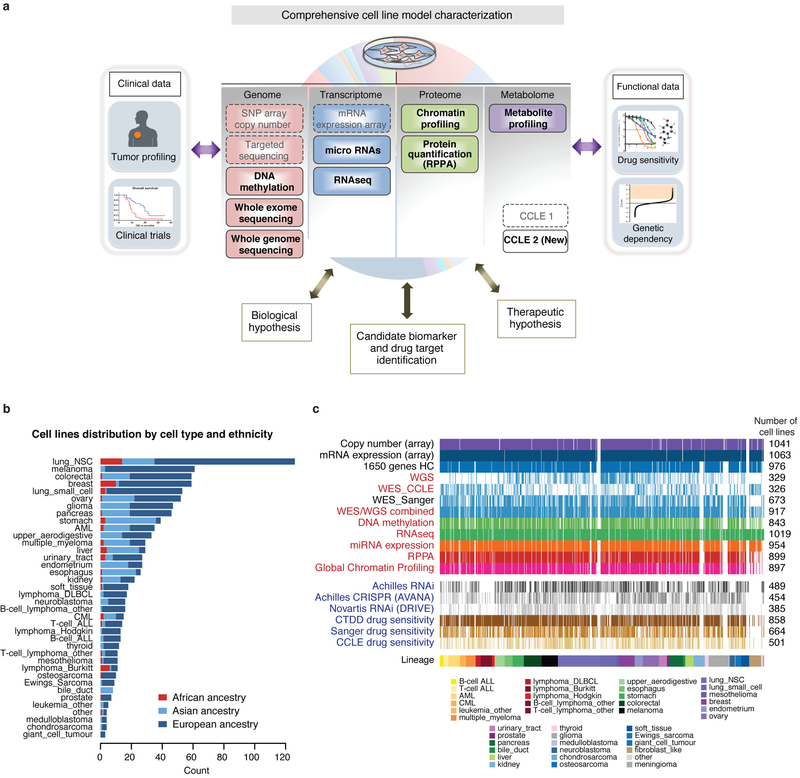
To understand the molecular dysregulations that can maintain cancer cell growth and determine response to therapeutic intervention we have continued to characterize the CCLE cell lines beyond the initial expression and genetic data1 (Fig. 1, Extended Data Fig. 1a–c, Supplementary Table 1, Methods). To this end, we performed RNA sequencing (RNA-seq; 1,019 cell lines), whole-exome sequencing (WES; 326 cell lines), whole-genome sequencing (WGS; 329 cell lines), reverse-phase protein array (RPPA; 899 cell lines), reduced representation bisulfite sequencing (RRBS; 843 cell lines), microRNA expression profiling (954 cell lines) and global histone modification profiling (897 cell lines) for CCLE cell lines. In parallel work, we also report the abundance measures of 225 metabolites for 928 cell lines2.
Fig. 1. Overview of the datasets.
Representative heat maps from the CCLE datasets (n = 749). Cell lines grouped by cancer type; cancer types ordered by an unsupervised hierarchical clustering of mean values of each cancer type. From each dataset, a representative subset is shown, including mutation and fusion status in the top recurrently mutated genes and TERT promoter mutation, columns were randomly selected from CCLE copy number, DNA methylation, mRNA expression, exon inclusion, miRNA, protein array and global chromatin profiling datasets. Inferred-MSI status, inferred-ploidy and inferred-ancestries are shown. Unknown TERT promoter status is shown in light grey. AML, acute myeloid leukaemia; CML, chronic myelogenous leukaemia; ALL, acute lymphoid leukaemia; DLBCL, diffuse large B-cell lymphoma; NSC, non-small cell.
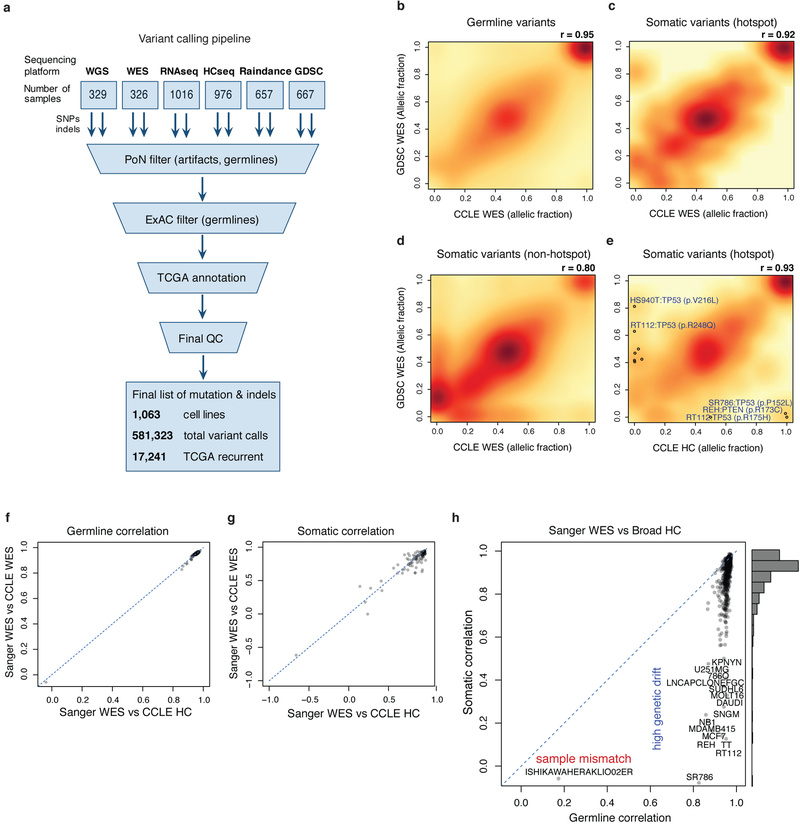
Genetic characterization of the CCLE previously included sequencing of 1,650 genes and single nucleotide polymorphism (SNP) array copy number profiles in 947 cell lines. To enhance this characterization, a harmonized variant calling pipeline was used to integrate WES (326 cell lines), WGS (329 cell lines), deep RNA sequencing (1,019 cell lines), RainDance-based targeted sequencing (657 cell lines) and Sanger Genomics of Drug Sensitivity in Cancer (GDSC) WES data (1,001 cell lines, 667 overlapping)3 (Extended Data Fig. 2a, Supplementary Table 2, Methods). Comparison of germline variant calls between CCLE and GDSC data revealed a high concordance (Pearson’s correlation r = 0.95 for allelic fractions; Extended Data Fig. 2b, Methods). Comparing data for individual cell lines, three (0.4%) overlapping lines had mismatching germline variant calls, suggestive of mislabelling. Mutation correlation was high (r = 0.92) for cancer hotspot somatic variants, but lower (r = 0.8) across non-hotspot somatic variants, suggesting that genetic drift in distinctly passaged cell lines mainly affects passenger mutations (Extended Data Fig. 2c–e). We also identified 3–10% of cell lines (correlation cut-off of 0.60 or 0.75) with substantial differences in somatic variants, suggestive of major genetic drift (Extended Data Fig. 2f–h, Methods, Supplementary Table 3). In these lines, experimental reproducibility may be sensitive to genetic divergence after passage-induced bottlenecks4. We merged mutation calls for the remaining cell lines to provide a refined genetic profile for each cell line.
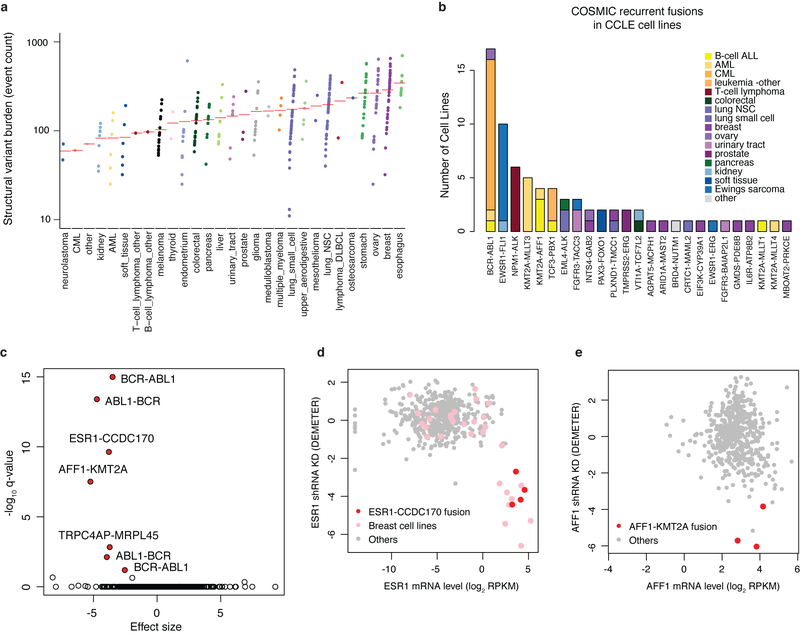
In addition, using the WGS and RNA-seq data, we now include structural variant (329 cell lines) and gene-fusion event annotations (1,019 cell lines) (Extended Data Fig. 3a, b). Project Achilles and DRIVE short hairpin RNA (shRNA) and single guide RNA (sgRNA) gene dependency datasets (Extended Data Fig. 1c) allow one to compare genetic events with cancer dependencies defined by loss of growth after gene knockdown and knockout respectively5–7. Comparing fusion calls with RNA interference (RNAi) loss-of-function data, we identified the ESR1-CCDC170 and AFF1-KMT2A fusions as driver events that lead to dependence on ESR1 and AFF1, respectively (Extended Data Fig. 3c–e, Methods, Supplementary Table 4). With WGS and targeted sequencing of 503 cell lines, we also assessed for TERT promoter mutations and found these in 16.7% (84 out of 503), making it the most common non-coding somatic mutation in cancer cell lines8 (Fig. 1, Supplementary Table 5).
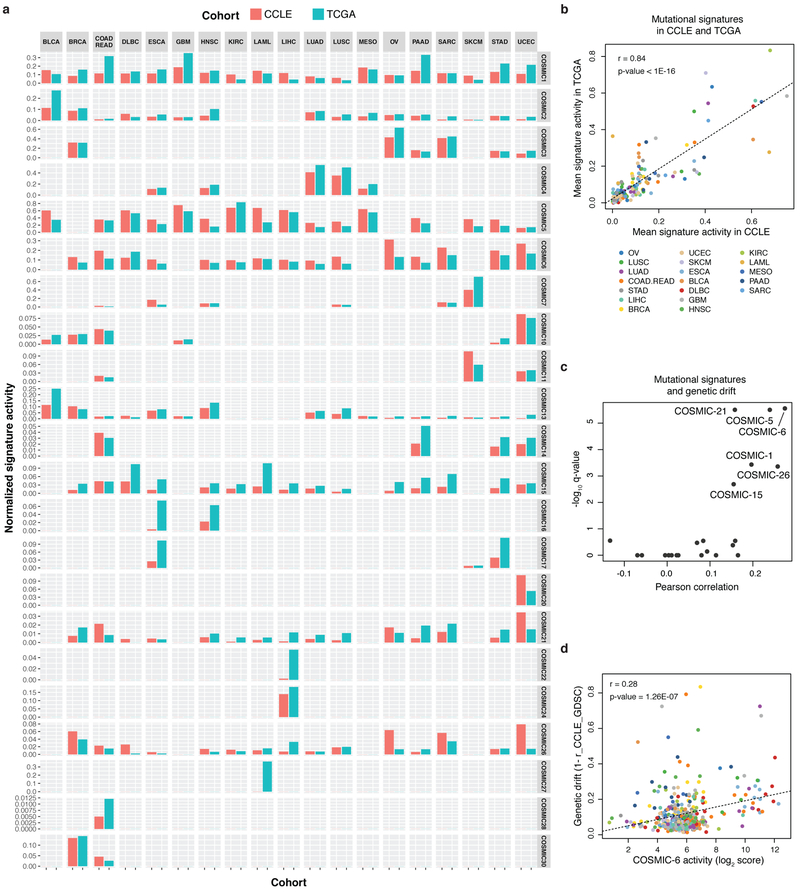
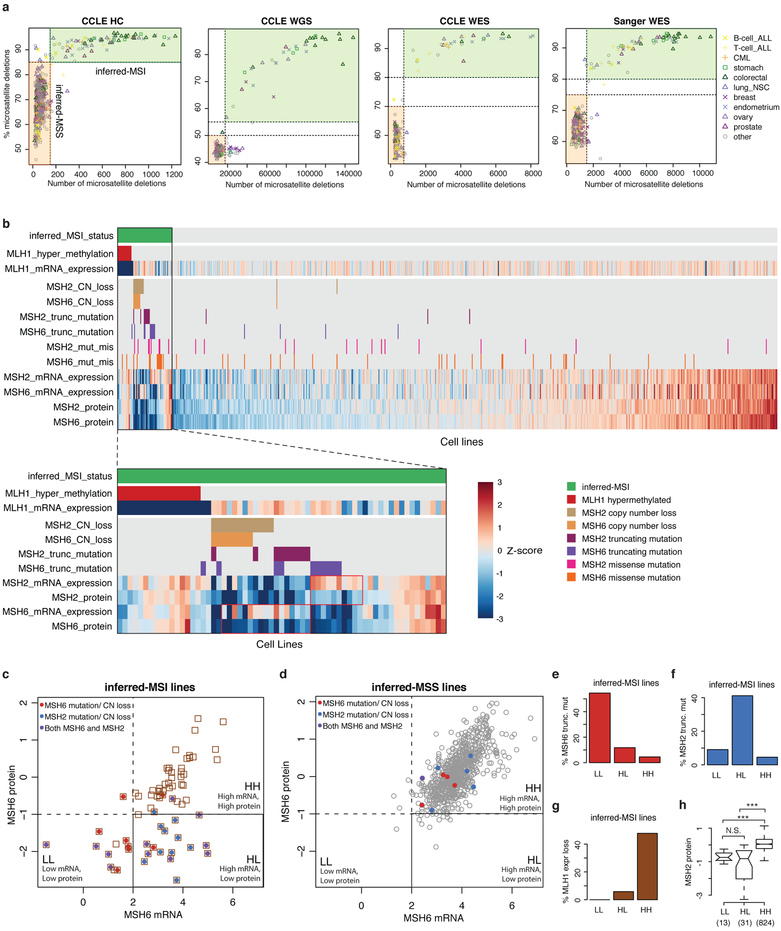
Patterns of somatic mutation indicative of underlying mutational processes are of considerable interest. Hence, we annotated the CCLE using 30 COSMIC mutational signatures (Extended Data Fig. 4a, Supplementary Table 6, Methods) and observed considerable correlation between signature activities in CCLE and The Cancer Genome Atlas (TCGA) cancer types (Extended Data Fig. 4b). Notably, we observed higher genetic drift in cell lines with COSMIC 6, 21, 26 and 15 signatures related to microsatellite instability (MSI) and COSMIC 5 and 1 signatures related to clock-like mutational processes4 (Extended Data Fig. 4c, d). In addition, we inferred MSI status of CCLE cell lines by measuring the number of short deletions in microsatellite regions (Extended Data Fig. 5a, Supplementary Table 7, Methods). Using this annotation, we investigated the causative alterations in mismatch repair genes in the CCLE. Among 65 inferred-MSI cell lines, we found MLH1 hypermethylation in 17 cell lines and genomic alterations in MSH2 and MSH6 in 38 cell lines (Extended Data Fig. 5b). In the joint analysis of the RPPA and RNA-seq data, we observed discordance between mRNA levels and RPPA protein expression levels of MSH6 in 16 inferred-MSI cell lines (Extended Data Fig. 5b–d). These cell lines were enriched for truncating mutations in MSH2 (Extended Data Fig. 5e–h). These data suggest that mutation and loss of the MSH2 protein results in concordant loss of MSH6 protein9,10.
Genome-wide DNA promoter methylation
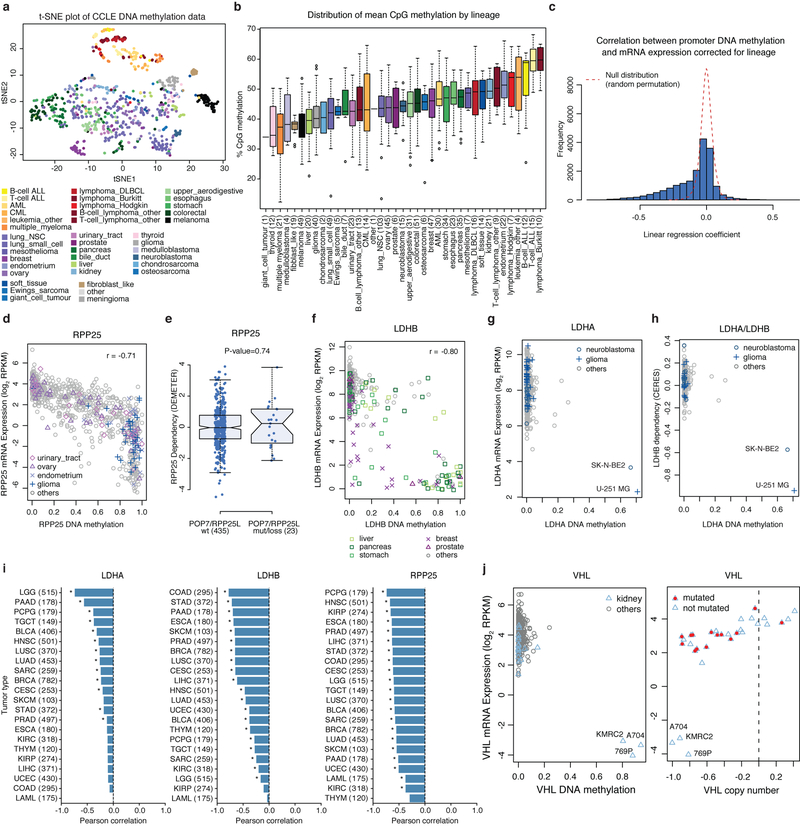
To address the role of DNA methylation on mRNA expression and consequent changes in gene dependence, RRBS analysis was used to assess promoter methylation. Previously microarray-based methylation data for a subset of the CCLE cell lines was reported (n = 655 overlapping cell lines)3. RRBS yielded robust coverage of 17,182 gene promoter regions in 843 cell lines (Methods). Unsupervised clustering of cell lines using methylation data showed lineage-based clustering (Extended Data Fig. 6a, b). As predicted, we observed significant negative correlation between mRNA gene expression and promoter methylation for many genes (Extended Data Fig. 6c).
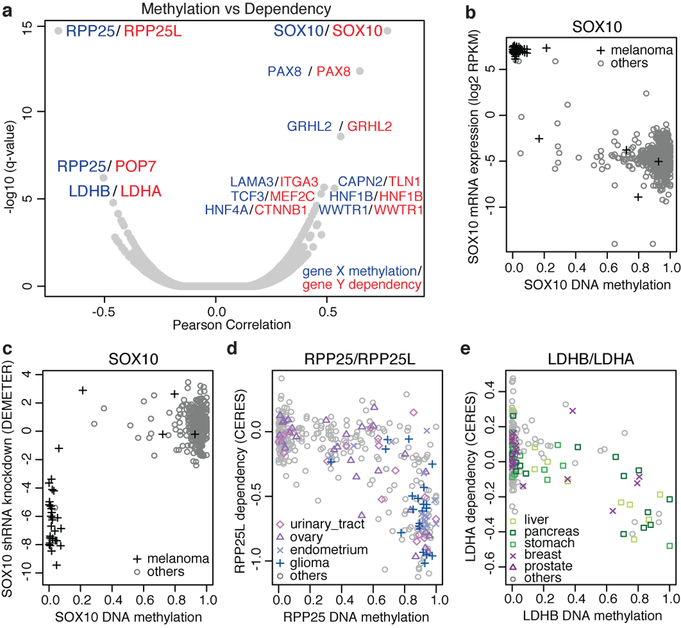
To ascertain whether DNA methylation results in specific gene dependencies, we correlated promoter methylation with gene level dependence data from the sgRNA and shRNA datasets5–7 (Fig. 2a, Supplementary Table 8, Methods). Consistent with lineage determination of methylation patterns, promoter hypomethylation of key lineage transcription factors including SOX10, PAX8, HNF1B and HNF4A was correlated with specific gene dependence. For example, mRNA expression and promoter hypomethylation of the melanocyte transcription factor SOX10 are restricted to melanoma lines (Fig. 2b) and are strongly linked to sensitivity to SOX10 knockdown (Fig. 2c). Nearly all other cell lines lack SOX10 expression and are independent of SOX10 for growth.
Fig. 2. DNA methylation and cancer dependence.
a, Global correlation between DNA methylation and gene dependency of the same gene or associated genes (StringDB). Top pairs (q < 5 × 10⁻⁵) are labelled (n = 45–380; Supplementary Table 8). b, c, Hypomethylation of SOX10 in melanoma cell lines is associated with SOX10 mRNA expression (Pearson’s r = −0.82, n = 824, P < 2.2 × 10⁻¹⁶) (b) and sensitivity to SOX10 knockdown (Pearson’s r = 0.79, n = 376, P < 2.2 × 10⁻¹⁶) (c). RPKM, reads per kilobase of transcript per million mapped reads. d, Promoter hypermethylation of RPP25 is a marker for vulnerability to RPP25L knockout (Pearson’s r = −0.71, n = 369, P < 2.2 × 10⁻¹⁶). e, LDHB methylation confers sensitization to LDHA knockout (Pearson’s r = −0.52, n = 362, P < 2.2 × 10⁻¹⁶).
We also observed promoter hypermethylations associated with synthetic lethal interactions including RPP25 promoter methylation and RPP25L dependence, and LDHB promoter methylation and LDHA dependence (Fig. 2a). RPP25 promoter methylation was negatively correlated with RPP25 expression in bladder, ovary, endometrium and glioma lineages (Extended Data Fig. 6d), and led to dependence on the paralogue RPP25L (Fig. 2d). Notably, silencing of RPP25 was also correlated with sensitivity to POP7 knockout but not the inverse (Fig. 2a, Extended Data Fig. 6e). Both RPP25 and POP7 are components of ribonuclease P (RNase P) and RNase for mitochondrial RNA processing (MRP) complexes11,12. These data suggest that methylation of RPP25 leads to increased dependency on components of the tRNA and rRNA processing pathways.
LDHA and LDHB mediate the bidirectional conversion of pyruvate and lactate. Here we identify LDHA and LDHB as a paralogue dependency in which methylation of the LDHB promoter is indicative of vulnerability to LDHA knockout, and conversely methylation of the LDHA promoter is a marker of LDHB dependency (Fig. 2e, Extended Data Fig. 6f–h). These genes are commonly methylated in primary tumours (Extended Data Fig. 6i). Hence, investigations into targeting lactate dehydrogenase (LDH) in cancer may need to examine the role of paralogue methylation as a determining factor13.
Promoter methylation also contributes to gene inactivation in parallel to or in combination with genetic mutation. For example, methylation of the tumour suppressor VHL was restricted to three renal clear cell cancer cell lines and was associated with loss of VHL mRNA (Extended Data Fig. 6j). Although in most renal clear cell lines VHL is inactivated by DNA copy number loss and somatic mutations, in these three lines one copy of VHL is deleted and the other is methylated. Hence, integrating methylation data allows for a more complete annotation of the VHL-null genotype in renal clear cell lines14.
Profiling histone tail modifications
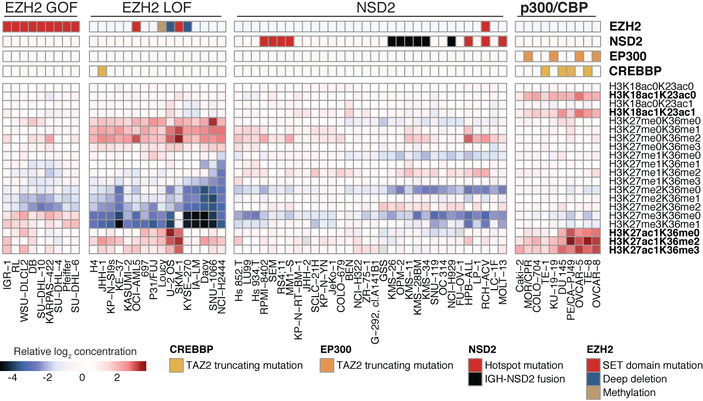
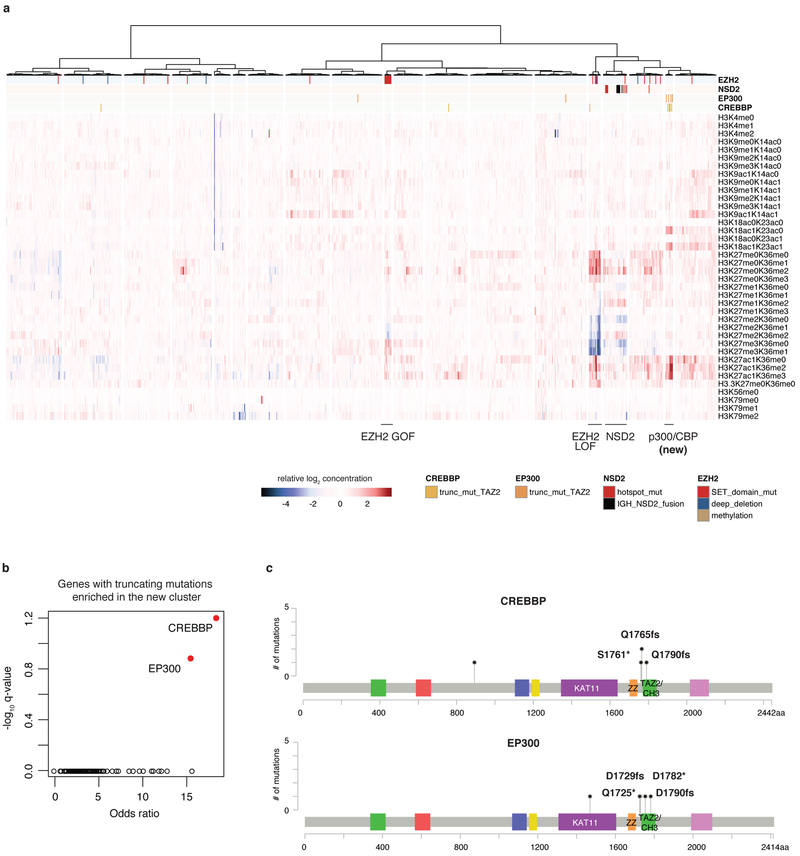
To investigate chromatin dysregulation, global chromatin profiling using multiple reaction monitoring for 42 combinations of histone marks was performed for 897 cell lines, adding 782 cell lines to our previous report15,16 (Methods). These data consist of quantified abundance for each of 42 modified and unmodified histone H3 tail peptides. Unsupervised analysis identified clusters enriched for mutations in chromatin-associated genes EZH2 and NSD2 as previously described (Fig. 3, Extended Data Fig. 7a). In these clusters, additional cell lines that have a similar pattern of histone modification are seen, indicating as yet unidentified mechanisms for achieving these modifications. We also identified a new cluster associated with marked increases in H3K18 and H3K27 acetylation. This cluster is enriched for EP300 and CREBBP mutations predicted to truncate p300 and CBP, respectively, in the CH3 domain after the histone acetyltransferase domain (Extended Data Fig. 7b, c). These data suggest that truncation of p300 and CBP leads to increased substrate acetylation and these alterations may represent the first cancer-associated gain-of-function mutations for p300 and CBP.
Fig. 3. Global chromatin profiling reveals activating mutations in p300 and CBP.
A selected subset of the CCLE global chromatin profiling dataset showing H3K18 and H3K27 modifications in four clusters is shown from the unsupervised clustering of 897 cell lines. Each column represents a cell line, and each row a specific set of chromatin post-translational modifications (‘marks’). For each mark, the fold change relative to the median of cell lines is depicted. The new p300 and CBP cluster with acetylation marks are shown in bold. GOF, gain of function; LOF, loss of function.
Alternative splicing characterization
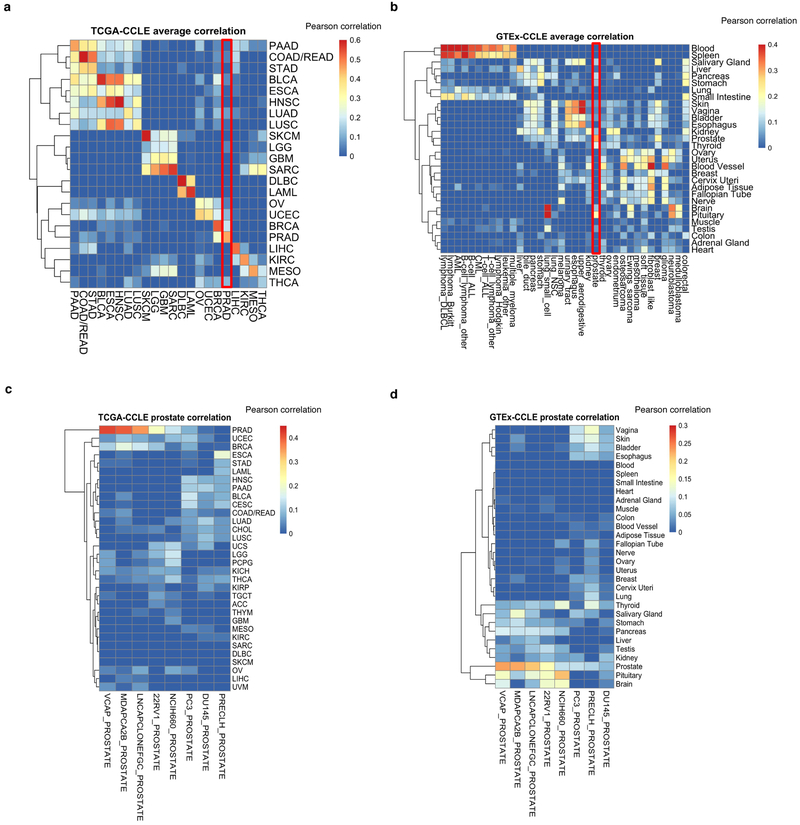
To enhance mRNA characterization in the CCLE further, we profiled the cell lines using deep RNA-seq. With this more complete CCLE RNA-seq dataset, we found overall good agreement of transcriptional profiles of CCLE lines with those of primary tumours of the TCGA and normal tissues of the Genotype-Tissue Expression (GTEx) projects (Extended Data Fig. 8a–d, Supplementary Table 9).
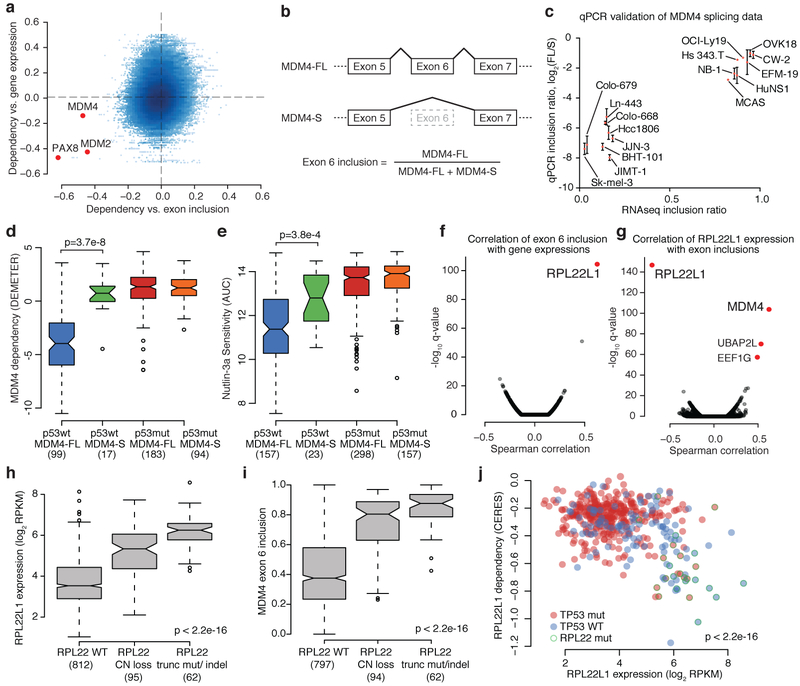
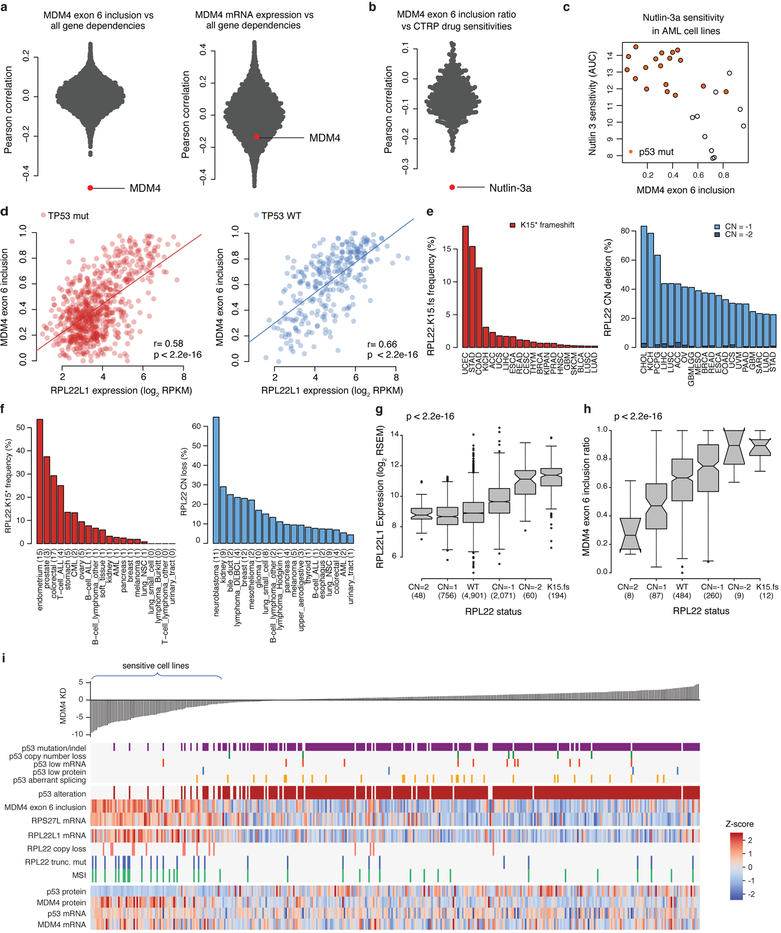
The role of alternative splicing in cancer is highlighted by the high frequency of mutations in splicing machinery components17. To investigate this further, we annotated alternative splicing across the CCLE and interrogated the association of splicing events with gene dependencies (Fig. 4a, Supplementary Table 10, Methods). The top three genes with strong correlations between alternative splicing and gene dependencies were PAX8, MDM2 and MDM4. Although PAX8 and MDM2 gene dependencies were also correlated with their total mRNA expressions, MDM4 dependency was only correlated with a specific MDM4 isoform (Fig. 4a, Extended Data Fig. 9a). Alternative MDM4 splicing generates a full-length isoform (MDM4-FL) that retains exon 6, and a shorter isoform (MDM4-S) that skips exon 6 and leads to a premature stop codon18,19 (Fig. 4b). MDM4 negatively regulates TP53 and MDM4-FL has been proposed to be the functional isoform20,21. We validated the RNA-seq data for MDM4 exon 6 inclusion by quantitative reverse transcription PCR (RT-qPCR) (Fig. 4c, Supplementary Table 11, Methods). As function of MDM4 requires wild-type TP53, we asked whether MDM4 splicing was predictive of MDM4 dependence or sensitivity to MDM2 inhibitors among wild-type TP53 cells. We found that MDM4 dependence was abrogated in cells with low expression of MDM4-FL (Fig. 4d), and the MDM2 inhibitor nutlin-3a was the inhibitor most strongly correlated with MDM4-FL (exon 6 inclusion) (Fig. 4e, Extended Data Fig. 9b, c, Supplementary Table 12, Methods). In these cases, the specific ascertainment of exon 6 inclusion or exclusion outperforms total MDM4 mRNA measurements.
Fig. 4. MDM4 exon 6 inclusion is associated with MDM4 dependency and RPL22 or RPL22L1 status.
a, Scatterplot of correlation of gene dependency and exon inclusion (x axis) and correlation of gene dependency and gene expression (y axis) (n = 243,288 exons, 200–478 common cell lines; Supplementary Table 10; highlighted genes: |r_exon_inclusion| > 0.4). b, Alternative splicing generates two major MDM4 isoforms—full-length MDM4 (MDM4-FL) includes exon 6, whereas short MDM4 (MDM4-S) skips this exon. c, Validation of MDM4 exon 6 inclusion in a subset of CCLE cell lines (n = 16) using quantitative PCR (qPCR). Data are mean and s.d. of the log2(MDM4-FL/MDM4-S) ratio relative to the TOV21G standard cell line calculated across three technical replicates. d, e, Sensitivity of cell lines to MDM4 knockdown (DEMETER dependency scores) (d) and treatment with nutlin-3a (Cancer Therapeutics Response Portal (CTRP) area under the dose–response curve (AUC) scores) (e) by p53 mutational status (WT, wild type; mut, mutated) and the MDM4 splicing categories MDM4-S (MDM4 exon 6 inclusion ratio < 0.25) and MDM4-FL (inclusion ratio > 0.35). Numbers in parentheses denote the number of cell lines in each category. Box plots depict median (centre line), interquartile range (box), smaller of 1.5 times the interquartile range from the box, the minimum–maximum range (whiskers), and outliers (circles). f, Correlation of MDM4 exon 6 inclusion with gene expression (n = 1,003 cell lines). g, Correlation of RPL22L1 expression with exon-inclusion ratios (n = 200–1,019; Supplementary Table 10). P values determined by two-sided Spearman’s correlation test. h, i, Higher RPL22L1 expression (h) and MDM4 exon 6 inclusion (i) are associated with RPL22 copy number (CN) loss and RPL22 truncating mutations or indels. Box plots as defined in d. j, Scatterplot of RPL22L1 dependency versus RPL22L1 mRNA expression. Cell lines containing RPL22 truncating mutations and TP53 mutations are shown (n = 447). P values determined by two-sided Wilcoxon rank sum test (d, e, j), two-sided Spearman’s correlation test (f) or two-sided Kruskal–Wallis rank sum test (h, i).
To ascertain possible mechanisms that govern MDM4 splicing, the RNA-seq data were queried for correlates of MDM4 exon 6 inclusion. In this analysis, RPL22L1 was an outlier (Fig. 4f, Extended Data Fig. 9d) and in the reverse query, MDM4 exon 6 inclusion was the top ranked splicing event positively correlated with RPL22L1 expression (Fig. 4g). Therefore, ribosomal protein RPL22L1 is a candidate regulator of MDM4 splicing. We previously identified RPL22L1-RPL22 as a paralogue synthetic lethality pair in which loss of RPL22 leads to dependence on RPL22L16. In cancer, the RPL22.K15fs hotspot frameshift mutations are among the most common mutations in MSI tumours22 and gene deletion of RPL22 is common (Extended Data Fig. 9e, f). We found that approximately 68% (67 out of 99) of inferred-MSI cell lines in the CCLE contain frameshift mutations in that locus. In the CCLE and TCGA datasets, RPL22 loss-of-function mutation or deletion is associated with both higher expression of RPL22L1 and MDM4 exon 6 inclusion (Fig. 4h, i, Extended Data Fig. 9g, h). In the CCLE, we found that high RPL22L1 expression is associated with RPL22L1 dependence (Fig. 4j).
Although RPL22 and RPL22L1 are known to regulate splicing in development23, their roles in cancer are not known. Here we propose that wild-type TP53, MDM4 exon 6 inclusion, and high RPL22L1 expression are genomic features associated with dependency on RPL22L1 and sensitivity to MDM2 and MDM4 inhibitors (Extended Data Fig. 9i). One implication is that MDM4 exon 6 inclusion and RPL22 or RPL22L1 status may be biomarkers for clinical responses to MDM2 inhibitors beyond TP53 mutation.
Characterizing microRNAs across the CCLE
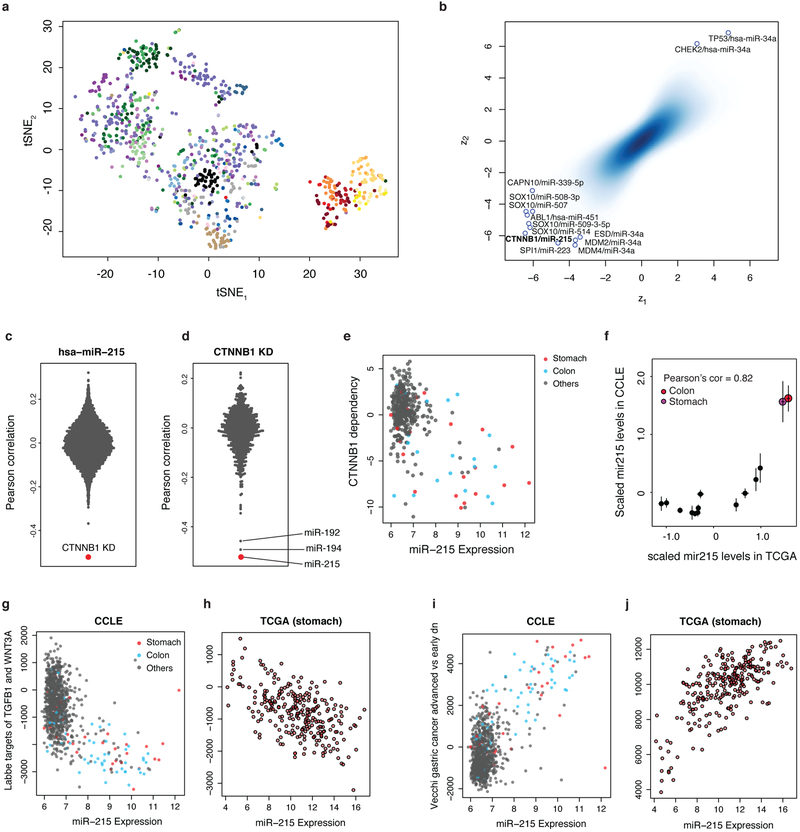
To understand the role of dysregulated microRNA (miRNA) expression in cancer progression, we quantified the expression of 734 miRNAs across the CCLE. Unsupervised analysis resulted in lineage clustering mirroring lineage associations of miRNA expression in normal tissues24 (Extended Data Fig. 10a). To identify miRNAs associated with cancer dependencies, we correlated the miRNA expression data with Achilles gene dependency data (Methods). Here, a notable association between β-catenin (CTNNB1) dependence and mir-215 expression was observed (Extended Data Fig. 10b–d). The relationship between CTNNB1 dependence and mir-215 expression was particularly enriched in stomach and colon lineage cell lines (Extended Data Fig. 10e, Supplementary Table 13, Methods). The increased expression of mir-215 seen in these lineages was also observed in TCGA datasets (Extended Data Fig. 10f). Notably, gene set analysis revealed considerable correlations between mir-215 expression and gene sets related to stages of gastric cancer and the WNT pathway (Extended Data Fig. 10g–j).
Towards proteomic profiling of the CCLE
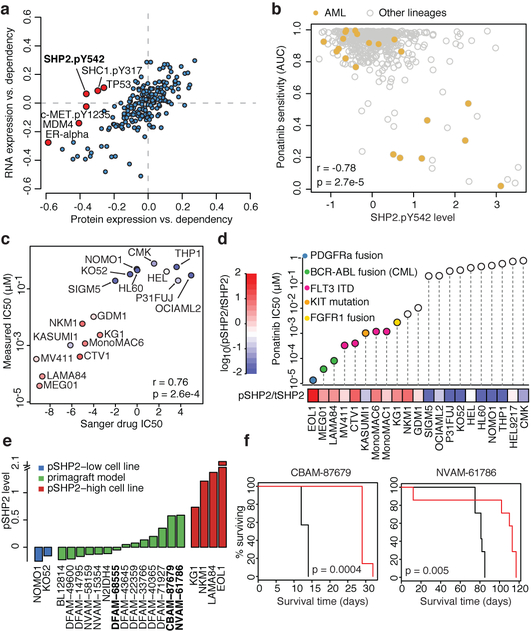
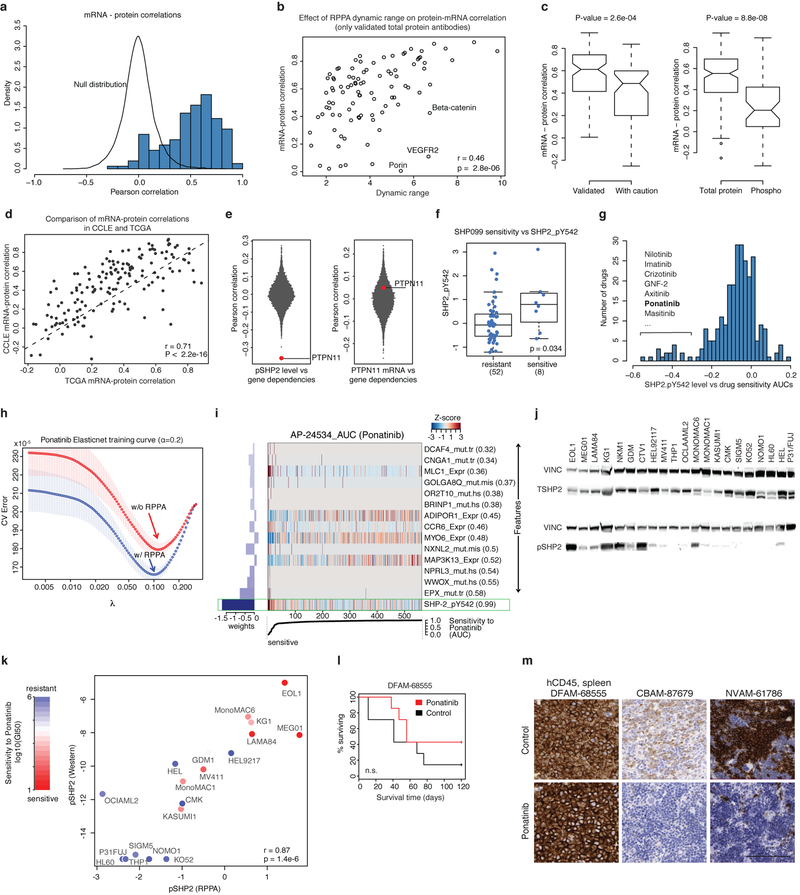
Previous studies have profiled protein expression in a subset of the CCLE cell lines (n = 381 overlapping cell lines)25. To study protein expression more systematically across the CCLE, we generated RPPA data for 213 antibodies across 899 CCLE cell lines (Methods, Supplementary Table 14). We correlated mRNA expression and protein levels to evaluate the RPPA data quality and identify genes with discrepancies between mRNA and protein expression (Extended Data Fig. 11a–d). We then asked whether protein correlates of either gene dependence or drug sensitivities provided additional stratification beyond mRNA levels. In a global analysis that correlated gene dependence with mRNA or RPPA-based protein expression, we found that levels of ER-β and MDM4 proteins and SHC1.pY317, c-Met. pY1235 and SHP2.pY542 phosphoproteins were more strongly correlated with dependency than the respective mRNAs (Fig. 5a). For example, dependency on PTPN11 (which encodes SHP2) is correlated with phosphorylated SHP2 (SHP2.pY542) but not with PTPN11 mRNA (Fig. 5a, Extended Data Fig. 11e). The level of phosphorylated SHP2 (pSHP2) is also higher in cell lines that are sensitive to the SHP2 inhibitor SHP09926 (Extended Data Fig. 11f).
Fig. 5. High pSHP2 is a marker of SHP2 dependence and sensitivity to RTK inhibitors.
a, Global correlations of gene dependency and gene expression (y axis) versus correlation of gene dependency and protein expression. PTPN11 dependency is correlated with pSHP2 expression (Pearson’s r = −0.36, n = 411; P = 4.9 × 10⁻¹⁴) but not with mRNA expression (Pearson’s r = −0.07, n = 478; P = 0.15). b, A subset of AML lines (n = 21) show high pSHP2 expression associated with sensitivity to ponatinib. c, Validation of Sanger GDSC ponatinib sensitivity data in AML (n = 16) and CML (n = 2) cell lines. x axis is sensitivity to ponatinib in the Sanger GDSC dataset; y axis is sensitivity to ponatinib measured by CellTiter-Glo (CTG) cell viability assay. Each dot represents a cell line coloured by pSHP2 over total SHP2 level. IC50, half-maximal inhibitory concentration. d, In vitro validation of association of pSHP2 expression with sensitivity to ponatinib. Cell lines are annotated for known oncogenic events in the RTK pathway. tSHP2, total SHP2. e, pSHP2 levels measured by RPPA in mouse primagraft AML models (n = 14) and control cell lines (n = 6). Three models (bold) were chosen for in vivo validation experiments. f, In vivo mouse xenograft experiment survival curves. Ponatinib treatment prolonged survival in two primagrafts with high pSHP2 levels—CBAM-87679 and NVAM-61786—but not in the low pSHP2 primagraft DFAM-68555 (Extended Data Fig. 11l) (n = 7 mice in each group). P values determined by two-sided Pearson correlation test (a–c) log-rank (Mantle–Cox) test (f).
SHP2 mediates signalling through receptor tyrosine kinases (RTKs) and is phosphorylated in the carboxy terminus at Tyr542 and Tyr580 in response to activation of growth factor receptor. These observations prompted us to look for drug sensitivities that correlate with pSHP2 abundance. Notably, the activities of several tyrosine kinase inhibitors were significantly correlated with pSHP2 levels (Extended Data Fig. 11g). Among these, ponatinib was the top compound for which adding RPPA data significantly improved drug sensitivity prediction (Extended Data Fig. 11h, Methods), and SHP2.pY542 expression was the top predictor for sensitivity to ponatinib (Extended Data Fig. 11i). Ponatinib targets the BCR–ABL fusion protein and is approved for the treatment of patients with chronic myeloid leukaemia (CML), although it has broad RTK activity27. Cell lines from CML, acute myeloid leukaemia (AML), rhabdoid sarcoma, and thyroid lineages that contain specific RTK alterations were sensitive to ponatinib and had high levels of pSHP2 (Fig. 5b). For further validation, we selected the AML cell lines and added five additional AML cell lines not used in the predictive modelling as a test set, and two CML cell lines with the BCR–ABL fusion as positive controls. In these cell lines, both the repeated drug sensitivities and pSHP2 levels were highly consistent with Sanger GDSC drug sensitivity data and RPPA pSHP2 data (Fig. 5c, Extended Data Fig. 11j, k). Moreover, four out of five (CTV1, NKM1, EOL1 and MonoMAC1) of the previously untested cell lines had high pSHP2 levels and were sensitive to ponatinib. The fifth line (HEL9217) had high levels of pSHP2 and total SHP2 but was insensitive to ponatinib. In seven out of nine ponatinib-sensitive AML cell lines, we found alterations in the FLT3, PDGFRA, FGFR1 or KIT genes (Fig. 5d).
We then measured pSHP2 levels by RPPA in 14 AML primagraft models and 6 control cell lines (Fig. 5e) and selected three models for in vivo experiments. Mice injected with primagrafts (CBAM-87679, NVAM-61786) with high levels of pSHP2 and treated with ponatinib had extended survival and reduced tumour cell burden when compared to mice injected with a low pSHP2 primagraft (DFAM-68555) (Fig. 5f, Extended Data Fig. 11l, m). RNA-seq analysis of the two sensitive models revealed a FLT3-ITD fusion in NVAM-61786 and a BCR-ABL fusion in CBAM-87679.
Together, these data suggest that pSHP2 is a marker for sensitivity to ponatinib in AML cell lines and primagrafts and could serve as a marker for RTK activation more broadly. Indeed, fusion and mutation detection in clinical samples across a broad range of RTKs remains challenging; hence, pSHP2 might serve as a common screening biomarker for rapidly identifying patient tumours with aberrant RTK activation for RTK-inhibitor trials26.
Since its launch in September 2017, the new CCLE portal has been accessed by more than 88,000 users from 129 countries. Despite concerns about data reproducibility28, follow-up analyses performed by us and others have consistently shown the robustness and applicability of large-scale genomic and pharmacogenomic cell line data for detecting cancer vulnerabilities and associated biomarkers29–33. Since the first data release, commercial and academic CCLE platforms have enabled the routine profiling of compounds to guide identification of drug targets and predictive biomarkers34,35. Here we describe a significant advancement of the CCLE resource, for the first time providing CCLE data that spans the central dogma from gene to transcript to protein. In parallel work, we also provide the profiles of 225 metabolites analysed in 928 CCLE lines2. These annotated datasets are now available through the public data portal (www.broadinstitute.org/ccle) and are integrated into the Dependency Map portal (depmap.org), allowing gene dependence by shRNA and sgRNA along with compound profiles to be queried against these new datasets.
METHODS
Cell culture
CCLE cell lines were grown according to vendor recommendations as previously described1 (Supplementary Table 1).
WGS and WES
WGS for 329 cell lines and WES for 326 cell lines were performed at the Broad Institute Genomics Platform. Libraries were constructed and sequenced on either an Illumina HiSeq 2000 or Illumina GAIIX, with the use of 101-base-pair (bp) paired-end reads for WGS and 76-bp paired-end reads for WES. Output from Illumina software was processed by the Picard data-processing pipeline to yield BAM files containing well-calibrated, aligned reads. All sample information tracking was performed by automated LIMS messaging.
Library construction
Starting with 3 μg of genomic DNA, library construction in a subset of samples was performed as described previously36. Other samples, however, were prepared using minor modifications of the published protocol. Specifically, initial genomic DNA input into shearing was reduced from 3 μg to 100 ng in 50 μl of solution, and for adaptor ligation, Illumina paired end adapters were replaced with palindromic forked adapters with unique 8 base index sequences embedded within the adaptor.
In-solution hybrid selection (for targeted sequencing libraries)
In-solution hybrid selection was performed as described previously36.
Size selection (for whole-genome shotgun libraries)
For a subset of samples, size selection was performed using gel electrophoresis with a target insert size of either 340 bp or 370 bp ± 10%. Multiple gel cuts were taken for libraries that required high sequencing coverage. For another subset of samples, size selection was performed using Sage’s Pippin Prep.
Preparation of libraries for cluster amplification and sequencing
After the above sample preparation, libraries were quantified using quantitative PCR (KAPA Biosystems) with probes specific to the ends of the adapters. This assay was automated using the Agilent Bravo liquid handling platform. On the basis of qPCR quantification, libraries were normalized to 2 nM and then denatured using 0.1 N NaOH using Perkin-Elmer’s MultiProbe liquid handling platform. The subset of the samples prepared using forked, indexed adapters was quantified using qPCR, normalized to 2 nM using Perkin-Elmer’s Mini-Janus liquid handling platform, and pooled by equal volume using an Agilent Bravo Automated Liquid Handling Platform. Pools were then denatured using 0.1 N NaOH. Denatured samples were diluted into strip tubes using a Perkin-Elmer MultiProbe Robotic Liquid Handling System.
Cluster amplification and sequencing
Cluster amplification of denatured templates was performed according to manufacturer’s protocol (Illumina), using either Genome Analyzer v.3, Genome Analyzer v.4, HiSeq 2000 v.2, or HiSeq v.3 cluster chemistry and flowcells. For a subset of samples, SYBR Green dye was added to all flowcell lanes following cluster amplification, and a portion of each lane was visualized using a light microscope in order to confirm target cluster density. Flowcells were sequenced either on a Genome Analyzer IIX using v.3 or v.4 Sequencing-by-Synthesis Kits and analysed using RTA v.1.7.48; or on an Illumina HiSeq 2000 using HiSeq 2000 v.2 or v.3 Sequencing-by-Synthesis Kits and analysed using RTA v.1.10.15 or RTA v.1.12.4.2. 101-bp paired-end reads were used for WGS, and 76-bp paired-end reads were used for whole-exome sequencing. For pooled libraries prepared using forked, indexed adapters, the Illumina Multiplexing Sequencing Primer Kit was used and a third 8-bp sequencing read was performed to read molecular indices.
RainDance targeted sequencing
For 950 cell lines, genomic loci with inadequate coverage by targeted hybrid capture sequencing were enriched using RainDance Technologies (RDT) platform to generate barcoded libraries of amplicons suitable for Illumina sequencing followed by massively parallel sequencing at the Broad Institute (Supplementary Table 2).
Per the RDT protocol, samples containing a minimum of 5 μg of high quality DNA were provided to RDT. Adaptor primers were designed to be used in the secondary amplification that contained Broad’s required sample indexing and adaptor sequences. RDT provided enriched DNA to Broad containing a minimum of 100ng of amplified and Qiagen Min-elute purified DNA that had undergone the RDT enrichment process using the Primer Library and that had gone through a secondary PCR of 10 cycles with Adaptor Primers.
RNA-seq profiling
RNA-seq and analysis were performed for 1,019 cell lines as previously described5. In summary, non-strand specific RNA sequencing was performed using large-scale, automated method of the Illumina TruSeq RNA Sample Preparation protocol. Oligo-dT beads were used to select polyadenylated mRNA. The selected RNA was then heat fragmented and randomly primed before cDNA synthesis. To maximize power to detect fusions, the insert size of fragments was set to 400nt. The resultant cDNA then went through Illumina library preparation (end-repair, base ‘A’ addition, adaptor ligation, and enrichment) using Broad-designed indexed adapters for multiplexing. Sequencing was performed on the Illumina HiSeq 2000 or HiSeq 2500 instruments with sequence coverage of no less than 100 million paired 101 nucleotides-long reads per sample.
miRNA profiling
Expression profiling of a panel of 734 miRNAs across 954 cell lines was performed using the Nanostring platform. All sample preparation and processing were performed according to the manufacturer’s protocol. Hybridized probes were purified and counted on the nCounter Prep Station and Digital Analyzer (NanoString), following the manufacturer’s instructions.
Global chromatin profiling
Histone modification profiling was performed as described previously for a total of 897 cell lines15,16. In brief, the mass spectrometry-based method profiles relative changes in the levels of almost all common post-translational modifications on histone H3.1 and/or H3.2. This includes methylation and acetylation modifications on H3K4, H3K9, H3K14, H3K18, H3K23, H3K27, H3K36, H3K56 and H3K79. Phosphorylation is also profiled on H3S10, and ubiquityl marks were profiled on H3K18 and H3K23. Importantly, the marks are frequently profiled as combinations (that is, H3K27me2K36me2), which is generally not possible with antibody-based methods. Some marks are omitted from visualizations for clarity. The changes observed are relative to other cell lines in the CCLE, with appropriate batch normalization. Common internal standards are used across all experiments.
RPPA
Cellular proteins were denatured by 1% SDS (with β-mercaptoethanol) and diluted in five two-fold serial dilutions in dilution lysis buffer. Serial diluted lysates were arrayed on nitrocellulose-coated slides (from Grace Bio-Labs) using an Aushon 2470 Arrayer (from Aushon BioSystems). A total of 5,808 array spots were arranged on each slide including the spots corresponding to serial diluted: 1) ‘standard lysates’; and 2) positive and negative controls prepared from mixed cell lysates or dilution buffer.
Each slide was probed with a primary antibody and a biotin-conjugated secondary antibody. Only antibodies with a Pearson correlation coefficient between RPPA and western blotting of greater than 0.7 were used. Antibodies with a single or dominant band on western blotting were further assessed by direct comparison to RPPA using cell lines with differential protein expression or modulated with ligands/inhibitors or siRNA for phospho- or structural proteins, respectively.
The signal obtained was amplified using a Dako Cytomation–Catalysed system (Dako) and visualized by DAB colorimetric reaction. The slides were scanned, analysed, and quantified using custom software to generate spot intensity.
Each dilution curve was fitted with a logistic model (‘supercurve fitting’ developed by the Department of Bioinformatics and Computational Biology in MD Anderson Cancer Center; http://bioinformatics.mdanderson.org/OOMPA). This fits a single curve using all the samples (that is, dilution series) on a slide with the signal intensity as the response variable and the dilution step as the independent variable. The fitted curve is plotted with both the observed and fitted signal intensities on the y axis and the log2 concentration of proteins on the x axis for diagnostic purposes. The protein concentrations of each set of slides were then normalized for protein loading. Correction factor was calculated by first median-centring across samples of all antibody experiments and then median-centring across antibodies for each sample.
RPPA technical and biological controls
RPPA profiling was performed in two batches, with 422 samples in batch one and 544 samples in batch two. To evaluate the data reproducibility between the two batches, frozen lysates from 30 samples generated for batch one were profiled in batch two as technical controls. To evaluate the reproducibility between biological replicates, 6 cell lines were grown two times independently and profiled in batch two as biological replicates (Supplementary Table 14). Five of these cell lines were also grown and profiled in batch one independently.
In vitro validation of ponatinib and pSHP2 association
A total of 21 cell lines were used to validate the observed correlation between pSHP2 level and sensitivity to ponatinib. This included two BCR-ABL fusion containing CML cell lines (MEG01 and LAMA84) that were expected to be sensitive to ponatinib and 19 AML cell lines (CMK, HEL9217, THP1, NOMO1, HL60, HEL, KO52, P31FUJ, OCIAML2, SIGM5, GDM1, NKM1, KG1, MonoMAC6, KASUMI1, MonoMAC1, CTV1, MV411 and EOL1). These included all AML cell lines in the overlap between CCLE RPPA and GDSC drug sensitivity datasets and five additional cell lines to test the hypothesis. On the basis of their sensitivity to ponatinib, CTV1 and NKM1 were the two non-CCLE cell lines that were selected. EOL1, HEL9217 and MonoMAC1 were non-GDSC cell lines, selected based on their high pSHP2 level (EOL1, HEL9217) and FLT3 mutation and overexpression (MonoMAC1). CCLE cell lines were obtained through the CCLE project, NKM1 was obtained through the Japanese Collection of Bioresources, and CTV1 was obtained from Leibniz-Institut DSMZ (Deutsche Sammlung von Mikroorganismen und Zellkulturen). Cell lines were grown according to respective vendors’ recommendations.
Whole-cell extracts were prepared using a 1% NP40 lysis buffer and blotted with total and phosphorylated SHP2 antibodies (Cell Signaling Technology) as previously described37. pSHP2 levels were quantified relative to total SHP2 using a LI-COR Odyssey imager.
Cellular sensitivity was determined by seeding cells in growth media in 96-well plates and treating with indicated small molecules for 96 h in 6–8 replicates. Cell viabilities were quantified using CellTiterGlo and values were normalized to DMSO-treated cells as previously described37.
RRBS
For 843 cell lines, the RRBS method was used as previously described38.
TERT promoter mutation sequencing
Targeted sequencing of the TERT promoter was performed as described previously for 190 cell lines39,40. Paired-end sequencing with a 150-bp read length was performed on PCR amplicons of length 273 bp to high depth on an Illumina MiSeq instrument. We then combined this with variant calls for the TERT promoter from WGS dataset of 329 cell lines previously described (Huang et al., Oncogenesis 2015. doi: 10.1038/oncsis.2015.39). Alternate allele fractions >10% were called as mutant for pre-specified sites: chr5:1295161 (hg19), chr5:1295228–1295229, chr 5:1295228, chr5:1295242–1295243, and chr5:1295250 using MuTect v1.1.641 (Supplementary Table 5).
RT-qPCR detection of MDM4 isoforms
Cell lines were processed using Trizol RNA extraction (Life Technologies)1. cDNA was reverse transcribed using the iScript cDNA synthesis kit (BioRad) with no reverse transcriptase samples serving as a negative control. Gene expression was quantified using the Power SYBR Green Master Mix (Applied Biosystems) and normalized to GAPDH. Quantification of the MDM4-FL/MDM4-S ratio was determined by calculating the fold change of MDM4-FL and MDM4-S for each technical replicate relative to the TOV21G universal reference standard cell line using the ΔΔCt method. For each cell line, the mean and standard deviation of the log MDM4-FL/MDM4-S ratio was calculated across technical replicates (see Supplementary Table 11 for primer sequences).
In vivo xenograft experiment
Fourteen AML primagrafts from the Public Repository of Xenografts (PRoXe.org) were first tested by RPPA for pSHP2 levels. Two of the highest pSHP2-expressing primagrafts (CBAM-87679 and NVAM-61786) and one low pSHP2-expressing primagraft (DFAM-68555) were selected for xenotransplantation to test for sensitivity to ponatinib treatment. Each primagraft was xenotransplanted into twenty female 7-week-old NOD scid gamma (NSG) mice from Jackson Laboratory. Mice were intravenously injected with 0.15 × 10⁶–1.0 × 10⁶ cells via the lateral tail vein. Engraftment of human leukaemia cells in mice was followed using FACS analysis of human CD45+ CD33+ or CD34+ cells in the peripheral mouse blood. Once leukaemia was established with an average 0.4% human cells in the peripheral blood from the sentinel bleed mice, animals were randomized into two treatment groups of 10 mice each: ponatinib (40 mg kg−1 oral once daily) and vehicle (25 mM citrate buffer, pH 2.75). For primagraft CBAM-87679, ponatinib dosing started two weeks after injection given a rapid progression of disease. Mice were treated with ponatinib for 3 weeks. Mice were euthanized once morbidity and/or stage 3 hind limb paralysis due to disease burden was observed. All animal studies were approved by the Dana-Farber Cancer Institute’s Animal Care and Use Committee.
To assess the pharmacodynamic efficacy of treatments, three mice from each group were analysed after 3 days of treatment. Then, 2–4 h after the day 3 drug or vehicle dose, mice were euthanized and tissues collected. Spleen (1/4 of total spleen), one femur, and liver were fixed in 10% neutral-buffered formalin for immunohistochemistry and other studies. The remaining spleen was crushed, and bone marrow cells flushed from the three remaining leg bones were viably cryopreserved in 10% dimethylsulfoxide (DMSO), 90% fetal bovine serum (FBS).
The remaining mice (7 per group) were treated for a total of 21 days. Survival analysis based on these 7 mice per group was performed using the log-rank (Mantle–Cox) test (GraphPad Prism 7).
Variant calling and filtering germline variants for WES, WGS, hybrid capture, and RainDance
A variant calling pipeline was designed to process all sequencing data generated in the CCLE. Mutation analysis for single nucleotide variants (SNVs) was performed using MuTect v1.1.641 in single sample mode with default parameters. Short indels were detected using Indelocator (http://archive.broadinstitute.org/cancer/cga/indelocator) in single sample mode with the default parameters. To ensure high quality variant calls, we required a minimum coverage of 4 reads with minimum two reads supporting the alternate allele. Variants with allelic fraction below 0.1 and variants outside the protein-coding region were excluded. To remove germline-like variants, any variant with a normal allelic frequency greater than 10−5 as described in the Exome Aggregation Consortium (ExAC) project42 was excluded with the exception of any cancer-recurrent variants defined by a minimum frequency of 3 in TCGA or a frequency of 10 in COSMIC42.
We also further filtered out sequencing artefacts and germline variants using a panel of normals (PoN). For each genomic position, we encoded the distribution of alt read counts across approximately 8,000 TCGA normals. For each mutation call, we computed a score indicating whether or not its observed read counts are at or below counts across the PoN. We flagged sites with a corresponding score above a certain threshold (PoN log-likelihood >−2.5). Thus, if a site recurrently harbours moderate sequencing noise in the PoN and is called at a low-to-moderate allelic fraction, it is flagged. Likewise, a call with many supporting reads at the same locus would not be. A common germline site would have recurrently high allelic fractions across the PoN, but any call at that site with an allelic fraction below germline levels would be flagged.
Whole exome sequencing data in the form of bam files from the GDSC were downloaded from the Sanger Institute (http://cancer.sanger.ac.uk/cell_lines, EGA accession number: EGAD00001001039) GDSC dataset and processed with the same pipeline3.
Variant calling and filtering germline variants for RNA-seq data
We applied a similar variant calling pipeline described above to RNA-seq data with some modifications. Instead of using indelocator for calling indels; we used the GATK best practices pipeline43 (outlined in https://gatkforums.broadinstitute.org/gatk/discussion/3892/the-gatk-best-practices-for-variant-calling-on-rnaseq-in-full-detail)) to call mutations and indels in STAR realigned RNA-seq samples. We also ran MuTect v.1.1.641 on Tophat 1.4 aligned samples to call SNVs. We then kept only the intersection of SNVs that were called by GATK and MuTect v.1.1.6. We further called SNVs using MuTect v.1.1.6 in 200 additional normal samples from the GTEx program. We used this list to exclude common artefacts and germline variants before running the passing variants through the same germline filtering process described earlier for WES and WGS. For three cell lines (HUH7_LIVER, FUOV1_OVARY and 2313287_STOMACH) the GATK pipeline failed to produce mutation calls, so we only used RNA-seq-based mutation calls for the remaining 1,016 cell lines (Extended Data Fig. 2a).
Comparison with Sanger GDSC WES
To compare variant calls for CCLE cell lines and Sanger GDSC WES data, we applied MuTect to force call the germline filtered SNVs that were detected in either CCLE or GDSC cell lines. We also used a panel of approximately 100,000 common SNVs for comparing the germline variants. For each SNV, we calculated the allelic fraction as the ratio of number of reads supporting the alternate allele to total number of reads covering the locus (AF = N_alt/ (N_alt+N_ref)), in which N_alt is the number of reads supporting alternative allele and N_ref is the number of reads supporting reference allele for each variant in each cell line. We included only variants that had a coverage of 10 or more reads in both datasets and allelic fraction of at least 0.1 in minimum one of the datasets. We then compared the CCLE and GDSC samples by calculating the Pearson Correlation between the allelic fractions for all variants (global comparison) and for each cell line (individual cell line comparison). This was done using both CCLE WES and CCLE hybrid capture data. We obtained highly comparable results between CCLE_WES_vs_Sanger_WES and CCLE_HC_vs_Sanger_WES (Extended Data Fig. 2f, g). We used correlation between CCLE_HC and Sanger WES to annotate the genetic drift in each cell line (Supplementary Table 3). For the merged mutational calls, we excluded 65 Sanger cell lines with Pearson’s r < 0.75 for somatic variants allelic fractions. For cancer hotspot mutations, we only included the subset of variants that were highly recurrently observed in TCGA (in 6 or more TCGA samples). We excluded the three germline mismatching cell lines (DOV13_OVARY, PC3_PROSTATE and ISHIKAWAHERAKLIO02ER_ENDOMETRIUM) in the global comparisons.
Structural variant analysis
In total, 932 whole genomes aligned to human genome reference GRCh37 available from Genomic Data Commons as part of the TCGA and 329 new whole genomes from the CCLE cell lines were run through the SvABA44 structural variant caller using default settings with each tumour genome paired with its corresponding normal genome. For CCLE WGS, we used HCC1143BL as the normal, and further filtered out more possible germline SV with a structural variant blacklist constructed from the set of all germline structural variants detected as part of the SvABA structural variant calling pipeline.
Fusions detection and filtering
For gene fusion detection, we used STAR-Fusion v.0.7.1 (https://github.com/STAR-Fusion/STAR-Fusion)45 which identifies fusion transcripts from RNA-seq data and outputs all supporting data discovered during alignment. We used a cutoff of five reads (either spanning or crossing the fusion) to call the presence of a translocation. To reduce artefacts, we removed any fusions detected in more than one sample in GTEx or in 20 or more samples in CCLE and removed fusions involving mitochondrial chromosomes, or HLA genes, or immunoglobulin genes, or with (SpliceType = ” INCL_NON_REF_SPLICE” and LargeAnchorSupport = ”No” and minFAF <0.02), or (sumFFPM <0.1 and minFAF <0.02). We further filtered fusions by fusion allelic fractions (FAF_left2 + FAF_right2 > 0.0225 and minFAF >0.03, excluding fusions detected in TCGA). Here FAF_left is fusion allelic fraction for the left fusion partner reported by STAR-Fusion, FAF_right is the fusion allelic fraction for the right fusion partner, and minFAF is the minimum of the two.
Comparison of fusions with gene dependencies
To investigate the association between fusions and gene dependencies, for each of the gene dependency datasets (Achilles RNAi, Achilles CRISPR, and DRIVE RNAi), and for each of the two genes in the fusion gene pair, we divided cell lines into two groups based on the presence of the fusion, and applied two-sided t-test to compare the distribution of gene dependencies in the two groups. We used Benjamini and Hochberg procedure to obtain adjusted P values. We used the difference between the mean dependencies in the two groups to calculate the effect size (Extended Data Fig. 3c, Supplementary Table 4).
Mutational signature analysis
TCGA MC3 mutations calls were downloaded from https://gdc.cancer.gov/about-data/publications/mc3-2017 and filtered to keep only mutations with ‘PASS’ or ‘wga’ in ‘FILTER’ column. Based on the mapping of CCLE cell lines to TCGA cancer types we only considered 19 cancer types having at least 20 cell lines; BLCA (n = 29), BRCA (n = 60), COAD.READ (n = 72), DLBC (n = 56), ESCA (n = 38), GBM (n = 45), HNSC (n = 62), KIRC (n = 55), LAML (n = 46), LIHC (n = 28), LUAD (n = 84), LUSC (n = 24), OV (n = 60), PAAD (n = 48), SARC (n = 38), SKCM (n = 79), STAD (n = 46), and UCEC (n = 29). All single nucleotide variants (SNVs) in both TCGA and CCLE cohorts were classified into 96 base substitutions in tri-nucleotide sequence contexts.
De novo extraction
For each cancer type we combined TCGA and CCLE data and first performed de-novo signature discovery in each combined cohort exploiting a Bayesian variant of non-negative matrix factorization, ‘SignatureAnalyzer’ (http://archive.broadinstitute.org/cancer/cga/msp)46,47, inferring an optimal number of signatures best explaining observed mutations. In each de-novo extraction, we enforced a pure ‘C>T at CpG’ signature as a default, which is profiled from the COSMIC1 signature (https://cancer.sanger.ac.uk/cosmic/signatures) after removing all other components except for C > T at ACG, CCG, GCG, and TCG. The separation of C>T_CpG components from the conventional COSMIC1 was aimed to minimize a possible interference between the background, residual components in COSMIC1 and COSMIC5, which are highly overlapping with each other. Based on manual inspection, and the cosine similarity of extracted signatures to 30 COSMIC signatures, we identified a set of active signatures in each cancer type (Supplementary Table 6) and exploited this information in the following projection step to infer the activity of COSMIC signatures in both TCGA and CCLE cohorts. Based on prior knowledge and literature we only allowed COSMIC3 (BRCA signature) in BRCA, OV, PAAD, SARC, STAD and UCEC.
Projection
The comparison of signature attributions across different cancer types or different cohorts needs the use of the same signature profiles. Because the signature profiles from a de-novo extraction varied across cancer types, depending on the number of samples or mutations, here we performed a projection approach to infer sample-specific attributions based on 30 COSMIC signature profiles by modifying ‘SignatureAnalyzer’. The pure ‘C>T at CpG’ signature was used instead of COSMIC1. More specifically, the projection was done by minimizing the Kullback–Leibler divergence between the mutation count matrix, X (96 × N), N being a number of samples in each combined cohort of TCGA and CCLE, and a product of the signature-loading matrix W (96 × K) and the activity-loading matrix H (30 × K). During the optimization the signature-loading matrix W, comprised of the normalized signature profiles of the corresponding K COSMIC signatures, was strictly frozen and the activity-loading matrix H was iteratively refined through the multiplication update scheme to best approximate the mutation count matrix X ~ WH. The resulting row vectors in H represent de-convoluted signature activities across samples48. In each projection we restricted the usage of signatures only to the active ones identified from the de-novo extraction step (Supplementary Table 6; K being the number of active signatures). Owing to the multiple MSI signatures (common signatures through most MSI samples - COSMIC6, 15, 21, 26, POLE+MSI – COSMIC14, POLD+MSI – COSMIC20)49 all common MSI signatures were allowed when a de-novo extraction identified at least one of six MSI signatures, while COSMIC14 and COSMIC20, unique to POLE+MSI and POLD+MSI, respectively, were strictly allowed only when there was evidence for the corresponding signature in de-novo extraction.
Signature comparison between CCLE and TCGA
For each cancer type we first calculated the normalized activity of each individual signature across tumours and cell lines (number of mutations attributed to each signature / number of mutations in each sample), and compared the mean of normalized activities between the TCGA and CCLE cohorts.
MSI annotations
For each cell line profiled by sequencing, we inferred MSI status by counting the total number of filtered deletions called by Indelocator (http://archive.broadinstitute.org/cancer/cga/indelocator) and the fraction of these deletions that were located in microsatellite regions as defined by three consecutive repeats of a sequence of less than five nucleotides in length. On the basis of the distributions of these values in each of the sequencing datasets (CCLE Hybrid Capture, CCLE WGS, CCLE WES, and Sanger WES), we specified a threshold value for the number of MS deletions (N_MS_del) and two threshold values for the percentage of microsatellite deletions (P_MS_del_1 and P_MS_del_2, see Supplementary Table 7). Cell lines were annotated as inferred-MSI if the number of MS deletions was greater than N_MS_del and the percentage of MS deletions was greater than P_MS_del_2. Similarly, cell lines were annotated as inferred-MSS if the number of MS deletions was less than N_MS_del and the percentage of MS deletions was less than P_MS_del_1 in any of the four datasets (Extended Data Fig. 5a, Supplementary Table 7).
ABSOLUTE copy number analysis
Allelic copy number, whole-genome doubling, subclonality, purity and ploidy estimates were generated by the ABSOLUTE algorithm50. Somatic copy numbers used in ABSOLUTE analysis were derived either from SNP arrays or whole exome sequencing. Allelic fractions of mutation were derived from either Hybrid Capture sequencing or whole exome sequencing data.
Annotation of DNA methylation for promoters, enhancers, and CpG islands
Short reads from the RRBS data were aligned using Bismark 0.7.1251 for 843 cell lines. CpG methylation was estimated using the read.bismark tool in the R MethylKit package1,52 with parameters mincov = 5 and minqual = 20. To estimate gene promoter level methylations, we used RefSeq transcription start site (TSS) information for hg19 downloaded from the UCSC genome browser. To define promoter regions, we used two approaches. First, for the global analysis of correlation between methylation and mRNA expression (Extended Data Fig. 6c), we used a fixed window size of 1,000 bp upstream of the TSS for each gene and calculated a coverage-weighted average of CpG methylations for CpG sites within this region as previously described53. We found 17,182 genes with average coverage greater than 5 reads in the RRBS dataset. For most genes, we observed that the 1 kb upstream TSS region contains the promoter methylation changes. However, for some genes, (for example, VHL), we observed downstream methylation changes relative to the TSS. Therefore, we used an alternative approach to capture gene level methylation signal for the remainder of the analyses in the paper. For each TSS, using data for all cell lines, we first clustered CpG sites within (−3000, 2000) nucleotides of the TSS using the hclust function in R and cut the hierarchical clustering tree to form three clusters. This approach grouped together the CpG sites with similar methylation changes across samples, and these clusters usually represented the CpG sites in the promoter, upstream, and downstream regions. We used the same weighted averaging approach described above to calculate the methylation signal for each cluster in each sample.
To annotate the CpG island and enhancer methylations in the cell lines, we downloaded CpG island and VISTA enhancer coordinates from UCSC genome browser and applied the above unsupervised clustering to a window (coordinate start −2000, coordinate end +2000) to determine the methylation for each enhancer and CpG island sequence. For sequences with length greater than 5000, we first divided them into sections of length 5000, and then performed the same clustering process.
t-SNE plots for DNA methylation data
To visualize the high-dimensional DNA methylation data, we used the t-distributed stochastic neighbour embedding (t-SNE) algorithm implemented in the Rtsne package in R with default parameters54. We used all the promoter methylation values for CpG clusters with a proper coverage (average CpG coverage >25 reads) as input features for a two-dimensional embedding for visualization.
Comparison of DNA methylation and mRNA
To compare mRNA expression and promoter methylation, for each gene, we first calculated z scores for its mRNA expression (log(RPKM)) and promoter methylation. We then calculated the linear regression coefficient associating expression to methylation while correcting for cancer type using the R function lm(expr~meth+cancer_type). For the null distribution, we permuted the gene labels for mRNA expression dataset and repeated the same procedure.
Comparison of DNA methylation and dependency
To investigate the association between promoter methylation and gene dependencies, for 2,776 genes with significant negative correlations between promoter methylation and mRNA expression (Pearson’s correlation <−0.5), we calculated Pearson correlations between promoter methylations and dependencies for all pairs of genes connected in the STRING dataset (string-db.org)55. Here, for each gene, we considered up to 100 top connected genes in STRING with a connectivity score above or equal to 800. For robust correlations, we excluded the top three cell lines with highest sums of squares of normalized dependency and methylation scores and calculated Pearson correlations using the remaining samples. This analysis was performed separately on the Achilles RNAi5, Achilles CRISPR7, and Project DRIVE6 gene dependency datasets. For each correlation coefficient value, we assigned an estimated P value by fitting a normal distribution to all correlation coefficients calculated within the respective dataset. We then used the p.adjust function in R to calculate the false discovery rate (q value) for each methylation-dependency correlation (Fig. 2a and Supplementary Table 8).
LDHA, LDHB and RPP25 promoter methylation in TCGA
We examined methylation-expression relationships for LDHA, LDHB and RPP25 in 22 TCGA tumour types. Methylation profiling (Illumina HM450 BeadChip beta-values) and RNA-seq expression (log2(RPKM)) data were sourced from the TCGA provisional datasets hosted at cBioPortal (cbioportal.org/datasets.jsp)56,57. We excluded tumour types with less than 100 samples with both methylation and expression annotations. Correlation values for methylation vs. expression of the same gene were then computed and are shown in order of their magnitude (Extended Data Fig. 6i).
Global chromatin profiling analysis
The 897 cell lines with available global chromatin data were clustered based on the 38 (out of 42) chromatin modifications that were detected in more than 98% of the cell lines using the pheatmap R function (Pretty Heatmaps v1.0.10) with parameters clustering_method = ‘ward.D’, clustering_distance_cols = ‘euclidean’, and cutree_cols = 19.
CREBBP TAZ2 (CH3)-specific truncating mutations were annotated as the truncating mutations in CREBBP occurring between amino acids 1745 and 1846 (affecting the TAZ2 (CH3) domain but not the ZZ domain). Similarly, for EP300 TAZ2 (CH3)-specific truncating mutations, we included any truncating mutation in EP300 occurring between amino acids 1708 and 1809 (Fig. 3, Extended Data Fig. 7a).
EP300 and CREBBP enrichment volcano plot
Two-sided Fisher’s test was used to evaluate enrichment of truncating mutations in the newly identified high H3K18/K3K27 acetylation cluster. For truncating mutations, we included any nonsense mutations, splice site mutations, or frameshift indels affecting any part of the gene. For the analysis in Extended Data Fig. 7b, only genes with at least 20 affected cell lines (n = 684) were included. We used fisher.test function in R to estimate the odds ratios and P values. Adjusted P values were obtained using p.adjust function in R.
Short read alignment and calculation of gene expression
RNA-seq reads were aligned to the GRCh37 build of the human genome reference using STAR 2.4.2a58. The GENCODE v19 annotation was used for the STAR alignment and all other quantifications. Gene level RPKM and read count values were calculated using RNA-SeQC v1.1.859. Exon-exon junction read counts were obtained from STAR. Isoform-level expression in TPM (transcripts per million) was quantified using RSEM v.1.2.22. All methods were run as part of the pipeline developed for the GTEx Consortium (https://gtexportal.org)60.
CCLE comparison to GTEx and TCGA
We compiled log2(TPM + 1) gene expression data for 1,019 CCLE cancer cell lines, 10,535 TCGA primary tumour samples, and 11,688 GTEx normal tissue samples. TCGA Pan-Cancer TOIL RSEM TPM data were obtained from Xena Browser (https://xenabrowser.net/) and GTEx v.7 TPM data were accessed from the GTEx Portal (https://gtexportal.org/home/datasets). We compared CCLE and TCGA data using a subset of 5,000 genes that were highly variable in the CCLE and TCGA data and 22 cancer types that were common to both the TCGA and CCLE datasets. In each dataset, we averaged the gene expression data across all samples per cancer type, then mean subtracted per gene. We calculated the pairwise Pearson’s correlation between the averaged CCLE gene expression and the averaged TCGA gene expression. We compared CCLE and GTEx data using a subset of 5,000 genes that were highly variable in the CCLE and GTEx data. We averaged the CCLE and GTEx gene expression data across all samples per cancer type or primary site, respectively, mean subtracted per gene, and calculated the pairwise Pearson correlation between the averaged CCLE gene expression and the averaged GTEx gene expression. We also compared individual CCLE cell lines to TCGA and GTEx average profiles. The gene expression data for individual cell lines were mean subtracted per gene using the same vector of means as the averaged CCLE expression. We calculated the pairwise Pearson correlation between the gene expression for these cell lines and the averaged TCGA and GTEx gene expression (Supplementary Table 9).
Exon-inclusion ratios
To quantify alternative splicing in cell lines, we used the STAR junction read counts to estimate the fraction of times each exon was spliced in. For both ends of each exon, we calculated the total number of junction reads supporting inclusion of that exon (ni) and the total number of junction reads supporting skipping of the exon (ns). We estimated the inclusion ratio as r = ni/(ni + ns). We required each exon ratio to be supported by at least 10 reads (ni + ns ≥ 10).
Splicing versus dependency
To investigate whether some gene dependencies were more strongly correlated with exon splicing instead of total mRNA expression, we correlated exon-inclusion ratios produced using the above method with Achilles RNAi gene dependency data and compared the results to a similar analysis based on mRNA expression. For each exon, we calculated the Pearson correlation between exon inclusion and the DEMETER dependency score of the same gene (x axis on Fig. 4a) and compared that correlation with the respective Pearson correlation between the total mRNA expression and dependency of the same gene (y axis on Fig. 4a). In this analysis, we only included exons quantified in at least 200 cell lines with Achilles data to obtain robust correlation estimates.
Nanostring data quality control and normalization
Samples were divided into 14 batches, and two replicates of the K-562 cell line were included in each batch as a control. Internal positive and negative controls were used for normalization as recommended by NanoString using NanoString nSolver software. We excluded samples that failed NanoString nSolver quality control as well as one sample based on low positive control signal (normalization coefficient >6) and another sample based on high background signal (with second ranked negative control value >80). To estimate the background signal, we sorted the values for the negative controls within each sample and picked the second highest value as the background estimate. The median background estimate across all cell lines was 26.1. We used log(50 + N), in which N is the nSolver normalized value to reduce the effect of the background signal in the downstream analyses.
Comparison of miRNA and dependency
To identify the strongest specific associations between miRNA expression and gene dependencies, we calculated the Pearson’s correlation between the expression of each microRNA and each gene dependency score in the Achilles RNAi dataset. We then normalized the Pearson’s correlations for each microRNA (z1, x axis in Extended Data Fig. 10b) and for each gene dependency (z2, y axis in Extended Data Fig. 10b). Several gene dependency–microRNA pairs showed outlier correlations (with |z1|>6 or |z2|>6). We chose the top scoring association (CTNNB1 and mir-215) for further investigation and comparison with data from TCGA (Extended Data Fig. 10c–j; Supplementary Table 13).
RPPA analysis, batch effect correction and quality control
RPPA data were normalized within each batch as described above (see RPPA section), and the log-transformed values were merged and corrected for batch effect using the removeBatchEffect method in Limma package in Bioconductor61,62.
Out of the 925 cell lines that were profiled, 26 lines were excluded. These were comprised of 19 lines with low total protein content and 7 lines with poor overall mRNA–protein correlation. For the 6 cell lines with biological replicates, the average of the two replicates in batch two were used.
Correlation of mRNA and protein
For 154 RPPA antibodies against single gene total proteins, Pearson correlations for mRNA (RNA-seq log2 RPKM) and protein levels were obtained. For null distribution, gene labels were randomly permuted (Extended Data Fig. 11a).
Effect of RPPA dynamic range on protein-mRNA correlation
For 154 RPPA antibodies against single gene total proteins, dynamic range was calculated as the difference between the third highest and the third lowest values across all cell lines. Dynamic range was plotted against mRNA–protein correlations (Extended Data Fig. 11b). Statistical significance was determined using two-sided Pearson’s correlation test.
Effect of antibody type and antibody quality on the protein–mRNA correlation
For 154 RPPA antibodies against single gene total proteins, Wilcoxon rank sum test was used to evaluate difference between validated antibodies (n = 96) and those annotated as ‘with caution’ (n = 58) as provided by MD Anderson Cancer Center Reverse Phase Protein Array (RPPA) Core Facility (Extended Data Fig. 11c, left, Supplementary Table 14). Similarly, we compared the protein-mRNA correlations of antibodies against single gene total protein (n = 154) with antibodies against single gene phospho-proteins (n = 50).
Comparison of mRNA–protein correlations between CCLE and TCGA
mRNA and protein correlations for 181 antibodies across 3,467 TCGA samples from 11 tumour types were calculated for each antibody and compared with CCLE mRNA-protein correlations63. Two-sided Pearson’s correlation test was used to evaluate statistical significance (Extended Data Fig. 11d).
RPPA elastic net analysis
An elastic net regression analysis similar to the one used previously1 was run to find genomic features that predict drug sensitivities as measured by AUC. The feature set included mutations, DNA copy number, mRNA expression and RPPA protein data. These features were used to predict sensitivities to 24 compounds profiled in the CCLE and 138 compounds from Genomics of Drug Sensitivity in Cancer (GDSC) project.
Features with an absolute Pearson correlation of greater than 0.1 with the target drug sensitivity profile were selected. Optimal values for the alpha and lambda parameters were found by a tenfold cross validation using cv.glmnet function in the glmnet R package64. A 200-fold bootstrapping was then performed using the optimal parameter values. We calculated the frequency of selection and average weight for each feature.
The above analysis was performed twice for each drug, once using all features and another time using all features with the exclusion of RPPA values. The model prediction errors for the two models were compared to estimate the accuracy gained by adding the RPPA data.
Data availability
All the CCLE processed datasets are available at the CCLE portal (www.broadinstitute.org/ccle) and DepMap portal (http://www.depmap.org). Raw sequencing data are available at Sequence Read Archive (SRA) under accession number PRJNA523380. Achilles RNAi data (DEMETER scores) were downloaded from https://portals.broadinstitute.org/achilles. Achilles CRISPR Avana 18Q3 public dataset (gene effects, CERES scores) was downloaded from https://figshare.com/articles/DepMap_Achilles_18Q3_public/6931364/1. Novartis Project DRIVE RNAi dataset (ATARiS scores) was obtained from the Project DRIVE authors. CTRP AUC scores was downloaded from the NCI website (ftp://caftpd.nci.nih.gov/pub/OCG-DCC/CTD2/Broad/CTRPv2.0_2015_ctd2_ExpandedDataset). Sanger GDSC drug sensitivity (AUC and IC50 scores) were downloaded from the Sanger website (https://www.cancerrxgene.org/downloads).
Code availability
Most of the statistical analyses were performed in R (version 3.5.2). Source codes are available upon request.
Extended Data
Extended Data Fig. 1. Overview of CCLE cell lines and datasets.
a, The existing and new CCLE datasets as indicated are depicted. b, Distribution of cell lines by lineage and ancestry across CCLE. c, Visual representation of the number of cell lines in each dataset. New CCLE datasets are shown in red. Functional genomics datasets are shown in blue.
Extended Data Fig. 2. CCLE variant calling pipeline and CCLE and GDSC comparison.
a, Unified pipeline integrating mutation and indel calls from different platforms was used to generate a set of high confidence genomic alterations across 1,063 cancer cell lines. Identified variants were cross-referenced with the ExAC and TCGA databases and a panel of normals (PoN) to exclude germline variants/artefacts and generate the finalized high-confidence variant call set. b–d, Comparison of variant calls between CCLE and Sanger GDSC cell lines for germline (b; n = 1,250,562), TCGA hotspot somatic (c; n = 281) and non-hotspot somatic (d; n = 82,572) variants using WES data. Pearson’s correlation coefficients are shown. e, Comparison of TCGA hotspot variant calls between CCLE Hybrid Capture (HC) data and Sanger GDSC WES data. Variants with allelic fraction >0.4 in one dataset and greater than fourfold difference in allelic fractions between the two datasets are shown as open circles (n = 980). f, g, Comparison of Pearson’s correlation coefficients between CCLE WES and Sanger GDSC WES data versus Pearson’s correlation coefficients between CCLE HC and Sanger GDSC WES data for germline (f; n = 107) and somatic (g; n = 93) variants. Cell lines with fewer than 30 variants were excluded. h, Comparison of allelic fraction Pearson’s correlations between CCLE cell lines and Sanger cell lines using CCLE HC and Sanger GDSC WES data (n = 558 common cell lines between the two datasets; Supplementary Table 3). Cell lines with low germline correlation (sample mismatch) and low somatic correlation (genetic drift) are highlighted.
Extended Data Fig. 3. Annotation of structural variants and fusions in CCLE cell lines.
a, Structural variant (SV) burden in CCLE whole genomes. Structural variants detected by SvABA in cell lines grouped by tissue type are plotted in the order of mean structural variant burden (red bar in each facet). b, Bar plot of recurrent COSMIC fusions detected in CCLE RNA-seq data coloured by cell line lineage. c, Volcano plot of Achilles RNAi gene dependencies versus CCLE fusions for cell lines (n = 478) common between CCLE and Achilles datasets. P values determined by two-sided t-test. Genes with significant adjusted P values (false discovery rate (FDR) < 0.1) are highlighted. d, e, Examples of fusions associated with gene dependency: cell lines with ESR1-CCDC170 fusion (n = 4) are sensitive to ESR1 shRNA knockdown (d), and cell lines with AFF1-KMT2A fusion (n = 3) are sensitive to AFF1 shRNA knockdown (e). The x axis shows mRNA expression, and the y axis shows Achilles RNAi gene dependency DEMETER score5.
Extended Data Fig. 4. Comparison of COSMIC mutational signatures in CCLE and TCGA datasets.
a, Mutational signature activity for CCLE cell lines and TCGA tumours averaged for each cancer type. For each sample, we computed a fraction of mutations attributed to 30 COSMIC signatures and took average across samples in each cancer type. Tumour types selected for representation have at least 20 samples in CCLE. b, Scatterplots for the mutational signature activities for CCLE and TCGA (n = 168). P value determined by linear regression analysis and corrected for COSMIC signature number. c, Volcano plot for comparison of COSMIC mutational signatures and CCLE or GDSC genetic drift estimates using two-sided Pearson’s correlation test (n = 3–459; Supplementary Table 6). d, Scatter plot for COSMIC-6 mutational activity signatures versus CCLE or GDSC genetic drift estimates (n = 354). Colour coding as in b. P value determined by Pearson’s correlation test.
Extended Data Fig. 5. Determination of MSI status in the CCLE and interrogation of mismatch repair genes.
a, Identification of MSI cell lines. Number of deletions in microsatellite regions is plotted versus percentage of deletions in microsatellite regions for all cell lines in CCLE HC sequencing, CCLE WGS, CCLE WES, and Sanger GDSC WES datasets (see Methods). The x axis denotes the number of short deletions in microsatellite regions, and the y axis denotes percentage microsatellite as measured by the percentage of short deletions that lie within microsatellite regions. Inferred MSI cell lines are outlined by the green rectangle. b, Heat plot of inferred MSI status and selected CCLE annotations for DNA mismatch repair genes MLH1, MSH2 and MSH6 genes for all cell lines (top) and the MSI subset (bottom). Highlighted red boxes show differences in mRNA and protein expression levels in MSH2 and MSH6. MLH1 hypermethylation is defined as average promoter methylation greater than 0.5. c, d, Scatterplot of CCLE cell lines comparing MSH6 mRNA expression levels (x axis) from RNA-seq versus MSH6 protein abundance (y axis) as quantified by RPPA in inferred-MSI (c) and inferred-MSS (d) cell lines. Red and blue denotes cell lines containing truncating mutations or copy number loss in MSH6 and MSH2, respectively. Purple denotes cell lines containing truncating mutation or copy number loss in both MSH2 and MSH6. The black box highlights the MSH6 high mRNA low protein (HL) category. e–g, Bar plots of percentages of cell lines containing truncating mutations in MSH6 (e), MSH2 (f), and MLH1 expression loss (g) in different MSH6 mRNA and protein categories among inferred-MSI cell lines (LL: n = 11; HL: n = 17; HH: n = 44). P = 4 × 10⁻⁴ (e), P = 1 × 10⁻³ (f) and P = 1 × 10⁻⁴ (g), two-sided Fisher test. h, MSH2 protein levels in different MSH6 mRNA and protein categories. ***P < 1 × 10⁻⁶, two-sided Wilcoxon rank sum test. P = 8 × 10⁻¹⁴, difference between the HH and HL set; P = 1 × 10⁻⁸, difference between the HH and LL set. Box plots as defined in Fig. 4d.
Extended Data Fig. 6. Examples of DNA methylation associated with gene expression and dependencies in cell lines.
a, t-SNE plot for DNA methylation data across all CCLE cell lines. Each dot represents a cell line coloured by cell lineage. b, Distribution of mean CpG methylation in CCLE cell lines (n = 843) grouped by cancer type. Box plots as defined in Fig. 4d. c, Correlation of promoter methylation and gene expression for all genes corrected for cancer type (n = 836 cell lines, 18,296 genes). The y axis represents the number of genes, and the x axis is the linear regression coefficient corresponding to normalized promoter DNA methylation. Cancer types were used as covariates in the linear regression analysis. A subset of genes show significant correlation between higher promoter methylation and lower gene expression (n = 7,388; permutation test P < 0.05; Methods). Dotted line shows the empirical null distribution. d, Cell lines with higher levels of RPP25 methylation show decreased RPP25 mRNA expression (Pearson’s r = −0.79, n = 834 cell lines; P < 2.2 × 10⁻¹⁶). e, Comparison of Achilles RNAi RPP25 gene dependency scores for cell lines with and without truncating mutation or copy number loss in POP7 or RPP25L genes (n = 458 cell lines; P = 0.74, two-sided Wilcoxon rank sum test). Box plots as defined in Fig. 4d. f, Cell lines with higher levels of LDHB methylation show decreased LDHB mRNA expression (Pearson’s r = −0.80, n = 815 cell lines; P < 2.2 × 10⁻¹⁶). g, Cell lines with higher levels of LDHA methylation show decreased LDHA expression. Two cell lines, SK-N-BE2 and U-251-MG, show markedly higher LDHA methylation and decreased LDHA expression (Pearson’s r = −0.27, n = 836; P = 5.34 × 10⁻¹⁶). h, Cell lines with high levels of LDHA methylation display sensitivity to LDHB knockout by CRISPR–Cas9 screening (Pearson’s r = −0.53, n = 371, P < 2.2 × 10⁻¹⁶). i, Promoter methylation versus mRNA expression correlations in TCGA tumour types (sample sizes shown in parentheses). *P < 0.001, Pearson’s correlation test. j, Scatterplot of CCLE lines comparing expression of tumour suppressor VHL (Von Hippel-Landau) mRNA versus VHL methylation (left, all cell lines) and copy number (right, kidney subset). VHL hypermethylation in three kidney cell lines is associated with marked loss of VHL expression. VHL is inactivated by DNA copy number loss, somatic mutation, and promoter hypermethylation.
Extended Data Fig. 7. Global chromatin profiling dataset.
a, Unsupervised clustering of global chromatin profiling data for 897 CCLE cell lines. Each column corresponds to an individual cell line and each row corresponds to a specific combination of chromatin post-translational modifications (‘marks’). For each mark, the fold change relative to median of cell lines is depicted on the heat map. EZH2, NSD2, CREBBP and EP300 status are annotated. Previously described clusters (associated with EZH2 gain of function, EZH2 loss of function, and NSD2 alterations), as well as the newly identified cluster associated with p300 and CBP gain-of-function alterations, are annotated. b, Volcano plot for truncating mutation enrichment analysis in the newly identified cluster, characterized by marked increases in H3K18 and H3K27 acetylation is shown (n = 893 cell lines; adjusted P values determined by two-sided Fisher’s exact test). EP300 and CREBBP are the top two genes with truncating mutations enriched in this cluster. Only genes with at least 20 affected cell lines (n = 684 genes) were included. c, Distribution of truncating mutations affecting EP300 and CREBBP in the 10 cell lines in the newly identified p300/CBP cluster. Truncating mutations predicted to affect the TAZ2 (CH3) domain specifically are highlighted. Two other truncating mutations not specific to TAZ2 (CH3) are OVCAR-8 (S893*) and COLO-704 (K1469fs).
Extended Data Fig. 8. Comparison of CCLE gene expression data with primary tumour (TCGA) and normal tissue (GTEX) gene expression datasets.
a, Comparison of gene expression profiles between the CCLE cell lines (n = 1,019) and TCGA primary tumours (n = 10,535). For every gene in each dataset, expression values were averaged per cancer type and then mean centred across types. Pearson correlation values were calculated between the CCLE and TCGA cancer types using the (n = 5,000) most highly variable genes. b, Comparison of average gene expression profiles between the CCLE cell lines (n = 1,019) and the GTEx normal tissues (n = 11,688). Similar to a, expression profiles for each tissue type in GTEx was correlated with the CCLE expression profiles (n = 5,000 genes). c, Gene expression comparison of eight prostate cell lines and TCGA primary tumour samples (n = 5,000 genes). d, Gene expression comparison of eight prostate cell lines and GTEx normal tissue samples (n = 5,000 genes).
Extended Data Fig. 9. MDM4 alternative splicing and association with RPL22 and RPL22L1.
a, Distribution of MDM4 exon 6 inclusion (left) and MDM4 mRNA expression (right) correlation with all gene dependencies in the Achilles RNAi dataset (n = 189–478; Supplementary Table 10). b, Correlation of MDM4 exon 6 inclusion with sensitivity to all small molecules in the CTRP AUC dataset using all cell lines. Nutlin-3a is the top drug sensitivity correlated with MDM4 exon 6 inclusion (n = 79–810; Supplementary Table 10). c, Example of nutlin-3a sensitivity versus MDM4 exon 6 inclusion in the AML cell lines (Spearman correlation rho = −0.64, P = 3 × 10⁻⁴, n = 28). The y axis shows AUC for nutlin-3a in the CTRP dataset. d, Scatterplot of MDM4 exon 6 inclusion versus RPL22L1 expression for all p53-mutant (left, n = 711) and p53 wild-type (right, n = 288) CCLE cell lines. P values determined by Pearson’s correlation test. e, Frequency of RPL22 recurrent frameshift mutations (left) and copy number deletions (right) in TCGA. f, Frequency of RPL22 recurrent frameshift mutations (left) and copy number deletions (right) in CCLE. g, Correlation of RPL22L1 mRNA expression with RPL22 copy number loss and RPL22 frameshift deletions in TCGA. P value determined by two-sided Kruskal–Wallis rank sum test. Box plots as defined in Fig. 4d. Values in parentheses denote sample size in each category. h, Correlation of MDM4 exon 6 inclusion with RPL22 copy number loss and RPL22 frameshift deletions in TCGA. P value determined by two-sided Kruskal–Wallis rank sum test. Box plots are as defined in Fig. 4d. Values in parentheses denote sample size in each category. i, Selected genomic features that correlate with sensitivity to MDM4 shRNA knockdown. mRNA expression of MDM4 and TP53 are shown for comparison.
Extended Data Fig. 10. Examples of microRNA expression associated with gene dependencies in cell lines.
a, t-SNE plot for miRNA data across all CCLE cell lines. Each dot represents a cell line. Each colour represents a different cell lineage. Colour coding is as in Fig. 1. b, Scatter plot of pairwise Pearson’s correlation of gene dependency and miRNA expression (n = 420 cell lines), normalized for each microRNA (z1, x axis) and each gene dependency (z2, y axis). Strong outlier pairs with |z1|>6 or |z2|>6 are highlighted. c, Distribution of Pearson’s correlations of mir-215 expression with Achilles RNAi gene dependencies for 16,871 genes (n = 162–420 cell lines; Supplementary Table 13). CTNNB1 knockdown is the top negative correlate with mir-215 expression. d, Distribution of Pearson’s correlations of CTNNB1 gene dependency with all 734 measured miRNAs (n = 420 cell lines). The expression of mir-215 is the top gene negatively correlated with CTNNB1 dependency. mir-215 and mir-194–1 cluster together at 1q41, whereas mir-192 and mir-194–2 cluster at 11q13.1. mir-215 and mir-192 are close homologues. e, Scatterplot of mir-215 expression versus CTNNB1 dependency of all CCLE cell lines. Colon and stomach lineages are shown in blue and red, respectively. f, Scaled mir-215 expression in TCGA and CCLE datasets (n = 14; mean ± s.e.m.). Stomach and colorectal lineages in both datasets have high mir-215 expression. g, Single-sample gene set enrichment analysis identifies TGFB1 and WNT3A pathway gene sets correlated with mir-215 expression using CCLE RNA-seq data. The gene set ‘Labbe targets of TGFB1 and WNT3A’ of downstream targets of TGF-β and WNT ligands is negatively correlated with mir-215 expression. h, The gene set ‘Labbe targets of TGFB1 and WNT3A’ is negatively correlated with mir-215 expression in the TCGA stomach mRNA expression dataset. i, The gene set ‘Vecchi gastric advanced vs early dn’ of down-regulated genes distinguishing between advanced and early gastric cancer subtypes is positively correlated with mir-215 expression in the CCLE. j, mir-215 expression in the stomach TCGA mRNA expression dataset is positively correlated with the ‘Vecchi gastric advanced vs early dn’ gene set.
Extended Data Fig. 11. RPPA analysis.
a, Distribution of Pearson’s correlation coefficient between total protein levels as measured by RPPA and mRNA expression levels measured by RNA-seq (n = 890 cell lines, 154 genes). The empirical null distribution for correlation of mRNA and protein for two random genes is shown for comparison (P < 2.2 × 10⁻¹⁶, two-sided Wilcoxon rank sum test). b, Effect of RPPA dynamic range on mRNA and protein correlation (n = 96). mRNA and protein correlation is plotted against dynamic range for each validated total protein antibody. Most antibodies with low mRNA and protein correlation tend to have low dynamic range with the exception of VEGFR2 gene, which despite high dynamic range, exhibits very low mRNA and protein correlation. P values determined by two-sided Pearson’s correlation test. c, Effect of RPPA antibody quality and target type on mRNA/protein correlation. On the left, mRNA/protein Pearson correlation is plotted for ‘validated’ (n = 96) and ‘with caution’ (n = 58) antibodies for antibodies against total proteins. On the right, mRNA and protein Pearson’s correlation is plotted for antibodies against total protein (n = 154) and antibodies against phospho-protein (n = 50). Median correlations are 0.62 (validated), 0.48 (caution), 0.54 (total protein), 0.21 (phospho-protein). P values determined by two-sided Wilcoxon rank sum test. Box plots are as defined in Fig. 4d. d, Comparison of mRNA and protein correlations in CCLE and TCGA (n = 152). The Pearson’s correlation between mRNA and protein levels is calculated for each RPPA antibody in CCLE and TCGA separately. Each dot represents an antibody. Generally, the antibodies with low mRNA and protein correlation in CCLE also have low mRNA and protein correlation in TCGA data. P values determined by two-sided Pearson’s correlation test. e, Distribution of gene dependency (Achilles RNAi) correlations with RPPA pSHP2 level (left, n = 161–411, Supplementary Table 14) and PTPN11 mRNA expression (right, n = 192–478, Supplementary Table 14). PTPN11 dependency is strongly correlated with pSHP2 level, whereas there is no significant correlation with PTPN11 mRNA level. f, Comparison of pSHP2 levels in SHP099-sensitive and -resistant cell lines (n = 60). P value determined by two-sided Wilcoxon rank sum test. SHP099 sensitivity data were obtained from ref.26. Box plots are as defined in Fig. 4d. g, Pearson’s correlation of pSHP2 and Sanger GDSC drug sensitivity AUC dataset (n = 265 drugs and 198–588 overlapping cell lines). h, Model error for elastic net model of sensitivity to ponatinib with and without using RPPA data as predictive features. The y axis shows the cross-validation error (fivefold cross validation) against parameter β of elastic net (parameter β is fixed at 0.2). Data are mean ± s.d. for the five cross validation (CV) sets. The minimum CV error for models with and without using RPPA data are shown by arrows. i, Elastic net results for sensitivity to ponatinib. pSHP2 is the top feature selected by elastic net. On the left, elastic net weights (averaged over 200 bootstrapping trials) and colour-coded by the frequency each feature was selected by elastic net. The numbers in parentheses are the frequency each feature was selected. Each column is a cell line and each row is a feature. The cell lines are sorted by their sensitivity to ponatinib (shown at the bottom). j, Western blot analysis of pSHP2 and total SHP2 levels across AML and select CML cell lines. Western blots were performed twice independently with similar results. k, Validation of RPPA data for pSHP2. pSHP2 levels measured by western blot are plotted against pSHP2 levels measured by RPPA for the tested AML and control CML cell lines (n = 19). The cell lines are colour-coded by their sensitivity to ponatinib. P values determined by two-sided Pearson’s correlation test. l, In vivo mouse xenograft experiment survival curves of ponatinib-treated and control mice for the low pSHP2 primagraft DFAM-68555. (n = 7 mice in each treatment group). P values determined by log-rank (Mantle-Cox) test. m, Immunohistochemistry of spleen specimens from mice treated with control or ponatinib for 5 days using anti-CD45. Similar results were found using the other two independent sets of mice.
Supplementary Material
Acknowledgements
We thank the Broad Genomics Platform, C. Clish, H. Bitter, A. Najafi and E. Orlando for their contribution. This work was supported by grants from Novartis and partially by NIH/NCI grants 1U01CA217842–01, 1P50CA217685–01, 5P50CA098258, 1U24CA180922–01, 1R50CA211461–01, CA16672, 1R01CA219943–01, 1U54CA224068–01, NIH U01 CA176058 and R21 DA025720. F.W.H. was supported by the Prostate Cancer Foundation. M.I. was supported by a Burroughs Wellcome Fund Career Award. G.G. was partially supported by the Paul C. Zamecnik, MD, Chair in Oncology at MGH. G.B.M. was supported by the Adelson medical research fund. Drug sensitivity results are in part based on data generated by Cancer Target Discovery and Development (CTD2) Network (https://ocg.cancer.gov/programs/ctd2/data-portal) established by the National Cancer Institute’s Office of Cancer Genomics.
Competing interests: J.M.K., M.D.J., D.A.P., F.S., E.R.M., J.L., R.S., J.B., A.D., K.V., A.R., J.G., G.C., M.L., A.K., M.P.M. and W.R.S. are current or former Novartis employees and/or stock holders. W.R.S. is a Board or SAB member and holds equity in Peloton Therapeutics and Ideaya Biosciences and has consulted for Array, Astex, Ipsen, Sanofi and Servier. B.A.W. is a J&J employee. F.S. and G.V.K. are KSQ Therapeutics employees. N.S. is an employee of Celsius Therapeutics. J.K. is a Tesaro employee. A.D.C. receives research support from Bayer AG. G.G. receives research support from IBM and Pharmacyclics and is an inventor on patent applications related to MuTect and ABSOLUTE. G.B.M. consults with AstraZeneca, ImmunoMET, Ionis, Nuevolution, PDX bio, Signalchem Lifesciences, Symphogen, and Tarveda, has stock options with Catena Pharmaceuticals, ImmunoMet, SignalChem, Spindle Top Ventures and Tarveda, has sponsored research funding from Adelson Medical Research Foundation, AstraZeneca, Breast Cancer Research Foundation, Immunomet, Komen Research Foundation, Pfizer, Nanostring, Tesaro, travel support from Chrysallis Bio, and has licensed technology to Nanostring and Myriad Genetics. T.R.G. is an advisor to GlaxoSmithKline, is a co-founder of Sherlock Biosciences, and was a co-founder and advisor to Foundation Medicine, Inc. W.C.H. is a consultant for Thermo Fisher, AjuIB, Paraxel and MPM Capital, and is a founder and consultant for KSQ Therapeutics. L.A.G. is an employee of Eli Lilly.
Footnotes
Publisher’s note: Springer Nature remains neutral with regard to jurisdictional claims in published maps and institutional affiliations.
References
- 1.Barretina J et al. The Cancer Cell Line Encyclopedia enables predictive modelling of anticancer drug sensitivity. Nature 483, 603–607 (2012). [DOI] [PMC free article] [PubMed] [Google Scholar]
- 2.Li H et al. The Landscape of Cancer Cell Line Metabolism. Nat. Med (2019). [Accepted, 10.1038/s41591-019-0404-8] [DOI] [PMC free article] [PubMed] [Google Scholar]
- 3.Iorio F et al. A landscape of pharmacogenomic interactions in cancer. Cell 166, 740–754 (2016). [DOI] [PMC free article] [PubMed] [Google Scholar]
- 4.Ben-David U et al. Genetic and transcriptional evolution alters cancer cell line drug response. Nature 560, 325–330 (2018). [DOI] [PMC free article] [PubMed] [Google Scholar]
- 5.Tsherniak A et al. Defining a cancer dependency Map. Cell 170, 564–576.e516 (2017). [DOI] [PMC free article] [PubMed] [Google Scholar]
- 6.McDonald ER III et al. Project DRIVE: a compendium of cancer dependencies and synthetic lethal relationships uncovered by large-scale, deep RNAi screening. Cell 170, 577–592.e510 (2017). [DOI] [PubMed] [Google Scholar]
- 7.Meyers RM et al. Computational correction of copy number effect improves specificity of CRISPR-Cas9 essentiality screens in cancer cells. Nat. Genet 49, 1779–1784 (2017). [DOI] [PMC free article] [PubMed] [Google Scholar]
- 8.Huang FW et al. Highly recurrent TERT promoter mutations in human melanoma. Science 339, 957–959 (2013). [DOI] [PMC free article] [PubMed] [Google Scholar]
- 9.Diouf B et al. Somatic deletions of genes regulating MSH2 protein stability cause DNA mismatch repair deficiency and drug resistance in human leukemia cells. Nat. Med 17, 1298–1303 (2011). [DOI] [PMC free article] [PubMed] [Google Scholar]
- 10.Marra G et al. Mismatch repair deficiency associated with overexpression of the MSH3 gene. Proc. Natl Acad. Sci. USA 95, 8568–8573 (1998). [DOI] [PMC free article] [PubMed] [Google Scholar]
- 11.Esakova O & Krasilnikov AS Of proteins and RNA: the RNase P/MRP family. RNA 16, 1725–1747 (2010). [DOI] [PMC free article] [PubMed] [Google Scholar]
- 12.Hands-Taylor KL et al. Heterodimerization of the human RNase P/MRP subunits Rpp20 and Rpp25 is a prerequisite for interaction with the P3 arm of RNase MRP RNA. Nucleic Acids Res. 38, 4052–4066 (2010). [DOI] [PMC free article] [PubMed] [Google Scholar]
- 13.Doherty JR & Cleveland JL Targeting lactate metabolism for cancer therapeutics. J. Clin. Invest 123, 3685–3692 (2013). [DOI] [PMC free article] [PubMed] [Google Scholar]
- 14.Herman JG et al. Silencing of the VHL tumor-suppressor gene by DNA methylation in renal carcinoma. Proc. Natl Acad. Sci. USA 91, 9700–9704 (1994). [DOI] [PMC free article] [PubMed] [Google Scholar]
- 15.Jaffe JD et al. Global chromatin profiling reveals NSD2 mutations in pediatric acute lymphoblastic leukemia. Nat. Genet 45, 1386–1391 (2013). [DOI] [PMC free article] [PubMed] [Google Scholar]
- 16.Creech AL et al. Building the Connectivity Map of epigenetics: chromatin profiling by quantitative targeted mass spectrometry. Methods 72, 57–64 (2015). [DOI] [PMC free article] [PubMed] [Google Scholar]
- 17.Sveen A, Kilpinen S, Ruusulehto A, Lothe RA & Skotheim RI Aberrant RNA splicing in cancer; expression changes and driver mutations of splicing factor genes. Oncogene 35, 2413–2427 (2016). [DOI] [PubMed] [Google Scholar]
- 18.Dewaele M et al. Antisense oligonucleotide-mediated MDM4 exon 6 skipping impairs tumor growth. J. Clin. Invest 126, 68–84 (2016). [DOI] [PMC free article] [PubMed] [Google Scholar]
- 19.Rallapalli R, Strachan G, Cho B, Mercer WE & Hall DJ A novel MDMX transcript expressed in a variety of transformed cell lines encodes a truncated protein with potent p53 repressive activity. J. Biol. Chem 274, 8299–8308 (1999). [DOI] [PubMed] [Google Scholar]
- 20.Gembarska A et al. MDM4 is a key therapeutic target in cutaneous melanoma. Nat. Med 18, 1239–1247 (2012). [DOI] [PMC free article] [PubMed] [Google Scholar]
- 21.Boutz PL, Bhutkar A & Sharp PA Detained introns are a novel, widespread class of post-transcriptionally spliced introns. Genes Dev. 29, 63–80 (2015). [DOI] [PMC free article] [PubMed] [Google Scholar]
- 22.Maruvka YE et al. Analysis of somatic microsatellite indels identifies driver events in human tumors. Nat. Biotechnol 35, 951–959 (2017). [DOI] [PMC free article] [PubMed] [Google Scholar]
- 23.Zhang Y et al. Ribosomal proteins Rpl22 and Rpl22l1 control morphogenesis by regulating pre-mRNA splicing. Cell Reports 18, 545–556 (2017). [DOI] [PMC free article] [PubMed] [Google Scholar]
- 24.Lu J et al. MicroRNA expression profiles classify human cancers. Nature 435, 834–838 (2005). [DOI] [PubMed] [Google Scholar]
- 25.Li J et al. Characterization of human cancer cell lines by reverse-phase protein arrays. Cancer Cell 31, 225–239 (2017). [DOI] [PMC free article] [PubMed] [Google Scholar]
- 26.Chen YN et al. Allosteric inhibition of SHP2 phosphatase inhibits cancers driven by receptor tyrosine kinases. Nature 535, 148–152 (2016). [DOI] [PubMed] [Google Scholar]
- 27.Wylie AA et al. The allosteric inhibitor ABL001 enables dual targeting of BCR-ABL1. Nature 543, 733–737 (2017). [DOI] [PubMed] [Google Scholar]
- 28.Haibe-Kains B et al. Inconsistency in large pharmacogenomic studies. Nature 504, 389–393 (2013). [DOI] [PMC free article] [PubMed] [Google Scholar]
- 29.The Cancer Cell Line Encyclopedia Consortium & The Genomics of Drug Sensitivity in Cancer Consortium. Pharmacogenomic agreement between two cancer cell line datasets. Nature 528, 84–87 (2015). [DOI] [PMC free article] [PubMed] [Google Scholar]
- 30.Haverty PM et al. Reproducible pharmacogenomic profiling of cancer cell line panels. Nature 533, 333–337 (2016). [DOI] [PubMed] [Google Scholar]
- 31.Geeleher P, Gamazon ER, Seoighe C, Cox NJ & Huang RS Consistency in large pharmacogenomic studies. Nature 540, E1–E2 (2016). [DOI] [PMC free article] [PubMed] [Google Scholar]
- 32.Bouhaddou M et al. Drug response consistency in CCLE and CGP. Nature 540, E9–E10 (2016). [DOI] [PMC free article] [PubMed] [Google Scholar]
- 33.Mpindi JP et al. Consistency in drug response profiling. Nature 540, E5–E6 (2016). [DOI] [PubMed] [Google Scholar]
- 34.Yu C et al. High-throughput identification of genotype-specific cancer vulnerabilities in mixtures of barcoded tumor cell lines. Nat. Biotechnol 34, 419–423 (2016). [DOI] [PMC free article] [PubMed] [Google Scholar]
- 35.King AJ et al. Abstract 2116: Combining the power of different profiling approaches to better understand the activity of kinase inhibitor drugs. Cancer Res. 77, 2116–2116 (2017). [Google Scholar]
- 36.Fisher S et al. A scalable, fully automated process for construction of sequence-ready human exome targeted capture libraries. Genome Biol. 12, R1 (2011). [DOI] [PMC free article] [PubMed] [Google Scholar]
- 37.Johannessen CM et al. A melanocyte lineage program confers resistance to MAP kinase pathway inhibition. Nature 504, 138–142 (2013). [DOI] [PMC free article] [PubMed] [Google Scholar]
- 38.Boyle P et al. Gel-free multiplexed reduced representation bisulfite sequencing for large-scale DNA methylation profiling. Genome Biol. 13, R92 (2012). [DOI] [PMC free article] [PubMed] [Google Scholar]
- 39.Brat DJ et al. Comprehensive, integrative genomic analysis of diffuse lower-grade gliomas. N. Engl. J. Med 372, 2481–2498 (2015). [DOI] [PMC free article] [PubMed] [Google Scholar]
- 40.Cancer Genome Atlas Research Network. Integrated genomic characterization of papillary thyroid carcinoma. Cell 159, 676–690 (2014). [DOI] [PMC free article] [PubMed] [Google Scholar]
- 41.Cibulskis K et al. Sensitive detection of somatic point mutations in impure and heterogeneous cancer samples. Nat. Biotechnol 31, 213–219 (2013). [DOI] [PMC free article] [PubMed] [Google Scholar]
- 42.Lek M et al. Analysis of protein-coding genetic variation in 60,706 humans. Nature 536, 285–291 (2016). [DOI] [PMC free article] [PubMed] [Google Scholar]
- 43.Van der Auwera GA et al. From FastQ data to high confidence variant calls: the Genome Analysis Toolkit best practices pipeline. Curr. Protoc. Bioinformatics 43, 11.10.11–11.10.33 (2013). [DOI] [PMC free article] [PubMed] [Google Scholar]
- 44.Wala JA et al. SvABA: genome-wide detection of structural variants and indels by local assembly. Genome Res. 28, 581–591 (2018). [DOI] [PMC free article] [PubMed] [Google Scholar]
- 45.Haas B et al. STAR-Fusion: fast and accurate fusion transcript detection from RNA-seq. Preprint available at: https://www.bioRxiv.org/content/10.1101/120295v1 (2017).
- 46.Kasar S et al. Whole-genome sequencing reveals activation-induced cytidine deaminase signatures during indolent chronic lymphocytic leukaemia evolution. Nat. Commun 6, 8866 (2015). [DOI] [PMC free article] [PubMed] [Google Scholar]
- 47.Kim J et al. Somatic ERCC2 mutations are associated with a distinct genomic signature in urothelial tumors. Nat. Genet 48, 600–606 (2016). [DOI] [PMC free article] [PubMed] [Google Scholar]
- 48.The Cancer Genome Atlas Research Network. Comprehensive and Integrated Genomic Characterization of Adult Soft Tissue Sarcomas. Cell 171, 950–965.e928 (2017). [DOI] [PMC free article] [PubMed] [Google Scholar]
- 49.Haradhvala NJ et al. Distinct mutational signatures characterize concurrent loss of polymerase proofreading and mismatch repair. Nat. Commun 9, 1746 (2018). [DOI] [PMC free article] [PubMed] [Google Scholar]
- 50.Carter SL et al. Absolute quantification of somatic DNA alterations in human cancer. Nat. Biotechnol 30, 413–421 (2012). [DOI] [PMC free article] [PubMed] [Google Scholar]
- 51.Krueger F & Andrews SR Bismark: a flexible aligner and methylation caller for Bisulfite-Seq applications. Bioinformatics 27, 1571–1572 (2011). [DOI] [PMC free article] [PubMed] [Google Scholar]
- 52.Akalin A et al. methylKit: a comprehensive R package for the analysis of genome-wide DNA methylation profiles. Genome Biol. 13, R87 (2012). [DOI] [PMC free article] [PubMed] [Google Scholar]
- 53.Ziller MJ et al. Charting a dynamic DNA methylation landscape of the human genome. Nature 500, 477–481 (2013). [DOI] [PMC free article] [PubMed] [Google Scholar]
- 54.van der Maaten L & Hinton G Visualizing high-dimensional data using t-SNE. J. Mach. Learn. Res 9, 2579–2605 (2008). [Google Scholar]
- 55.Szklarczyk D et al. STRING v10: protein-protein interaction networks, integrated over the tree of life. Nucleic Acids Res. 43, D447–D452 (2015). [DOI] [PMC free article] [PubMed] [Google Scholar]
- 56.Cerami E et al. The cBio cancer genomics portal: an open platform for exploring multidimensional cancer genomics data. Cancer Discov. 2, 401–404 (2012). [DOI] [PMC free article] [PubMed] [Google Scholar]
- 57.Gao J et al. Integrative analysis of complex cancer genomics and clinical profiles using the cBioPortal. Sci. Signal 6, pl1 (2013). [DOI] [PMC free article] [PubMed] [Google Scholar]
- 58.Dobin A et al. STAR: ultrafast universal RNA-seq aligner. Bioinformatics 29, 15–21 (2013). [DOI] [PMC free article] [PubMed] [Google Scholar]
- 59.DeLuca DS et al. RNA-SeQC: RNA-seq metrics for quality control and process optimization. Bioinformatics 28, 1530–1532 (2012). [DOI] [PMC free article] [PubMed] [Google Scholar]
- 60.Consortium GT et al. Genetic effects on gene expression across human tissues. Nature 550, 204 (2017). [DOI] [PMC free article] [PubMed] [Google Scholar]
- 61.Ritchie ME et al. limma powers differential expression analyses for RNA-sequencing and microarray studies. Nucleic Acids Res. 43, e47 (2015). [DOI] [PMC free article] [PubMed] [Google Scholar]
- 62.Smyth GK Linear models and empirical bayes methods for assessing differential expression in microarray experiments. Stat. Appl. Genet. Mol. Biol 3, Article3 (2004). [DOI] [PubMed] [Google Scholar]
- 63.Akbani R et al. A pan-cancer proteomic perspective on The Cancer Genome Atlas. Nat. Commun 5, 3887 (2014). [DOI] [PMC free article] [PubMed] [Google Scholar]
- 64.Friedman J, Hastie T & Tibshirani R Regularization paths for generalized linear models via coordinate descent. J. Stat. Softw 33, 1–22 (2010). [PMC free article] [PubMed] [Google Scholar]
Associated Data
This section collects any data citations, data availability statements, or supplementary materials included in this article.
Supplementary Materials
Data Availability Statement
All the CCLE processed datasets are available at the CCLE portal (www.broadinstitute.org/ccle) and DepMap portal (http://www.depmap.org). Raw sequencing data are available at Sequence Read Archive (SRA) under accession number PRJNA523380. Achilles RNAi data (DEMETER scores) were downloaded from https://portals.broadinstitute.org/achilles. Achilles CRISPR Avana 18Q3 public dataset (gene effects, CERES scores) was downloaded from https://figshare.com/articles/DepMap_Achilles_18Q3_public/6931364/1. Novartis Project DRIVE RNAi dataset (ATARiS scores) was obtained from the Project DRIVE authors. CTRP AUC scores was downloaded from the NCI website (ftp://caftpd.nci.nih.gov/pub/OCG-DCC/CTD2/Broad/CTRPv2.0_2015_ctd2_ExpandedDataset). Sanger GDSC drug sensitivity (AUC and IC50 scores) were downloaded from the Sanger website (https://www.cancerrxgene.org/downloads).


