Abstract
Understanding the response of solid materials to shock loading is important for mitigating shock-induced damages and failures, as well as advancing the beneficial use of shock waves for material modifications. In this paper, we consider a representative brittle material, BegoStone, in the form of cylindrical bodies and submerged in water. We present a computational study on the causal relationship between the prescribed shock load and the resulting elastic waves and damage in the solid material. A recently developed three-dimensional computational framework, FIVER, is employed, which couples a finite volume compressible fluid solver with a finite element structural dynamics solver through the construction and solution of local, one-dimensional fluid-solid Riemann problems. The material damage and fracture are modeled and simulated using a continuum damage mechanics model and an element erosion method. The computational model is validated in the context of shock wave lithotripsy and the results are compared with experimental data. We first show that after calibrating the growth rate of microscopic damage and the threshold for macroscopic fracture, the computational framework is capable of capturing the location and shape of the shock-induced fracture observed in a laboratory experiment. Next, we introduce a new phenomenological model of shock waveform, and present a numerical parametric study on the effects of a single shock load, in which the shock waveform, magnitude, and the size of the target material are varied. In particular, we vary the waveform gradually from one that features non-monotonic decay with a tensile phase to one that exhibits monotonic decay without a tensile phase. The result suggests that when the length of the shock pulse is comparable to that of the target material, the former waveform may induce much more significant damage than the latter one, even if the two share the same magnitude, duration, and acoustic energy.
Keywords: shock wave, fluid-solid interaction, damage and fracture, lithotripsy
1. Introduction
The response of solid materials and structures to shock loading is a long-standing and active research area, motivated mainly by two categories of applications. The first category concerns the prevention and mitigation of shock-induced damages and failures, such as the design of protective structural materials, coatings, and devices [1, 2, 3, 4]. The second category aims to use carefully designed shock waves to achieve desired material modifications. Examples include, but are not limited to, shock wave lithotripsy, a first-line therapy of urinary stone disease [5, 6], “dynamic fracturing” for oil and natural gas extraction [7, 8], and the use of “acoustic sparkers” for biofouling control [9, 10]. A common feature in these applications is that the boundary between beneficial effects (e.g., fracture of a urinary stone) and detrimental effects (e.g., injury of urinary tissue) is often very narrow, which requires a clear understanding and predictive capability regarding the shock-material interaction and the resulting material damage and fracture.
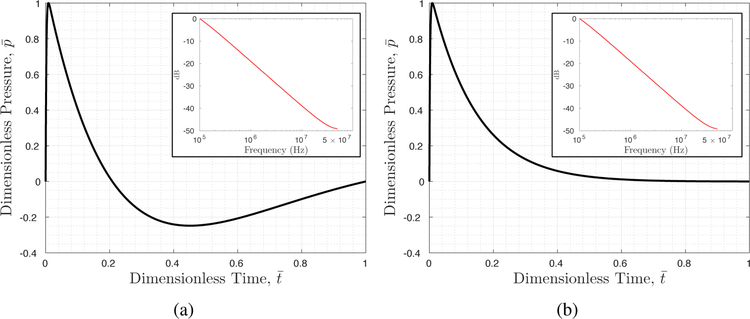
The waveform, magnitude, and duration of a shock wave depend critically on the generation method, the parameters specified therein, and the surrounding medium. In particular, two distinct waveforms are often observed in practical applications: one that features a non-monotonic decay with a tensile phase (Figure 1(a)), and one that exhibits monotonic decay, without a tensile phase (Figure 1(b)). The former waveform can be generated, for example, by focusing a planar acoustic wave using a lens and through nonlinear wave propagation [11], while the latter can be obtained by inducing a rapid bubble expansion through detonation [12] or laser [13]. Previous studies have often focused on analyzing specific model problems in which the shock waveform — and in many cases, also the magnitude and duration — is fixed (e.g., [14, 15, 16, 17, 18, 19]). Nonetheless, comparing the impact of shock waves with different waveforms, magnitude, and duration to solid materials is intellectually valuable, and may provide new insights into applications that require “shock wave by design”. To this end, we present in this paper a computational study, using a representative brittle material, namely BegoStone [20], in the form of a cylindrical body that is submerged in water. BegoStone is a commercial dental material, composed of primarily gypsum (99%), supplemented with iron and potassium oxides to increase its strength [21]. Its acoustic and mechanical properties can be tuned easily by varying the powder-to-water ratio [22]. It has been used as a model material for studying shock-induced damages and failures, mainly in the context of shock wave lithotripsy [23].
Figure 1.
Two shock waves with the same magnitude (i.e., peak pressure), the same acoustic pulse energy, similar spectrum, approximately the same duration, yet clearly different waveforms: (a) with non-monotonic decay and a tensile phase; (b) with monotonic decay, without a tensile phase.
To simulate the shock-dominated fluid-solid interaction problem, we employ a recently developed three-dimensional computational framework, referred to as FIVER (a FInite Volume method with Exact fluid-solid Riemann solvers) [24, 25, 26, 27, 28]. FIVER couples a finite volume compressible fluid solver with a finite element structural dynamics solver using a second-order accurate partitioned procedure [24]. It enforces the continuity of velocity1 and traction at the fluid-solid interface using an embedded boundary method, which features the construction and solution of one-dimensional fluid-solid Riemann problems [25, 26]. Because the embedded boundary method operates on non body-fitted CFD grids, it is particularly suitable for analyzing shock-induced dynamic fracture. In the past, FIVER has been verified and validated for several shock-dominated fluid-solid interaction problems including the collapse and rupture of thin-walled metal structures [29, 30, 31] and cavitation-induced material damage [32]. It has also been applied to a few other problems featuring large structural deformation and unsteady viscous flow [33, 34, 35].
In this work, we extend FIVER to model and simulate shock-induced damage and fracture in a brittle material, using a continuum damage mechanics model and an element erosion method. The basic idea is to use a scalar damage state variable, D(X, t), to represent small-scale damages (e.g., microcracks) that cannot be explicitly resolved by the computational grid. Accordingly, the material’s elastic modulii are adjusted on the fly to reflect the local and gradual degradation caused by the damages. The growth of D in time is modeled using a truncated power-law function of maximum principal stress. Once D exceeds a critical value within an element, the element is deleted from the structural system [31]. Whereas the literature of continuum damage mechanics is rich, and offers more sophisticated models [36], the one employed in this work — sometimes referred to as the Tuler-Butcher model after [37] — has demonstrated the capability of reproducing experimentally observed fracture in plaster of Paris [18], glass [38], and BegoStone [39], when its parameters are calibrated using the same experiment. We first show that after calibration, the computational framework is capable of capturing the location and shape of the shock-induced fracture observed in our laboratory experiment. Based on the computational result, we discuss the causal relationship among the shock load, the elastic body and surface waves, and the resulting damage and fracture. Next, we present a new phenomenological model of shock waveform, which can model the two distinct waveforms mentioned above and allows the smooth transition in between. Using this model, we perform a series of parameter studies to examine the effects of shock waveform and magnitude, as well as the size of the target material.
It should be mentioned that many shock wave applications, including those mentioned above, involve cavitation. The detailed effects of cavitation on material damage and fracture is still an active research topic (e.g., [40, 41]). In this work, we focus on investigating the interaction of a prescribed shock wave and a solid material. Cavitation is not included in the computational model. The validation experiment is also designed to suppress shock-induced cavitation.
The remainder of this paper is organized as follows. Section 2 summarizes the physical model and numerical methods, including the main features of the FIVER framework. Section 3 discusses the calibration and validation of the continuum damage mechanics model using a laboratory experiment. Section 4 presents the new model of shock waveform. Section 5 presents the aforementioned parameter study, and discusses the results. Finally, a summary and some concluding remarks are provided in Section 6.
2. Physical Model and Numerical Methods
2.1. Governing and constitutive equations
We consider the model problem illustrated in Figure 2. ΩF and ΩS denote the fluid and solid subdomains occupied by liquid water and BegoStone, respectively. Given that this is a shock-dominated problem, the fluid is assumed to be compressible and inviscid, governed by the following Euler equations which formulate the conservation of mass, momentum, and energy.
| (1) |
where
is the conservative state vector. t denotes time, ρ the fluid density, and V = [u, v, w]T the fluid velocity vector. denotes total energy per unit mass, in which e represents internal energy per unit mass.
is the flux vector, where I denotes the 3 × 3 identity matrix.
Figure 2.
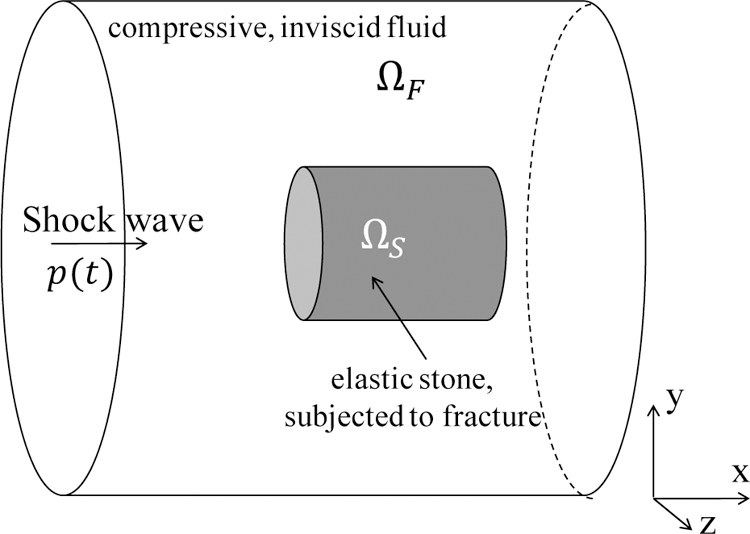
A model problem.
To close the above system of equations, we adopt the stiffened equation of state (EOS) [42], given by
| (2) |
The model parameters γL and pL are set to γL = 6.12, pL = 343 MPa for liquid water, after [43] and [32].
The solid material is assumed to be in the form of a cylindrical body, subjected to a prescribed shock load along its axial direction (Figure 2). The governing equations of dynamic equilibrium are given by
| (3) |
where u denotes the displacement of the solid, ρs its density, and σ the Cauchy stress tensor. The body force, b, is assumed to be zero in this work. The dot above a variable represents partial derivative with respect to time.
Previous studies have shown that fabricated BegoStone models can be considered as isotropic, and undergo brittle fracture under shock loading [22, 23]. Therefore, it is modeled here as a linear elastic and isotropic solid; and the constitutive equation is given by
| (4) |
where
is the infinitesimal strain tensor. E and ν denote the material’s Young’s modulus and Poisson’s ratio, respectively.
The fluid-solid interface, , is assumed to be impermeable, and governed by two interface conditions,
| (5) |
and
| (6) |
which enforce continuity of normal velocity and traction. n denotes the outward unit normal to ΓFS.
The incident shock wave p(t) can be applied either as a boundary condition or as an initial condition of the fluid governing equations [44]. The latter method is applied in this work. Specifically, p(t) is converted into a pressure distribution in space by replacing t by −x/c0, where x is the spatial coordinate in the direction of shock propagation (Figure 2), and c0 is the speed of sound in water, calculated using the equation of state (Equation (2)) and the ambient fluid state. Then, the x-component of the initial fluid velocity is set by
| (7) |
to enforce the incident shock wave, where p0 denotes ambient fluid pressure.
2.2. A continuum damage mechanics model
We introduce a scalar damage state variable, D(X, t) ∈ [0, 1), to represent small-scale material damages that cannot be resolved by the computational solid dynamics mesh. The two limit values, 0 and 1, indicate the initial undamaged state and the final completely damaged state, respectively. In the current context of an isotropic, linear elastic material, the constitutive equation is modified by scaling Young’s modulus linearly, i.e.
| (8) |
where E0 is the Young’s modulus of the material without damage. The material’s Poisson’s ratio remains a constant. The growth of damage in time is modeled by a power-law function proposed by Tuler and Butcher[37], i.e.
| (9) |
where σ1 denotes the maximum principal stress. , s and are constant model parameters that are usually determined empirically[45, 46, 47, 48]. It is assumed that the material starts to fracture when D exceeds a critical value, Dc.
2.3. Numerical methods
In this work, a recently developed computational framework is extended to solve the above coupled problem, which couples a finite volume CFD solver with a finite element CSD solver using an embedded boundary method and a partitioned procedure. At the embedded fluid-solid interface, the kinematic interface condition (Equation (5)) is enforced through the construction and solution of a one-dimensional fluid-solid Riemann problem [25], while the dynamic condition (Equation (6)) is enforced by transferring distributed fluid-induced loads to the finite element model using the method presented in [49].
2.3.1. FIVER: A finite volume method based on exact Riemann solvers
We discretize the augmented fluid domain , defined by , using a finite volume mesh, denoted by (Figure 3), where h designates the resolution of this discretization. is non-interface-conforming in the sense that it does not contain a native representation — comprised of element sides or control volume facets — of the solid material surface ΓFS.
Figure 3.
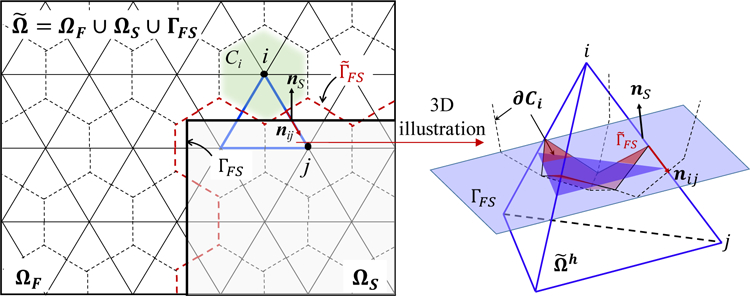
Illustration of the augmented fluid domain EQU and the non-interface-conforming finite volume mesh EQU. In the left figure, the triangles with solid thin boundaries represent the elements in EQU and the hexagons with dashed boundaries represent the control volumes or cells. The tetrahedron on the right is the 3D illustration of the element.
Integrating Equation (1) over a control volume, Ci, yields
| (10) |
where Wi denotes the average of W in Ci, ǁCiǁ denotes the volume of Ci, Nei(i) denotes the set of nodes connected to node i by an edge, , and nij is the unit normal to ∂Cij. Notably, when edge i-j intersects the embedded fluid-solid interface, the numerical approximation of the surface integral in Equation (10) is based on the exact solution of a one-dimensional fluid-solid Riemann problem. Specifically, if node i belongs to the fluid subdomain, and j belongs to the solid subdomain (Figure 3), the following one-dimensional Euler equations with a constant initial condition and a moving wall boundary condition is introduced.
| (11) |
| (12) |
| (13) |
where nS denotes the unit normal of ΓFS at its intersection with edge i-j. ξ is the spatial coordinate along the one-dimensional axis aligned with nS and centered at the midpoint between nodes i and j. The initial state wi is the projection of Wi on nS , i.e.
| (14) |
v is the velocity component of the 1D fluid state vector w. denotes the velocity of the solid at τ = 0. The exact solution of this Riemann problem can be derived analytically, and the state variable at the fluid-solid interface is plugged into the numerical flux function, thereby enforcing the first fluid-solid interface condition, Equation (5). The resulting semidiscretization of Equation (1) can be written in a compact form as
| (15) |
where Wh, V, and F(Wh) denote the vector of semidiscrete fluid state variable, the diagonal matrix storing the volume of control volumes, and the vector of numerical flux, respectively.
2.3.2. A Finite Element CSD Solver
A standard Galerkin finite element method is applied to semi-discretize the weak form of Equation (3), which yields
| (16) |
where M denotes the mass matrix, uh denotes the discrete displacement vector. fint and fext denote the discrete internal force and external force vector, respectively. The fluid-induced forces are computed based on the second fluid-solid interface condition, Equation (6). Specifically, at the end of each time step, the nodal values of fluid pressure p are linearly extrapolated to the Gauss points of the discretized embedded interface, then integrated over each element of the surface. Figure 4 provides an illustration of this method, while additional details can be found in Section 3.8.3 of [49].
Figure 4.
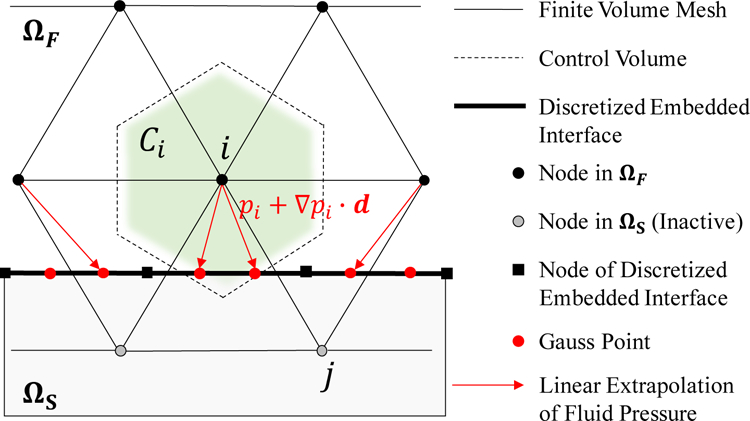
Schematic for the computation of fluid pressure force on the discretized embedded interface.
The initiation and propagation of dynamic fracture are simulated using an element erosion method. At any time instance, the scalar damage variable D is assumed to have a constant value within each element. When its value exceeds Dc, the stress in this element is set to zero and the element is deleted from the finite element model.
2.3.3. Staggered Time-Integration
The semidiscrete fluid and solid governing equations, Equations (15) and (16), are integrated using a staggered time-integrator presented in [24] (Figure 5). Specifically, the fluid equations are integrated using the explicit fourth-order accurate Runge-Kutta scheme, while the solid equations are integrated using the second-order accurate explicit central difference method. Notably, the fluid and solid time steps are offset by half a step. This feature is designed to allow the coupled time-integrator to achieve second-order accuracy, while maintaining numerical stability.
Figure 5.
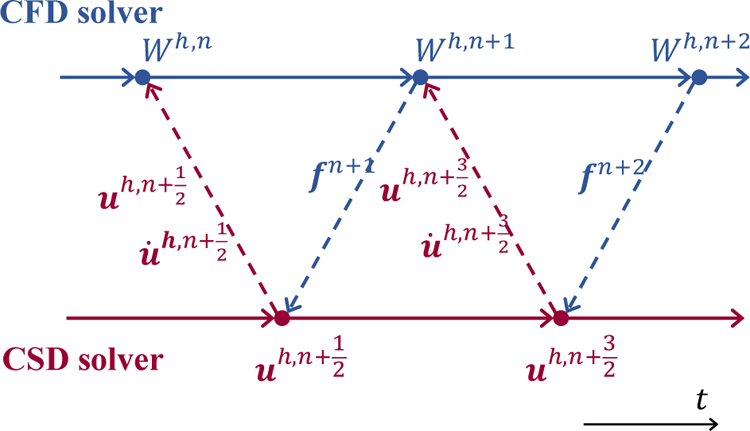
A staggered, second-order accurate fluid-solid time-integrator.
3. Numerical simulation of a shock wave lithotripsy experiment
We apply the computational framework described in Section 2 to simulate a dynamic fracture experiment featuring the use of shock waves generated by an electromagnetic (EM) lithotripter to break a cylindrical BegoStone submerged in water. The objective is twofold: to calibrate the parameters of the continuum damage mechanics model, and to explain, using numerical results, the causal relationship of the prescribed shock wave, the shock-induced elastic waves in the solid material, and the resulting damage and fracture.
3.1. Experiment
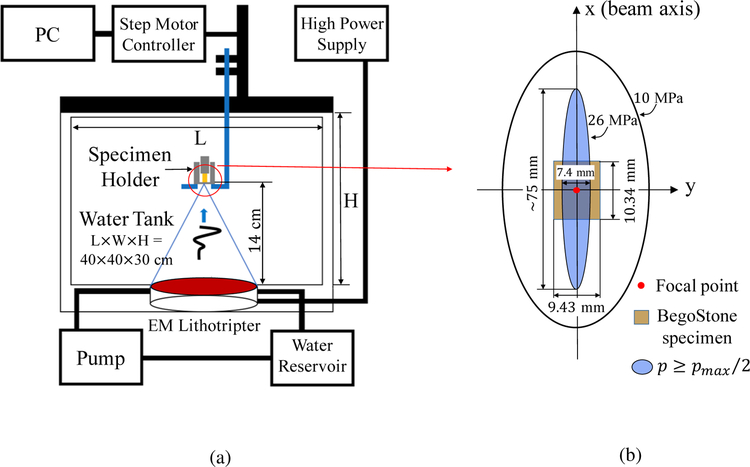
Figure 6 presents a schematic drawing of the experimental setup, with additional details provided in the Appendix. An electromagnetic acoustic transducer (EMAT) is used to generate pulsed planar waves. Each planar wave is then transformed into a shock wave with maximum pressure pmax = 52.0 MPa, using a specially designed focusing lens. The target specimen is placed within the focal area of the lens, largely overlapping with the −6 dB focal zone, in which the peak pressure exceeds pmax/2. To suppress cavitation, the specimen holder is filled with 1,3-butanediol which has similar acoustic properties to water but higher viscosity [50].
Figure 6.
Schematic drawing of experimental setup.
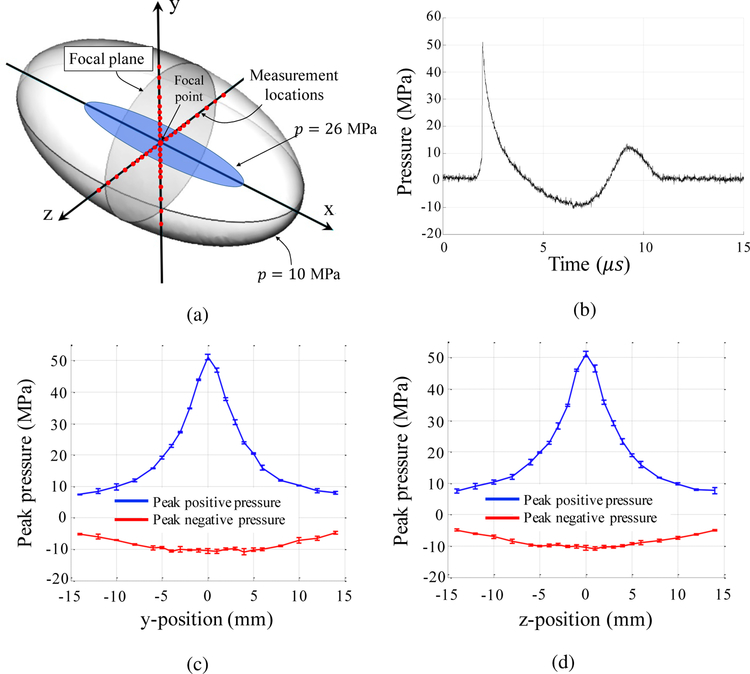
To characterize the shock waveform within the focal zone, we use a high-resolution fiber optic probe hydrophone to measure the pressure history at 41 locations distributed along y- and z-axes, shown in Figure 7. The result shows that the shock wave features a non-monotonic decay and a tensile phase, with a duration of approximately 10 µs. The peak pressure of the tensile phase is −11.0 MPa.
Figure 7.
Characterization of shock waveform at focal plane perpendicular to the beam axis, using a fiber optic hydrophone (RP Acoustics FOPH 500): (a) A schematic drawing showing the distribution of 41 locations where pressure time-history is measured. (b) The pressure waveform measured at the focal point. (c) Variation of peak pressure along the y-axis, with error bars. (d) Variation of peak pressure along the z-axis, with error bars.
Eight (8) cylindrical BegoStone specimens are fabricated using an established procedure [22], with a powder-to-water mixing ratio of 5:1. One example is shown in Figure 8(a). For this mixing ratio, the previous study ([22]) has measured the material’s elastic properties and tensile strength under static loading. These parameter values, and the dimensions of the specimens, are shown in Table 1.
Figure 8.
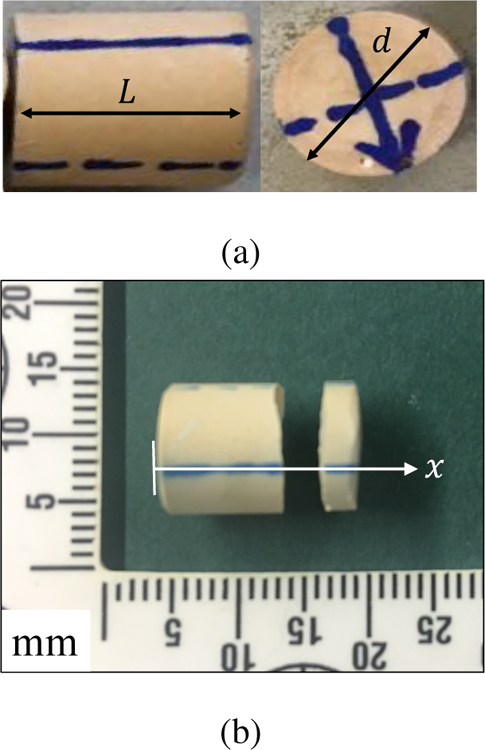
The BegoStone specimen. (a) A specimen before testing. (b) A specimen after first fracture.
Table 1:
Material properties and dimensions of the cylindrical BegoStone specimens.
| Material properties of BegoStone (powder-to-water ratio 5:1, dry) [22] | Dimensions | ||||||
|---|---|---|---|---|---|---|---|
| CL (m/s) | CT (m/s) | ρ (kg/m3) | E (GPa) | ν | Static Strength (MPa) | L (mm) | d (mm) |
| 4159 | 2319 | 1995 | 27.4 | 0.27 | 16.3 | 10.34 (avg) | 9:43 (avg) |
CL: longitudinal wave speed; CT : transverse wave speed; ρ: density; E: Young’s modulus; ν: Poisson’s ratio; L: length; d: cross-section diameter.
The specimens are tested in a dry condition, that is, without being pre-soaked in water. In each test, shock waves of identical waveform are fired at a frequency of 0.5Hz until the first fracture, as showed in Figure 8(b), is produced. The frequency is sufficiently low such that the successive shock loads do not affect each other. For the 8 samples, 5 ± 2 (mean ± std. dev.) loads are required to produce the first fracture. For all of them, the initial fracture is found to be approximately planar, perpendicular to the stone axis, at 73 ± 3% of the stone length. Additional details are presented in the Appendix. Above all, the demonstrated capability of producing repeatable fracture location and shape in a brittle solid material through shock loading is remarkable.
3.2. Simulation setup
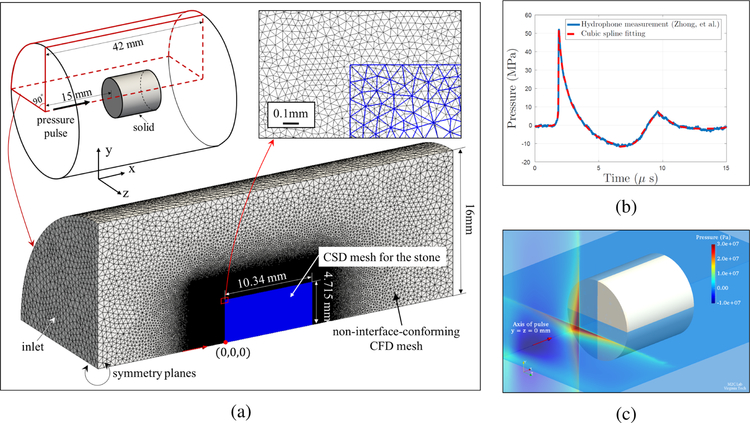
Figure 9(a) presents the setup of the numerical simulation, designed to simulate the above experiment. For the purposes of computational efficiency, a 90° slice of the cylindrical BegoStone is modeled, with symmetry boundary conditions applied to the two cut planes. Experimentally measured dimensions and material properties (Table 1) are applied. The model is discretized by a finite element CSD mesh with 1, 033, 202 nodes and 6, 027, 564 tetrahedron elements, with a characteristic element size (h) of 0.03 mm. The fluid computational domain, also a 90° slice of the actual 3D space, is discretized using a non-interface-conforming, unstructured CFD mesh with 3, 139, 728 nodes and 16, 246, 504 tetrahedron elements. In the most refined region — that is, near the solid — the characteristic element size is h = 0.05 mm. The far-field boundaries are set to be sufficiently far from the solid specimen such that wave reflections at the boundary do not affect the solid within the simulation time range.
Figure 9.
Simulation setup. (a) The computational domain and meshes (the computational fluid dynamics (CFD) and computational solid dynamics (CSD) meshes are shown in black and blue, respectively). (b) The cubic spline fitting of the shock waveform measured at the focal point. (c) The shock wave prescribed as an initial condition to the fluid governing equations.
The incident shock wave is considered axisymmetric, supported by the hydrophone measurements shown in Figures 7(c) and 7(d). The waveform along the centerline (i.e. the x-axis) is prescribed to be the cubic spline fit of the experimental data (Figure 7(b)). The radial decay shown in Figures 7(c) and 7(d) are approximated using a fourth-order polynomial,
| (17) |
where r denotes the radial distance measured from the centerline, in millimeters. The shock wave is prescribed as the initial condition of the fluid governing equations, shown in Figure 9(c).
Here, we simulate the response of Begostone specimen subjected to a single incident shock wave. Whereas the solver supports varying time-step sizes both in time and between the fluid and the solid, a constant time step size of 7.6 × 10⁻⁴ µs is used here. This value is chosen to ensure numerical stability of the explicit time-integrators in both sub-systems. The Cascades cluster [51] at Virginia Tech is used to performed the simulations presented in this paper. Each run consumed around 10,000 core-hours for achieving 10.0 µs simulation time.
3.3. Calibration of parameters in the continuum damage mechanics model
The continuum damage mechanics model introduced in Section 2.2 involves four parameters, σ*, Dc, and s, which are usually determined empirically. We set σ* to be the static tensile strength measured in a diametral compression test [22], i.e. σ* = 16.3 MPa. For Dc, there is no directly relevant experimental data for BegoStone. We set Dc = 0.5, following Fovargue et al. [11].
Next, we calibrate s and to reproduce the experimental result. Specifically, we have varied s between 1.5 and 4.0, and between 10−6 and 10−5 Pa−1sec−s, with more than 20 samples. The optimal parameter values (among the tested samples) are determined by comparing the predicted fracture location with the experimental data. The predicted fracture location is determined by averaging the locations of the first few elements in which D > DC. In this way, we obtain s = 3.5 and , which predicts a fracture at x = 6.85 mm, that is, a 9% difference from the experimental result. For other sample values of s and , we have observed variations in both the axial location of the initial fracture and the number of separated cracks (between 0 and 3).
The calibration study also shows that small variations (less than 10%) in s and do not abruptly change the resulting damage and fracture. However, with parameter values significantly different from the aforementioned optimal values, we have observed in several cases the formation of a wide, planar crack around the middle of the specimen (i.e. x ≈ L/2), and the formation of a void (instead of a sharp crack) in the rear half of the specimen (i.e. x > L/2).
It should be mentioned that although in the experiment the first planar fracture (Figure 8(b)) is observed after an average of five (identical) shock loads, the current computational study focuses on the material damage and fracture induced by the first shock load. In particular, the calibration of the damage model exploits the assumption that small fracture initiates inside the solid during the first shock load, then propagates towards the boundary during subsequent loads. This also indicates that the calibrated parameter values may be specific not only to the experimental setup, but also to the computational approach adopted in this work.
3.4. Result and discussion
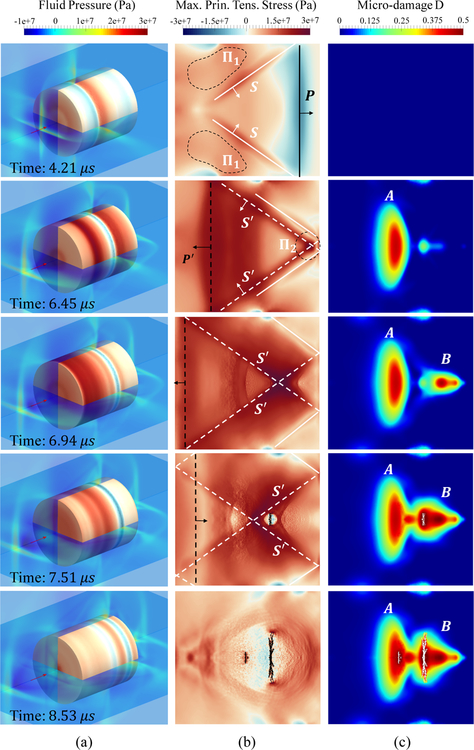
Figure 10 presents the numerical solution at five time instances, displaying the fluid pressure field, the maximum principal stress inside the solid and on its surface, and the cumulative damage D. Unless otherwise mentioned, the 2D solution snapshots presented in this paper visualize the plane z = 0. Overall, the result shows the interaction of the incident shock wave with the solid material, and the propagation and interference of the shock-induced stress waves. It also shows how microscopic damage evolves as the stress waves pass by, eventually leading to fracture.
Figure 10.
Snapshots of simulation result at five time instances. (a) The fluid pressure field and the maximum principal stress on the surface of solid material. (b) The maximum principal stress inside the solid, on plane z = 0. (c) The microscopic damage D inside the solid, on plane z = 0.
Specifically, at t = 4.21 µs, the front of the incident shock wave has passed the front surface of the solid specimen by approximately 3 mm. The transmitted and reflected waves resulting from the interaction of the shock front with the front surface of the solid are clearly evident. The transmitted shock wave is in the form of a compressive longitudinal wave (denoted by P), propagating in the axial direction. The P wave appears forward of the incident shock wave in the fluid, because the speed of longitudinal waves in the solid, CL, is greater than the speed of sound in the fluid. The interaction of the P wave with the side wall of the solid generates a shear wave, denoted by S, that converges towards the central axis. At the same time, the incident shock wave “squeezes” the side wall of the solid, as it is lagged behind the P wave in the solid. Because the speed of transverse waves in the solid, CT, is also greater than the speed of sound in the fluid, the dynamic squeezing does not produce a clear wave front inside the solid. Instead, it generates tensile stress within a relatively broad region behind the S wave, marked by Π1 in the figure. This is in contrast to previous findings for “softer” materials with CT lower than the speed of sound in the surrounding fluid (e.g., [17]). As the incident shock wave moves forward, Π1 both expands and moves forward. This is again different from the behavior of softer materials in which the shear wave induced by squeezing converges towards a small region around the central axis.
Once the P wave reaches the distal surface of the solid, it reflects a s a t ensile longitudinal wave, denoted by P′. At the same time, as the squeezing-induced tensile stress (i.e. region Π1) propagates from the side wall towards the central axis, it gradually builds up strength. Evident from the second row of Figure 10 (i.e. at t = 6.45 µs), when P′ meets Π1, the local tensile stress exceeds the damage threshold σ*, leading to an area of damage centered at x = 4.8 mm, marked as region A in the figure. At this point of time, a fraction of the tensile phase of the shock wave (around 50% lengthwise) has passed through the front surface of the solid, and the resulting tensile stress also contributes to the damage in region A. The peak value of the maximum principal stress corresponding to this wave superposition is found to be 31 MPa. The maximum local damage within region A is found to be D = 0.4, below the fracture threshold Dc. The shear wave S also reflects at the distal surface, and the reflection is denoted by S′. The converging of S′ results in a small region of high tensile stress around the axis of the solid, which moves in the −x direction. This small region is marked by Π2.
When Π2 meets the squeezing-induced tensile stress, the local maximum principal stress again exceeds the damage threshold σ*, with a peak value of 32 MPa achieved at x = 7.87 mm on the central axis. As shown in the third row of Figure 10 (i.e. at t = 6.94 µs), this wave superposition initiates another area of damage, marked as region B. Again, the tensile phase of the shock wave, transmitted through the front surface of the solid, also contributes to the damage. At t = 7.25 µs, the cumulative damage D exceeds the threshold Dc at x = 6.85 mm on the central axis, leading to the initiation of a crack. This crack expands in the radial directions, at a speed of the order of 1 mm/µs. It is notable that the propagation speed of S′ is of the same order of magnitude. In particular, within the plane of the crack (i.e. {x = 6.85 mm}), it moves in the radial directions at approximately 2 mm/µs. Therefore, the propagation of the crack is likely driven by the combined effects of the propagation of S′ and the stress concentration at the crack tip.
At t = 7.78 µs, Π2 reaches region A and intensifies the damage therein. This leads to the initiation of another crack on the central axis, at x = 5.1 mm. This crack stops at a radius of 0.4 mm, much smaller than the first one in region B. After approximately t = 9.5 µs, the maximum principal stress drops below σ* everywhere within the solid, and hence damage and fracture stop growing. The simulation is terminated at t = 10.0 µs.
Remarks:
We have examined the mesh sensitivity of the numerical result, particularly the predicted fracture, by varying the resolution of the CSD mesh between h = 0.03 mm and h = 0.12 mm, and for each fixed resolution, varying the specific unstructured mesh. Figure 11 presents the fracture predicted using a mesh with characteristic size h = 0.03 mm, i.e. the one used in the simulations described above, and two different meshes with h = 0.06 mm. The result shows that for all the three meshes, the location, shape, and size of the primary fracture are approximately the same.
A rough estimation based on Griffith’s theory of linear elastic fracture mechanics [52] indicates that for this model problem, the efficiency of fracture creation is likely on the order of 1%. Specifically, let Efr and ET denote, respectively, the new surface energy caused by fracture and the acoustic energy of the incident shock wave that is transmitted into the specimen. By Griffith’s theory,
Figure 11.

Predicted fracture at t = 10 µs, using three different unstructured tetrahedral CSD meshes. Mesh A: h = 0.03 mm, ∆t = 7.6×10⁻⁴ µs. Mesh B and C: h = 0.06 mm, ∆t = 1.77×10⁻³ µs.
| (18) |
where Afr is the fracture area, which is about 2.76 × 10⁻⁵ m2 at the end of the simulation. γ is the fracture surface energy per unit area. We have not found measurement of γ for BegoStone in the literature. Therefore, we approximate it using that of gypsum (the main ingredient of BegoStone), i.e. γ = 21.88 Jm−2 [53]. The new surface energy is hence estimated as Efr = 6.04 × 10⁻⁴ J. The acoustic energy of the transmitted shock wave ET can be estimated by
| (19) |
where Z1 and Z2 are the acoustic impedance of water and BegoStone, respectively. Ep denotes the effective acoustic energy of the incident shock wave, defined by
| (20) |
where ρf is the density of water, c0 is the speed of sound in water, and A denotes the effective area of the shock loading, i.e., the cross-sectional area of the cylindrical specimen. In this case, Z1 = 1.45 × 10⁶ kg/(m2s), Z2 = 8.30 × 10⁶ kg/(m2s) and Ep ≈ 40.0 mJ, which gives ET ≈ 20.3 mJ. Therefore, the energy efficiency mentioned above can be estimated by
| (21) |
In other words, the new surface energy caused by fracture formation is only a small fraction of the energy input from the incident shock wave.
We have conducted a numerical experiment in which the tensile phase of the shock wave is removed. Figure 12 shows the resulting damage and fracture, in comparison with those produced by the original shock wave. It is clear that the tensile phase of the shock wave also contributes to damaging and breaking the solid material.
Figure 12.
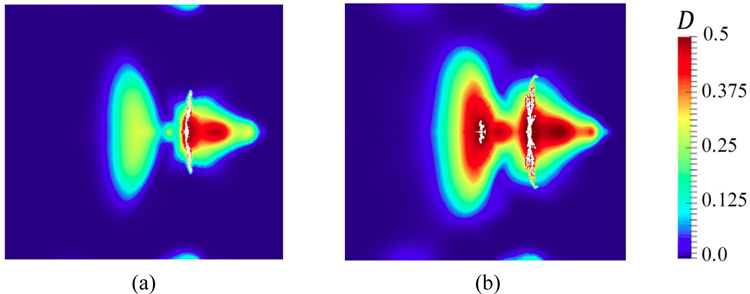
Damage and fracture produced by a modified shock wave in which the tensile phase is truncated (Subfigure (a)), in comparison with the result of the original shock wave (Subfigure (b)).
4. A novel phenomenological model of shock waveform
To facilitate the study of the impact of shock waves on solid materials, we design a new mathematical model that can be calibrated to fit different waveforms. In this regard, most, if not all, of the existing models have been designed to fit shock waves either with or without a tensile phase (e.g.,[54, 55, 56]). Therefore, a specific objective here is to be able to fit both types of shock waves. The proposed model function is
| (22) |
where
| (23) |
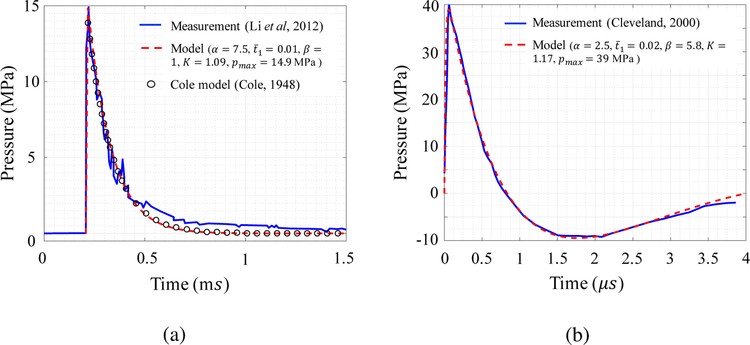
The dimensionless pressure represents the pressure p normalized by the peak pressure pmax, i.e. . The dimensionless time denotes the time t normalized by shock duration, i.e. . , α and β are dimensionless parameters controlling the shape of the waveform. Specifically, β controls the presence and magnitude of the tensile phase. When β = 1, the waveform exhibits monotonic decay, without a tensile phase. Figure 13(a) shows an example of fitting Equation (22) to a waveform observed in underwater explosion [57], with the widely used Cole model [56] as reference. When β > 1, Equation (22) generates a waveform with a tensile phase. For example, Figure 13(b) shows the fitting of Equation (22) to a typical shock wave generated by an electrohydraulic lithotripters [58].
Figure 13.
Fitting of two types of shock waves. (a) A shock wave results from underwater explosion of 1.0 kg TNT (measured at a fixed point 3.0 m away from the explosion center) [57]. (b) Shock wave generated by an electrohydraulic lithotripter (Dornier HM3) [58].
When the rise time of the shock wave, , is small, it can be approximated by
| (24) |
after dropping higher order terms. In this case, substituting Equation (24) into (23) gives a closed-form formula for parameter K.
The model function is C∞ with respect to all the parameters, which allows smooth transitions between different waveforms.
5. Parametric studies
Using the waveform equation described above, we investigate the effects of shock waveform and magnitude on the elastic response and damage in BegoStone specimens. The same simulation model described in Section 3.2 is employed, except that the incident shock wave is prescribed using Equation (22), and the radial decay function, Equation (17), is not applied. In addition, we vary the size of the solid material to examine the size effects. For all the simulations presented in this section, the total simulation time is t = 10.0 µs.
In the study of the effect of shock waveform (Section 5.1) and specimen size (Section 5.2), we maintain the same effective acoustic energy, defined by Equation (20). We also ensure that the shock wave rise time, defined by
| (25) |
is nearly the same.
The results obtained with different shock waves and specimen sizes are compared in terms of the maximum value of maximum principal stress, σmax, and the volume-averaged damage, Davg, defined by
| (26) |
5.1. Effect of tensile phase
Five shock waves, denoted by SW-A1 through SW-A5 and plotted in Figure 14, are tested. This series represents a gradual transition from a shock wave that decays monotonically, without a tensile phase, i.e. SW-A1, to one that has a clear tensile phase, i.e. SW-A5. Characteristics of the five shock waves are given in Table 2.
Figure 14.
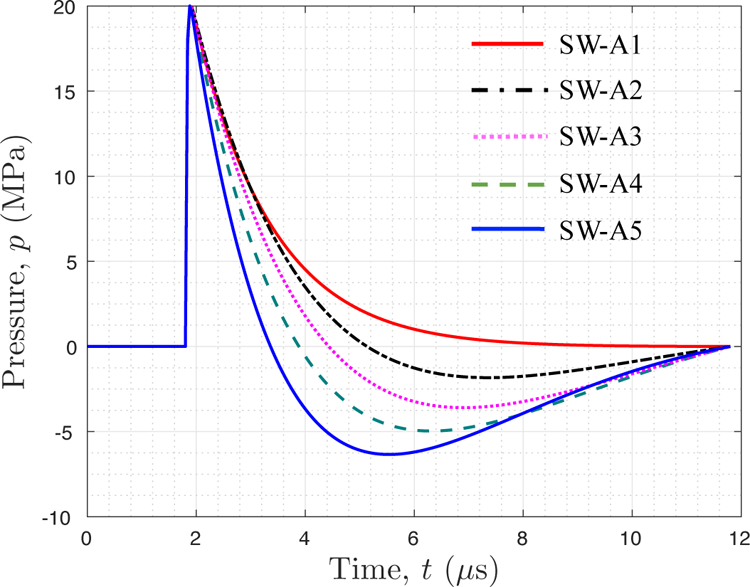
Five different shock waveforms with different tensile phase
Table 2:
Characteristics of five shock waves with different tensile phases.
| Shock index | α | β | K | pmax (MPa) | T (µs) | tr (ns) | Ep (mJ) | ||
|---|---|---|---|---|---|---|---|---|---|
| SW-A1 | 6.0 | 1.0 | 0.00217 | 1.09 | 20 | 0 | 10 | 94 | 15.3 |
| SW-A2 | 2.25 | 4.0 | 0.00217 | 1.08 | 20 | −1.83 | 10 | 91 | 15.3 |
| SW-A3 | 2.0 | 4.8 | 0.00217 | 1.09 | 20 | −3.59 | 10 | 91 | 15.3 |
| SW-A4 | 2.3 | 5.8 | 0.00217 | 1.10 | 20 | −4.96 | 10 | 88 | 15.3 |
| SW-A5 | 3.0 | 7.4 | 0.00217 | 1.12 | 20 | −6.34 | 10 | 86 | 15.3 |
α, β, and K are model parameters in Equation (22). , denotes the negative peak of tensile phase.
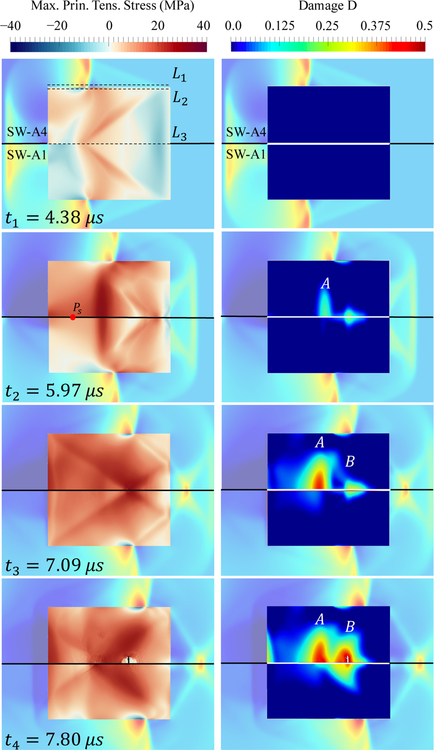
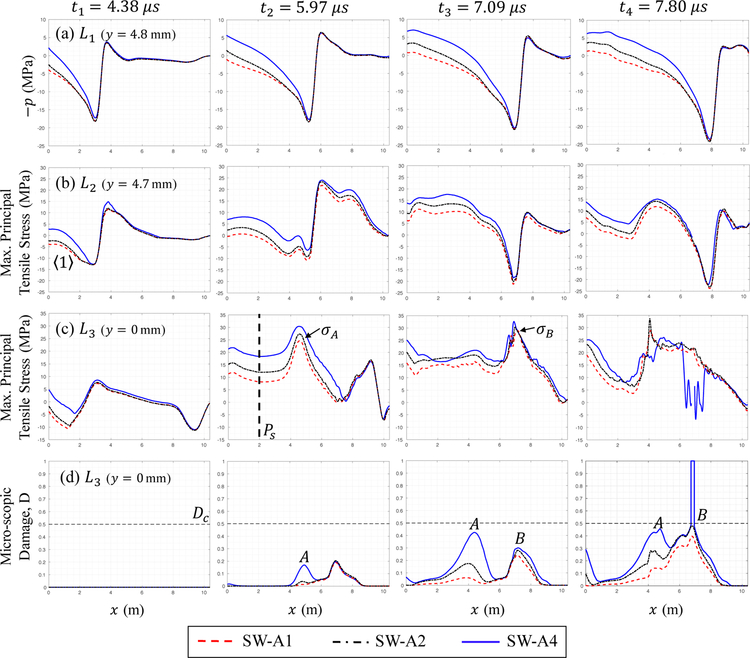
Figures 15 and 16 compare the results of two representative cases, SW-A1 and SW-A4, at four time instances, which shows clear differences in both the elastic fields and the material damage.
Figure 15.
The evolution of transient stress field and cumulative damage D induced by SW-A4 and SW-A1 at four time instances. (For the ease of comparison, solutions from SW-A4 and SW-A1 are shown in the upper and lower halves of each image, respectively.)
Figure 16.
Comparison of transient solutions at four time instances. (a) Fluid pressure (inversed) along line L1 (y = 4.8 mm, a line on plane z = 0 mm showed in Figure 15). (b) Maximum principal tensile stress along line L2 (y = 4.7mm, z = 0 mm). (c) Maximum principal tensile stress along the cylinder’s central axis L3 (y = 0 mm, z = 0 mm). (d) Cumulative damage D along the cylinder’s central axis L3 (y = 0 mm, z = 0 mm).
Specifically, at t = 4.38 µs, the transient stress field (Figure 15, the left column) shows that SW-A1 induces a compressive stress region near the front surface of the solid, whereas SW-A4 produces tensile stress in this region. By comparing the pressure and stress along two lines, L1 and L2 (Figure 16, the first column, (a) and (b)), this region (marked by ) corresponds to the interaction of the tail of the shock wave with the side wall of the solid, and the observed difference is due to the fact that SW-A4 has a tensile phase whereas SW-A1 does not.
In the case of SW-A1, as the compressive stress waves induced by the tail of shock wave propagate inwards, they counteract the squeezing effect described in Section 3.4. Specifically, at t = 5.97 µs, the magnitude of tensile stress at a sensor point along the stone axis, Ps, shows a nearly 50% decrease for SW-A1 compared to SW-A4. Moreover, the peak tensile stress for SW-A1, which occurs within damage region A, is also lower compared to SW-A4, by approximately 17%. As shown in Figure 15, the local decrease of tensile stress results in dramatic decrease of damage within region A. For example, at t = 7.09 µs, the maximum damage induced by SW-A1 is 85% lower than that induced by SW-A4 (Figure 16 (d)).
A similar effect is observed for the peak tensile stress within region B, induced by the superposition of the converging shear wave S′ and squeezing-induced tensile stress waves, as well as the resulting damage. Specifically, at t = 7.09 µs, SW-A1 produces a peak tensile stress of 28 MPa, 22% lower compared to SW-A4. Also, the damage caused by SW-A4 is large enough to initiate fracture, whereas the damage caused by SW-A1 is still below the fracture threshold.
Figure 17 compares the damage and fracture resulting from SW-A1 through SW-A4, obtained at the end of the simulation, i.e. t = 10.0 µs. The result suggests a trend toward larger shock-induced damage in both region A and B when the amplitude and duration of tensile phase of shock wave gradually increase. Despite the change in the amount of damage, fracture initiated at the same location in the cases of SW-A2 through SW-A4.
Figure 17.

Comparison of the material damage and fracture induced by different shock waves (SW-A1 through SW-A4) at the end of simulation, i.e. t = 10.0 µs.
Figure 18 shows the effects of the tensile phase on Davg and σmax. As the acoustic energy of the tensile phase increases from zero (SW-A1) to 4.3 mJ (SW-A4), the volume-averaged damage, Davg, increases by 260%, from 0.0251 to 0.0914. In particular, SW-A2, with a very weak tensile phase that accounts for only 3.4% of the total acoustic energy, can induce twice as much damage as a shock wave without a tensile phase, SW-A1. The increase of damage is nonlinear and the slope reduces as the tensile phase extends. When the acoustic energy of tensile phase exceeds approximately 1/3 of the total acoustic energy (i.e. SW-A4), the average damage stops growing. This is likely due to the reduced contribution from the compressive phase of the shock wave.
Figure 18.
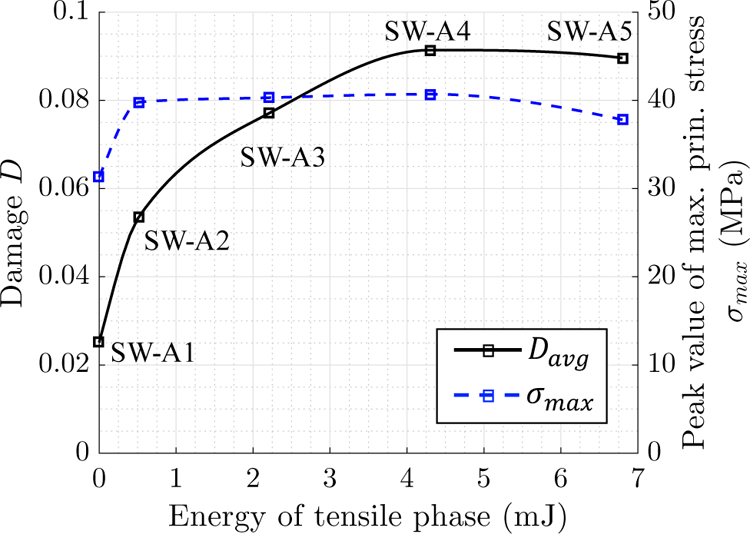
The peak value of the maximum principal stress σmax and the average damage Davg, as functions of the acoustic energy of tensile phase.
Figure 18 also presents the peak value of maximum principal stress, σmax, in the solid material. For all cases where fracture occurred (i.e., SW-A2 to SW-A5), the peak value appears at the tip of the crack, at approximately 40 MPa. For the case of SW-A1, where fracture did not occur, the peak stress appears on the centerline of the solid, at 31 MPa.
Remarks:
The numerical results suggest that with the same magnitude, acoustic energy, and duration, a shock wave with a tensile phase can induce more significant damage and broader fracture to a target material than one without a tensile phase. For applications that use designed shock waves to modify or break solid materials, this indicates a possible approach to improve energy efficiency.
Previous statistical models (e.g., [59, 60, 61]) tend to characterize a shock wave by its peak pressure, acoustic energy, duration, rise time, and some application-specific parameters. The above results suggest that in addition to these quantities, the energy and magnitude of the tensile phase may also need to be considered.
5.2. Effect of target size
We consider six cylindrical specimens of different size, characterized in Table 3. The one denoted by S3 is the one used in the previous simulations. All the six specimens have the same length-to-diameter ratio. Their size, characterized by the ratio of the length of the specimen (L) to the length of the shock wave within water (LSW), varies from 1.07 (S1) to 0.18 (S6). For each specimen, we apply both a shock wave with a tensile phase, SW-A4, and one without tensile phase, SW-A1.
Table 3:
Dimensions of six specimens for the study of size effect.
| Specimen index | Length, L (mm) | Diameter, d (mm) | L/LS W |
|---|---|---|---|
| S1 | 15.51 | 14.15 | 1.07 |
| S2 | 12.93 | 11.79 | 0.89 |
| S3 | 10.34 | 9.43 | 0.71 |
| S4 | 7.76 | 7.07 | 0.54 |
| S5 | 5.17 | 4.72 | 0.36 |
| S6 | 2.59 | 2.36 | 0.18 |
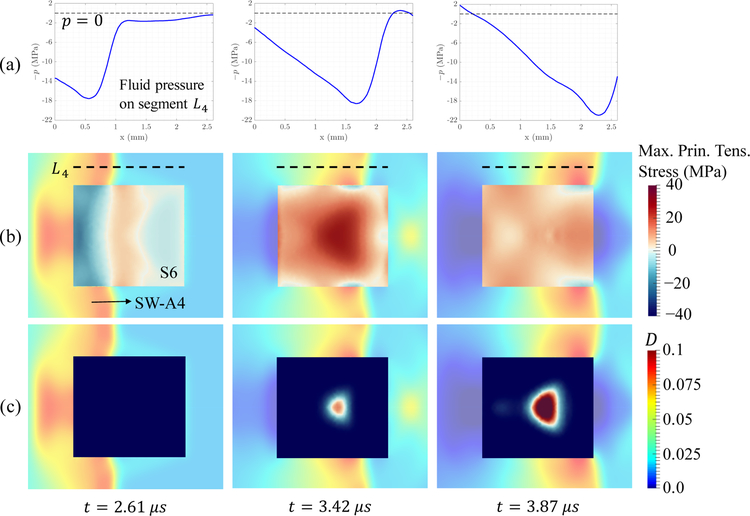
Figure 19 presents the change of volume-averaged damage, Davg, with respect to the length ratio L/LSW. For both shock waves, the size effect is significant. In both cases, the maximum value of Davg is achieved in specimen S4, where L/LSW = 0.54. When the size of the specimen is smaller, a significant decrease in Davg is observed. Specifically, for specimen S6 (L/LSW = 0.18), the value of Davg is less than 10% of that in S4. This trend is consistent with the finding of Zhang et al. [23] that smaller specimens require more shock doses to break, except that they tested specimens in clusters instead of individual ones. We have found that when the specimen becomes too small compared to the length of the incident shock wave, the trailing tensile phase can no longer work jointly with the leading compressive phase — through wave superpositions described in Section 3.4 — to increase damage. For example, Figure 20 presents the evolution of the stress and the cumulative damage in S6 induced by SW-A4. At t = 3.87 µs, the front of shock wave in the fluid has just reached the distal end of the specimen, and the result shows that no more damage will accumulate inside the specimen beyond this time. The fluid pressure on line L4 shows that, up to t = 3.87 µs, the specimen is mainly impacted by the compressive phase of the shock wave, while the tensile phase has barely reached the specimen.
Figure 19.
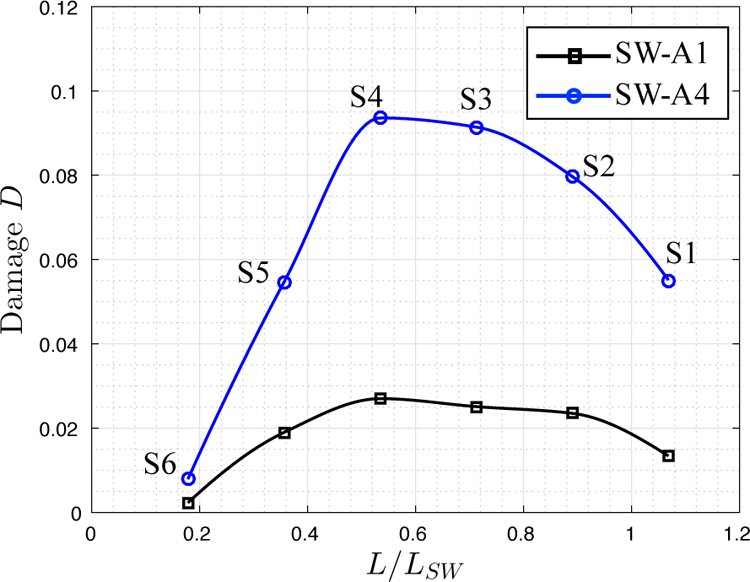
The volume-averaged damage Davg induced by shock waves SW-A1 and SW-A4 in six specimens (S1 through S6) of different size.
Figure 20.
Impact of shock wave SW-A4 on a small target material, S6, with L/LSW = 0.18.
For all the specimens, SW-A4 induces more significant damage than SW-A1. The difference in between varies from 187% (in the case of S5) to 264% (in the case of S4). Therefore, the main finding derived in Section 5.1 — that is, the presence of tensile phase can enhance material damage — may hold for a relatively wide range of specimen size, especially, when it is comparable to the length of the shock pulse.
5.3. Effect of shock magnitude
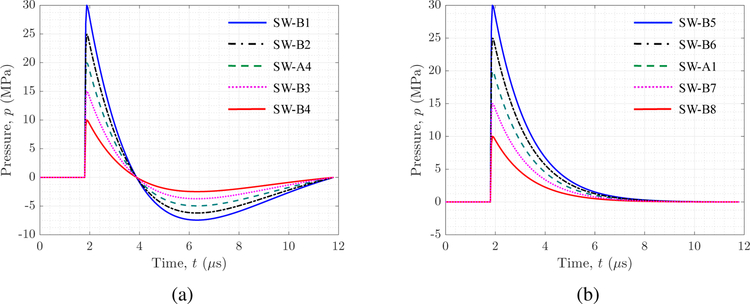
We consider two series of shock waves, generated by linearly scaling the pressure field of two representative waveforms with and without a tensile phase, that is, SW-A4 and SW-A1. For each waveform, four scaling factor values, 0.5, 0.75, 1.25, and 1.5, are considered. The generated shock waves are denoted by SW-B1 through SW-B8. Specifically, SW-B1 through SW-B4 are generated by scaling SW-A4, while SW-B5 through SW-B8 are generated by scaling SW-A1. All the ten shock waves involved are plotted and compared in Figure 21. For each pair with the same peak pressure (e.g., SW-B1 and SW-B5), the acoustic energy is nominally the same. The solid specimen used in this series of parameter study is the one denoted by S3 in Table 3.
Figure 21.
Ten (10) shock waves with different magnitude and waveform.
Figure 22 presents the variation of Davg with respect to the peak pressure of the shock wave. For both waveforms (with and without a tensile phase), Davg is nonzero when pmax > 10 MPa. As expected, Davg increases as the shock magnitude increases.
Figure 22.
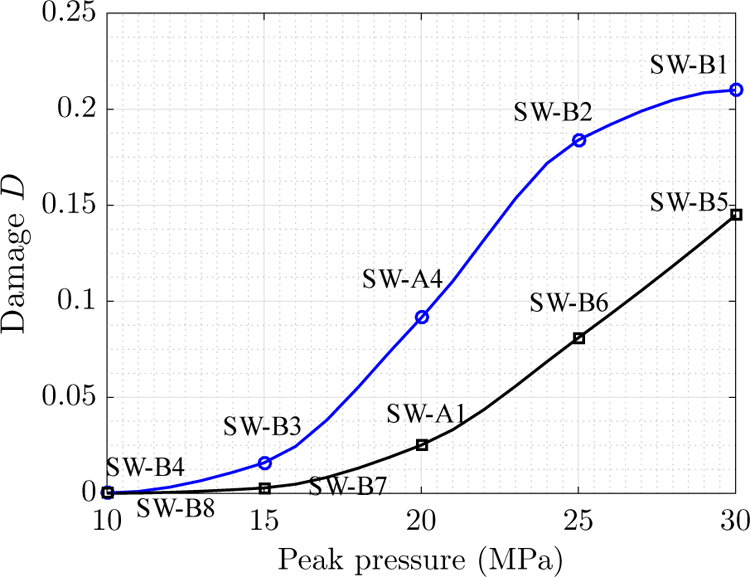
The volume-averaged damage Davg induced by shock waves with different magnitude and waveform.
Moreover, when pmax is greater than 10 MPa, a shock wave with a tensile phase always induces greater damage than its counterpart without a tensile phase. The difference varies between 460% (when pmax = 15 MPa) and 45% (when pmax = 30 MPa). The significant effect of the tensile phase can also be appreciated by comparing to the effect of shock magnitude and acoustic energy. For example, for the same target material, SW-B3 produces about the same damage (specifically, Davg) as SW-A1 which has 33% higher peak pressure and 78% higher effective acoustic energy. Similarly, SW-A4 produces about the same damage as SW-B6 which has 25% higher peak pressure and 55% higher effective acoustic energy.
6. Conclusion
This paper presents a computational study of the response of solid materials to shock waves traveling in a surrounding liquid medium. In particular, we have focused on a model problem that features a brittle material, BegoStone, in the form of cylindrical bodies and submerged in water. For this problem, previous experiments have shown that shock waves with peak pressure between 10 MPa and 50 MPa can produce repeatable planar cracks at a nearly fixed location, which indicates the potential for designing shock waves to achieve desired material modifications. Nevertheless, the exact process of this deterministic fracture, the cause of it, and the effects of various parameters (e.g., shock waveform, magnitude, and specimen size) are still open questions.
We have employed a recently developed CFD-CSD coupled solver, FIVER, to solve this shock-dominated fluid-solid interaction problem. We begin by calibrating the continuum damage mechanics model employed in this solver using experimental data. After calibration, the solver can capture both the location of the fracture and its planar shape reasonably well. The numerical result shows that the superposition of traveling elastic waves, which depends on the geometry of the specimen, drives the process of damaging and breaking the specimen. For this specific specimen, the planar fracture is initiated jointly by the transmitted compressive shock front (specifically, its interaction with the specimen’s side wall), the squeezing-induced tensile stress, and the transmitted tensile phase of the shock wave. Moreover, the tensile shear waves resulting from the interaction of the transmitted compressive shock front with the side wall (i.e. S′) facilitates the propagation of the initial crack in radial directions. Compared to previous studies in which maximum principal tensile stress and accumulated damage are used to predict the location of fracture, the modeling of damage and fracture in this work allows us to directly compare with experimental result. Also, simulating fracture allows us to capture additional information about crack propagation, as well as its relation with the propagation of stress waves.
We have also developed a novel waveform equation, which can model shock waves with and without a trailing tensile phase, and allows smooth transition in between. Using this equation, we have conducted a series of parametric studies in which the shock waveform, magnitude, and the size of the specimen are varied. The result shows that for relatively wide ranges of shock magnitude (pmax > 10 MPa), and target size (relative to the length of the shock pulse, 0.18 < L/LSW < 1.07), a shock wave with a tensile phase can induce significantly greater damage to the target specimen than one without a tensile phase, even if the two have the same peak pressure, duration, and acoustic energy.
Finally, several limitations of the present study should be mentioned. First, although the computational model is generally applicable to various materials under high strain-rate loading conditions, the numerical analysis presented in this paper focuses on a representative brittle material, namely BegoStone, in a specific setting that is commonly used for lithotripsy research. Second, this work focuses on studying the material’s response to a single shock load, whereas real-world applications often involve multiple (or many) shock loads. In this regard, the cumulative effects of multiple shock loads on the material damage and fracture, as well as the effects of damage regions on the subsequent shock loads, are not considered in the calibration and the parametric studies. Third, the effects of cavitation are not considered in this study. In reality, the tensile phase of a shock wave may induce cavitation even in degassed water. The violent collapse of cavitation bubbles may cause damage to the specimen. The specific mechanisms and intensity of cavitation-induced damages in solid (and soft) materials are still open questions, which we plan to investigate in the future.
Acknowledgements
S.C. and K.G.W. would like to acknowledge the support of the Office of Naval Research (ONR) under award N00014–17-1–2831, and the support of the National Science Foundation (NSF) under awards CBET-1751487 and CBET-1706003. Y.Z., D.L. and P.Z. would like to acknowledge the support of the National Institutes of Health (NIH) on this work through grant R37-DK052985–21.
Appendix
Here we provide additional details about the dynamic fracture experiment presented in Section 3.1. The setup of this experiment is showed in Figure 6(a). More specifically, an electromagnetic (EM) shock wave generator was mounted at the bottom of a Lucite tank (40 × 40 × 30 cm) filled with 0.2-µm-filtered and degassed water (< 3 mg/L concentration, 23°C) [50]. The shock wave generator is operated at 14.8 kV with a pulse repetition frequency (PRF) of 0.5 Hz. At the focus of the generator, where the intense shock wave is generated, a cylindrical BegoStone specimen (diameter × length = 9.43 mm ×10.34 mm) is held by a flat-base tube holder (inner diameter = 14 mm) made of silicon rubber. The axis of specimen and holder are aligned with the central axis of the generator using a 3D positioning system (VXM-2 step motors with BiSlide-M02 lead screws, Velmex, Bloomfield, NY). The stone phantoms are fabricated by BegoStone Plus (BEGO USA, Smithfield, RI), with a powder-to-water mixing ratio of 5 : 1.
The stone specimen is subjected to multiple shock waves until the initial disintegration is observed. Figure 23 presents the photographs and statistics of initial fracture for 8 specimens. For all 8 specimens, planar fracture is clearly observed and the average location is at 73% of the stone length from the front surface.
Figure 23.
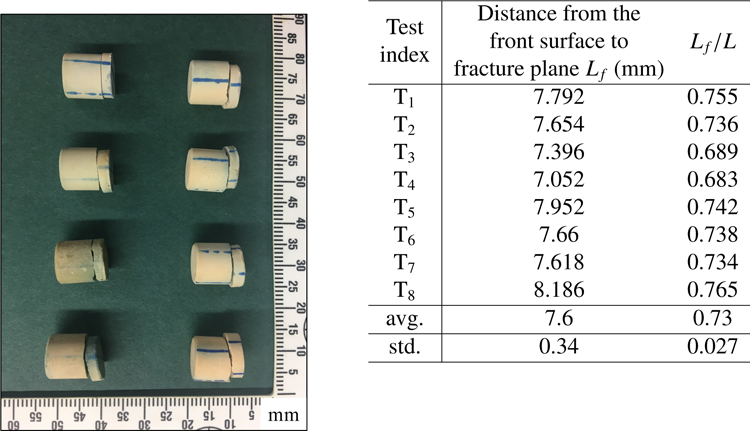
Experimental result: photographs of fractured specimens and statistics.
Footnotes
in the case of inviscid flow, normal velocity
References
- [1].Chen M, McCauley JW, Hemker KJ, Shock-induced localized amorphization in boron carbide, Science 299 (5612) (2003) 1563–1566. [DOI] [PubMed] [Google Scholar]
- [2].Barsoum RGS, Elastomeric Polymers with High Rate Sensitivity: Applications in Blast, Shockwave, and Penetration Mechanics, William Andrew, 2015. [Google Scholar]
- [3].Ramirez B, Gupta V, Evaluation of novel temperature-stable viscoelastic polyurea foams as helmet liner materials, Materials & Design 137 (2018) 298–304. [Google Scholar]
- [4].Li B, Pandolfi A, Ortiz M, Material-point erosion simulation of dynamic fragmentation of metals, Mechanics of Materials 80 (2015) 288–297. [Google Scholar]
- [5].Lingeman JE, McAteer JA, Gnessin E, Evan AP, Shock wave lithotripsy: advances in technology and technique, Nature Reviews Urology 6 (12) (2009) 660. [DOI] [PMC free article] [PubMed] [Google Scholar]
- [6].Zhong P, Shock wave lithotripsy, in: Bubble dynamics and shock waves, Springer, 2013, pp. 291–338. [Google Scholar]
- [7].Bažant ZP, Caner FC, Comminution of solids caused by kinetic energy of high shear strain rate, with implications for impact, shock, and shale fracturing, Proceedings of the National Academy of Sciences 110 (48) (2013) 19291–19294. [DOI] [PMC free article] [PubMed] [Google Scholar]
- [8].Chen W, Maurel O, Reess T, De Ferron AS, La Borderie C, Pijaudier-Cabot G, Rey-Bethbeder F, Jacques A, Experimental study on an alternative oil stimulation technique for tight gas reservoirs based on dynamic shock waves generated by pulsed arc electrohydraulic discharges, Journal of Petroleum Science and Engineering 88 (2012) 67–74. [Google Scholar]
- [9].Brizzolara RA, Nordham DJ, Walch M, Lennen RM, Simmons R, Burnett E, Mazzola MS, Non-chemical biofouling control in heat exchangers and seawater piping systems using acoustic pulses generated by an electrical discharge, Biofouling 19 (1) (2003) 19–35. [DOI] [PubMed] [Google Scholar]
- [10].Schaefer R, Claudi R, Grapperhaus M, Control of zebra mussels using sparker pressure pulses, American Water Works Association. Journal 102 (4) (2010) 113. [Google Scholar]
- [11].Fovargue DE, Mitran S, Smith NB, Sankin GN, Simmons WN, Zhong P, Experimentally validated multiphysics computational model of focusing and shock wave formation in an electromagnetic lithotripter, The Journal of the Acoustical Society of America 134 (2) (2013) 1598–1609. [DOI] [PMC free article] [PubMed] [Google Scholar]
- [12].Cole RH, Underwater explosions, Dover Publications, 1965. [Google Scholar]
- [13].Niwa K, Mizutari K, Matsui T, Kurioka T, Matsunobu T, Kawauchi S, Satoh Y, Sato S, Shiotani A, Kobayashi Y, Pathophysiology of the inner ear after blast injury caused by laser-induced shock wave, Scientific reports 6 (2016) 31754. [DOI] [PMC free article] [PubMed] [Google Scholar]
- [14].Mitchell SJ, Pandolfi A, Ortiz M, Effect of brittle fracture in a metaconcrete slab under shock loading, Journal of Engineering Mechanics 142 (4) (2016) 04016010. [Google Scholar]
- [15].Perotti LE, Deiterding R, Inaba K, Shepherd J, Ortiz M, Elastic response of water-filled fiber composite tubes under shock wave loading, International Journal of Solids and Structures 50 (3–4) (2013) 473–486. [Google Scholar]
- [16].Zhou Y, Zhong P, The effect of reflector geometry on the acoustic field and bubble dynamics produced by an electrohydraulic shock wave lithotripter, The Journal of the Acoustical Society of America 119 (6) (2006) 3625–3636. [DOI] [PMC free article] [PubMed] [Google Scholar]
- [17].Sapozhnikov OA, Maxwell AD, MacConaghy B, Bailey MR, A mechanistic analysis of stone fracture in lithotripsy, The Journal of the Acoustical Society of America 121 (2) (2007) 1190–1202. [DOI] [PubMed] [Google Scholar]
- [18].Wijerathne M, Hori M, Sakaguchi H, Simulation of dynamic crack growth in shockwave lithotripsy with PDS-FEM, Journal of Applied Mechanics 13 (2010) 253–262. [Google Scholar]
- [19].Neisius A, Smith NB, Sankin G, Kuntz NJ, Madden JF, Fovargue DE, Mitran S, Lipkin ME, Simmons WN, Preminger GM, et al. , Improving the lens design and performance of a contemporary electromagnetic shock wave lithotripter, Proceedings of the National Academy of Sciences 111 (13) (2014) E1167–E1175. [DOI] [PMC free article] [PubMed] [Google Scholar]
- [20].Liu Y, Zhong P, Begostone: a new stone phantom for shock wave lithotripsy research (l), The Journal of the Acoustical Society of America 112 (4) (2002) 1265–1268. [DOI] [PubMed] [Google Scholar]
- [21].Simmons W, Cocks F, Zhong P, Preminger G, A composite kidney stone phantom with mechanical properties controllable over the range of human kidney stones, Journal of the mechanical behavior of biomedical materials 3 (1) (2010) 130–133. [DOI] [PMC free article] [PubMed] [Google Scholar]
- [22].Esch E, Simmons WN, Sankin G, Cocks HF, Preminger GM, Zhong P, A simple method for fabricating artificial kidney stones of different physical properties, Urological research 38 (4) (2010) 315–319. [DOI] [PMC free article] [PubMed] [Google Scholar]
- [23].Zhang Y, Nault I, Mitran S, Iversen ES, Zhong P, Effects of stone size on the comminution process and efficiency in shock wave lithotripsy, Ultrasound in Medicine and Biology 42 (11) (2016) 2662–2675. [DOI] [PMC free article] [PubMed] [Google Scholar]
- [24].Farhat C, Rallu A, Wang K, Belytschko T, Robust and provably second-order explicit–explicit and implicit– explicit staggered time-integrators for highly non-linear compressible fluid–structure interaction problems, International Journal for Numerical Methods in Engineering 84 (1) (2010) 73–107. [Google Scholar]
- [25].Wang K, Rallu A, Gerbeau J-F, Farhat C, Algorithms for interface treatment and load computation in embedded boundary methods for fluid and fluid–structure interaction problems, International Journal for Numerical Methods in Fluids 67 (9) (2011) 1175–1206. [Google Scholar]
- [26].Wang K, Grétarsson J, Main A, Farhat C, Computational algorithms for tracking dynamic fluid–structure interfaces in embedded boundary methods, International Journal for Numerical Methods in Fluids 70 (4) (2012) 515–535. [Google Scholar]
- [27].Farhat C, Gerbeau J-F, Rallu A, FIVER: A finite volume method based on exact two-phase Riemann problems and sparse grids for multi-material flows with large density jumps, Journal of Computational Physics 231 (19) (2012) 6360–6379. [Google Scholar]
- [28].Main A, Zeng X, Avery P, Farhat C, An enhanced fiver method for multi-material flow problems with second-order convergence rate, Journal of Computational Physics 329 (2017) 141–172. [Google Scholar]
- [29].Farhat C, Wang K, Main A, Kyriakides S, Lee L-H, Ravi-Chandar K, Belytschko T, Dynamic implosion of underwater cylindrical shells: experiments and computations, International Journal of Solids and Structures 50 (19) (2013) 2943–2961. [Google Scholar]
- [30].Wang KG, Lea P, Main A, McGarity O, Farhat C, Predictive simulation of underwater implosion: Coupling multi-material compressible fluids with cracking structures, in: ASME 2014 33rd International Conference on Ocean, Offshore and Arctic Engineering, American Society of Mechanical Engineers, 2014, pp. V08AT06A028–V08AT06A028. [Google Scholar]
- [31].Wang K, Lea P, Farhat C, A computational framework for the simulation of high-speed multi-material fluid–structure interaction problems with dynamic fracture, International Journal for Numerical Methods in Engineering 104 (7) (2015) 585–623. [Google Scholar]
- [32].Wang KG, Multiphase fluid-solid coupled analysis of shock-bubble-stone interaction in shockwave lithotripsy, International journal for numerical methods in biomedical engineering 33 (10). [DOI] [PubMed] [Google Scholar]
- [33].Farhat C, Larat A, Main A, Avery P, Wang K, Saint-Jalm C, An embedded boundary method for viscous fluid/structure interaction problems and application to flexible flapping wings, in: 42nd AIAA Fluid Dynamics Conference and Exhibit, 2012, p. 2688. [Google Scholar]
- [34].Huang Z, Avery P, Farhat C, Rabinovitch J, Derkevorkian A, Peterson LD, Simulation of parachute inflation dynamics using an Eulerian computational framework for fluid-structure interfaces evolving in high-speed turbulent flows, in: 2018 AIAA Aerospace Sciences Meeting, 2018, p. 1540. [Google Scholar]
- [35].Chung H, Cao S, Philen M, Beran P, Wang K, CFD-CSD coupled analysis of underwater propulsion using a biomimetic fin-and-joint system, Computers and Fluids [Google Scholar]
- [36].Murakami S, Continuum damage mechanics: a continuum mechanics approach to the analysis of damage and fracture, Vol. 185, Springer Science & Business Media, 2012. [Google Scholar]
- [37].Tuler FR, Butcher BM, A criterion for the time dependence of dynamic fracture, International Journal of Fracture Mechanics 4 (4) (1968) 431–437. [Google Scholar]
- [38].Nyoungue A, Azari Z, Abbadi M, Dominiak S, Hanim S, Glass damage by impact spallation, Materials Science and Engineering: A 407 (1–2) (2005) 256–264. [Google Scholar]
- [39].Fovargue D, Multiscale and multiphysics computational models of processes in shock wave lithotripsy, Ph.D. thesis, The University of North Carolina at Chapel Hill (2013). [Google Scholar]
- [40].Chahine GL, Gnanaskandan A, Mansouri A, Hsiao C-T, Content R, Interaction of a cavitation bubble with a polymeric coating–scaling fluid and material dynamics, International Journal of Multiphase Flow 112 (2019) 155–169. [Google Scholar]
- [41].Hsiao C-T, Jayaprakash A, Kapahi A, Choi J-K, Chahine GL, Modelling of material pitting from cavitation bubble collapse, Journal of Fluid Mechanics 755 (2014) 142–175. [Google Scholar]
- [42].Saurel R, Abgrall R, A simple method for compressible multifluid flows, SIAM Journal on Scientific Computing 21 (3) (1999) 1115–1145. [Google Scholar]
- [43].Coralic V, Colonius T, Shock-induced collapse of a bubble inside a deformable vessel, European Journal of Mechanics-B/Fluids 40 (2013) 64–74. [DOI] [PMC free article] [PubMed] [Google Scholar]
- [44].Cleveland RO, Sapozhnikov OA, Modeling elastic wave propagation in kidney stones with application to shock wave lithotripsy, The Journal of the Acoustical Society of America 118 (4) (2005) 2667–2676. [DOI] [PubMed] [Google Scholar]
- [45].Jeong J, Adib H, Pluvinage G, Proposal of new damage model for thermal shock based on dynamic fracture on the brittle materials, Journal of Non-Crystalline Solids 351 (24–26) (2005) 2065–2075. [Google Scholar]
- [46].Zhang Z, Wu F, Gao W, Tan J, Wang Z, Stoica M, Das J, Eckert J, Shen B, Inoue A, Wavy cleavage fracture of bulk metallic glass, Applied physics letters 89 (25) (2006) 251917. [Google Scholar]
- [47].Wijerathne M, Hori M, Sakaguchi H, Oguni K, 3D dynamic simulation of crack propagation in extracorporeal shock wave lithotripsy, in: IOP Conference Series: Materials Science and Engineering, Vol. 10, IOP Publishing, 2010, p. 012120. [Google Scholar]
- [48].Fovargue D, Mitran S, Sankin G, Zhang Y, Zhong P, An experimentally-calibrated damage mechanics model for stone fracture in shock wave lithotripsy, International Journal of Fracture (2018) 1–14. [DOI] [PMC free article] [PubMed] [Google Scholar]
- [49].Main GA, Implicit and higher-order discretization methods for compressible multi-phase fluid and fluid-structure problems, Ph.D. thesis, Stanford University (2014). [Google Scholar]
- [50].Smith N, Zhong P, Stone comminution correlates with the average peak pressure incident on a stone during shock wave lithotripsy, Journal of biomechanics 45 (15) (2012) 2520–2525. [DOI] [PMC free article] [PubMed] [Google Scholar]
- [51].V. T. Advanced Research Computing, https://www.arc.vt.edu/.
- [52].Griffith AA, Vi. the phenomena of rupture and flow in solids, Philosophical transactions of the royal society of london. Series A, containing papers of a mathematical or physical character 221 (582–593) (1921) 163–198. [Google Scholar]
- [53].Mota A, Knap J, Ortiz M, Three-dimensional fracture and fragmentation of artificial kidney stones, in: Journal of Physics: Conference Series, Vol. 46, IOP Publishing, 2006, p. 299. [Google Scholar]
- [54].Church CC, A theoretical study of cavitation generated by an extracorporeal shock wave lithotripter, The Journal of the Acoustical Society of America 86 (1) (1989) 215–227. [DOI] [PubMed] [Google Scholar]
- [55].Howle L, Schaeffer DG, Shearer M, Zhong P, Lithotripsy: the treatment of kidney stones with shock waves, SIAM review 40 (2) (1998) 356–371. [Google Scholar]
- [56].Cole RH, Weller R, Underwater explosions, Physics Today 1 (1948) 35. [Google Scholar]
- [57].Li J, Rong J.-l., Experimental and numerical investigation of the dynamic response of structures subjected to underwater explosion, European Journal of Mechanics-B/Fluids 32 (2012) 59–69. [Google Scholar]
- [58].Cleveland RO, Bailey MR, Fineberg N, Hartenbaum B, Lokhandwalla M, McAteer JA, Sturtevant B, Design and characterization of a research electrohydraulic lithotripter patterned after the dornier HM3, Review of Scientific Instruments 71 (6) (2000) 2514–2525. [Google Scholar]
- [59].Granz B, Köhler G,What makes a shock wave efficient in lithotripsy?, The Journal of stone disease 4 (2) (1992) 123–128. [PubMed] [Google Scholar]
- [60].Mishriki S, Cohen N, Baker A, Wills M, Whitfield H, Feneley R, Choosing a powerful lithotriptor, BJU International 71 (6) (1993) 653–660. [DOI] [PubMed] [Google Scholar]
- [61].Eisenmenger W, The mechanisms of stone fragmentation in ESWL, Ultrasound in medicine and biology 27 (5) (2001) 683–693. [DOI] [PubMed] [Google Scholar]


