

Abstract
Metastasis remains the main reason for renal cell carcinoma (RCC)-associated mortality. Tyrosine kinase inhibitors (TKI) impart clinical benefit for most RCC patients but the determinants of response are poorly understood. We report an integrated genomic and transcriptomic analysis of metastatic clear cell RCC (ccRCC) patients treated with TKI therapy and identify predictors of response. Patients in the COMPARZ phase III trial received first-line sunitinib or pazopanib with comparable efficacy. RNA-based analyses revealed four distinct molecular subgroups associated with response and survival. Characterization of these subgroups identified mutation profiles, angiogenesis and macrophage infiltration programs to be powerful predictors of outcome with TKI therapy. Notably, predictors differed by the type of TKI received. Our study emphasizes the clinical significance of angiogenesis and immune tumor microenvironment and suggests the critical effects its various aspects have on TKI efficacy vary by agent. This has broad implications for optimizing precision treatment of RCC.
INTRODUCTION
Tyrosine kinase inhibitors (TKI)s have revolutionized the treatment of metastatic renal cell carcinoma (RCC) and constitute a mainstay of care for patients with advanced disease.(1) However, currently, there are no reliable biomarkers to predict treatment response.(2) The function of the tumor microenvironment (TME) in modifying the response to TKI therapy in metastatic RCC remains poorly understood. With the introduction of immune checkpoint blockade, there is growing interest in unraveling the role of the TME to develop biomarkers that may help personalize treatment selection, understand resistance mechanisms and inform the development of novel combination therapies.
Clear cell RCC (ccRCC), the most common and lethal form of RCC, is driven by distinct driver gene mutations. Inactivating mutations or methylation of von Hippel Lindau (VHL) occur in all ccRCC tumors and leads to accumulation of hypoxia inducible factor (HIF).(3) HIF stabilization leads to activation of genes that promote angiogenesis (VEGF, PDGF). Pro-angiogenic tyrosine kinase receptors (VEGFR, PDGFR) are the primary targets for TKIs approved in this disease. Recently, other common molecular drivers of ccRCC have been identified. These mutations commonly involve chromatin-remodeling genes (PBRM1, KDM5C, SETD2, and BAP1).(4) The predictive and prognostic significance of recurrent somatic mutations and gene expression patterns in tumor tissue have previously been explored in TKI treated patients, but a complete understanding of the determinants of treatment response is incomplete.(5),(6) Here, we report the results of the largest molecular analysis of TKI-treated metastatic ccRCC patients. We identify genomic and transcriptional determinants of treatment response, involving relevant aspects of angiogenesis and the immune TME. Furthermore, we propose molecular subgroups that reflect distinctly different survival outcomes after TKI therapy. Our findings set the stage for molecularly defined strategies to personalize therapy in metastatic ccRCC.
RESULTS
Gene expression clustering identifies four biologically distinct molecular subgroups associated with differences in tyrosine kinase inhibitor (TKI) efficacy
We analyzed clinical outcomes and molecular features of archival tumor specimens prospectively collected for patients enrolled on the phase III COMPARZ trial. 7 This international randomized study confirmed progression-free survival (PFS) non-inferiority of first-line pazopanib vs. sunitinib in patients with advanced clear cell RCC (ccRCC) and reported comparable overall survival (OS) for both agents in a secondary analysis.(7,8)
We performed unsupervised consensus nonnegative matrix factorization (cNMF) clustering on the expression microarray data from 409 patients (212 sunitinib, 197 pazopanib treated) in the COMPARZ trial and identified four biologically distinct clusters based on the 1500 most variable genes (Fig. 1a). The clusters were associated with significant differences in median OS (p=2.00E-4) and PFS (p=0.03) with cluster 4 demonstrating the worst OS when compared to clusters 1–3 (HR 2.09; 95%CI: 1.47–2.97; p=4.58E-5) and PFS (HR 1.54; 95%CI: 1.13–2.09; p=5.72E-3) (Fig. 1b). Cluster 4 demonstrated worse OS compared to each cluster individually. For PFS, cluster 4 was only worse when compared to cluster 3 (data not shown). Due to the similar median PFS and OS between clusters 1–3, we decided to compare cluster 4 to clusters 1–3 for the remainder of our analyses.
Figure 1. Consensus NMF clustering identifies four biologically distinct clusters associated with different survival outcomes after TKI therapy.
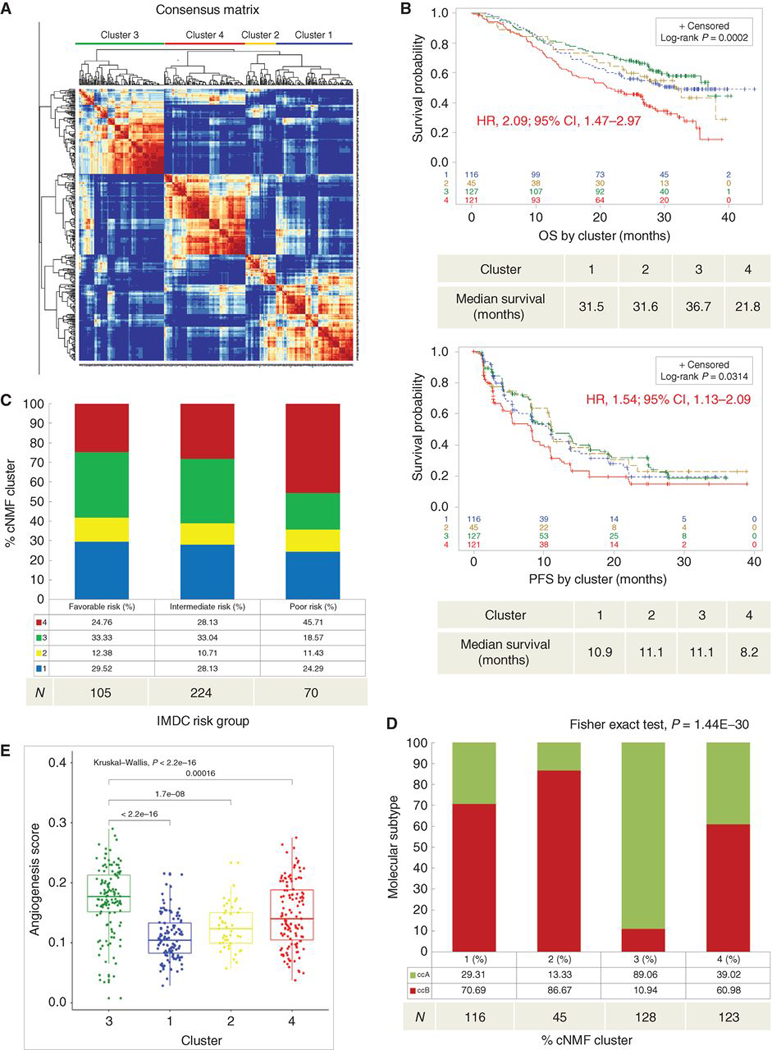
(a) Unsupervised cNMF clustering from 412 patients identified four robust clusters based on the 1500 most variable annotated genes. (b) Kaplan-Meier curves depict OS (upper) and PFS (lower) by cluster. Censored data are indicated by vertical tick marks in the curves. All P values are calculated by log-rank test. HR and CI values for OS and PFS were extracted from Cox proportional hazard regression models comparing cluster 4 (worst survival) to cluster 3 (best survival). (b-e) Sample number per group indicated below each graph. (c) Describes the percent distribution of clusters within IMDC risk groups. (d) Describes the percent distribution of ClearCode34 ccRCC molecular subtype within each cluster. (e) Comparison of angiogenesis scores across clusters. TKI, tyrosine kinase inhibitor; cNMF, consensus nonnegative matrix factorization; OS, overall survival; PFS, Progression-free survival; HR, hazard ratio; CI, confidence interval; IMDC, International Renal Cell Carcinoma Database Consortium.
The international metastatic database consortium (IMDC) risk model is a validated tool used to prognosticate patients with metastatic RCC utilizing criteria including time from surgery to systemic therapy, performance status and laboratory values (Hemoglobin, calcium, neutrophil and platelet counts). The number of adverse features is added as a score which then serves to categorize patients as favorable, intermediate or poor risk.(9) Patients in the IMDC poor risk group were enriched with cluster 4 (45.7%) compared to clusters 1–3 (Fisher’s Exact test, p=0.009; Fig. 1c). Furthermore, patients with progressive disease (PD), as defined by RECIST 1.0 criterion(10), were enriched with cluster 4 (Chi-square test, p=0.017) compared to those with stable disease (SD), complete response (CR) or partial response (PR) (Supplementary Fig. 1c). We additionally assessed differentially expressed genes (DEG) and Ingenuity pathways analysis (IPA) to compare PD to CR/PR and found that patients with PD to TKI therapy demonstrate significant enrichment of up-regulated genes involved in inflammatory pathways (IFN-γ, IFN- α, inflammatory response, IL-6, and TNF-α signaling) (Supplemental Fig. 1d,e). These findings are further supported by the IPA results demonstrating enrichment in canonical pathways involved in IL-8, macrophage phagocytosis and enrichment in immune cell programs (Supplemental Fig. 1f,g).
The distribution of ClearCode34 (ccA/ccB) molecular subtypes, RNA signatures closely associated with ccRCC prognosis and previously validated in the metastatic setting,(11,12) were significantly different among the four clusters (Fisher’s Exact test, p=1.44E-30) (Fig. 1d). Notably, cluster 3, which performed most favorably per comparison of PFS, OS and IMDC distribution, was strongly enriched for ccA (89%), previously associated with improved survival outcomes and distinct from ccB by an upregulation of angiogenesis genes (FLT4, FLT1, VEGFB, ENG, KDR, BAI1).(11) To assess overall differences in angiogenesis gene expression between clusters, we utilized an established angiogenesis (Angio) gene expression signature.42 Angiogenesis gene expression was significantly different between the 4 clusters (Kruskal-Wallis test, p=2.20E-16), where cluster 3 had the highest angiogenesis gene expression levels and cluster 1 had the lowest (Fig. 1e).
TP53 and BAP1 mutations are enriched in cluster 4
Next, we explored differences in the frequency of mutations in common ccRCC cancer driver genes between the clusters. Cluster 4 had similar overall mutational load compared to clusters 1–3 (Wilcoxon test, p=0.12; Supplementary Fig. 1a). Somatic PBRM1 mutations, which previously demonstrated favorable prognostic effects among TKI-treated patients,(5) were less frequent in cluster 4 (Fisher’s Exact test, p=0.003), while cluster 4 was enriched for presence of TP53 (Fisher’s Exact test, p=0.03) and BAP1 (Fisher’s Exact test, p=0.05) mutations (Supplementary Fig. 1b), which conferred adverse outcomes in prior analyses.(5,13) There were no significant differences in SETD2, TERT promoter, KDM5C, or VHL mutation frequencies between clusters (data not shown).
Angiogenesis gene expression program is associated with TKI response and survival
Since significant differences in angiogenesis gene expression occurred between clusters, we explored its impact on TKI response and survival outcomes. Among the entire COMPARZ cohort, higher angiogenesis gene expression levels were associated with improved objective response rate (by RECIST 1.0(10)) (Kruskal-Wallis test, p=0.03) (Fig. 2a). The association of angiogenesis gene expression with TKI response (by RECIST 1.0) was validated in the Beuselinck cohort(6) comprised of 53 patients with metastatic ccRCC treated with sunitinib (Wilcoxon test, p=0.017) (Fig. 2b). Furthermore, the COMPARZ Angiohigh group (relative to the median angiogenesis score) demonstrated improved OS (HR 0.68; 95%CI: 0.52–0.90; p=6.11E-3) and PFS (HR 0.68; 95%CI: 0.53–0.88; p=2.49E-3) compared to the Angiolow group (Fig. 2c). Among IMDC risk groups, there was no significant difference in angiogenesis gene expression (Kruskal-Wallis test, p=0.64; Fig. 2d). Within cluster 4 alone, the Angiohigh group (relative to the median) did not demonstrate improvement in either OS (p=0.05) or PFS (p=0.08) when compared to the Angiolow group, although there was a similar trend (Supplementary Fig. 2a,b). Therefore, we hypothesized that angiogenesis programs alone do not explain the poor outcomes demonstrated in cluster 4.
Figure 2. High angiogenesis gene expression is associated with improved TKI response and survival.
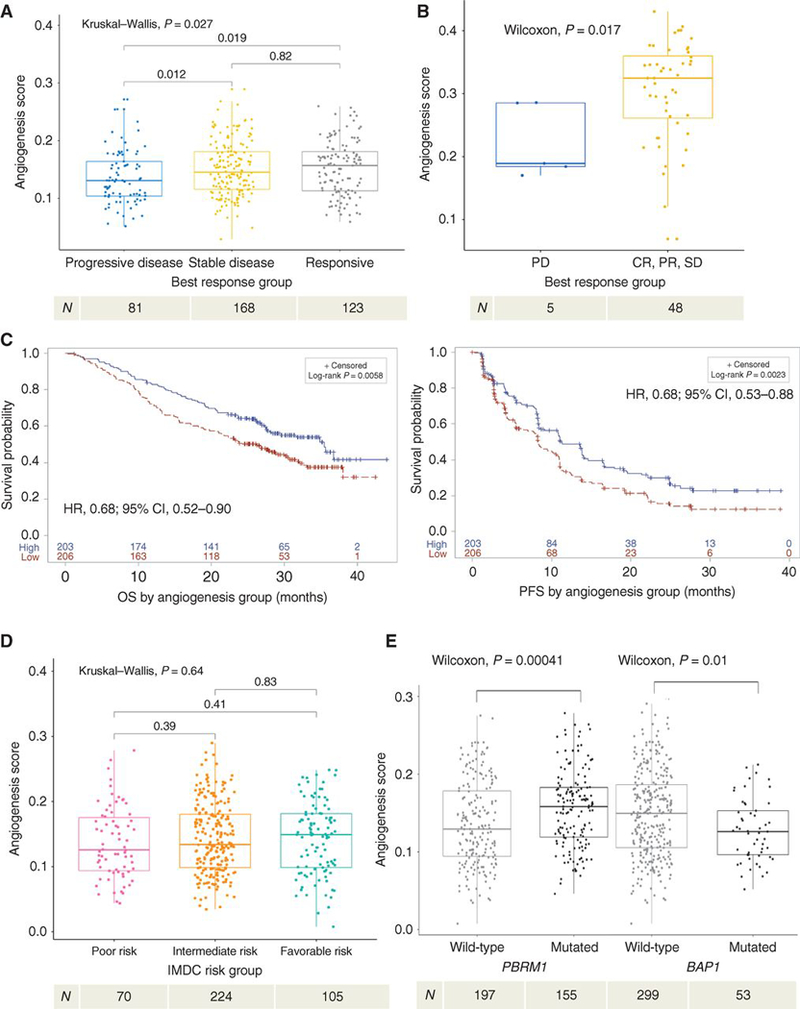
(a) Demonstrates objective response, by RECIST 1.0, to TKI therapy based on angiogenesis score. (b) Beuselinck cohort validation of objective response, by RECIST 1.0, to TKI therapy based on angiogenesis score. (c) Kaplan-Meier analyses demonstrating the impact of angiogenesis gene expression (Angiohigh vs Angiolow, based on median score) on OS (left) and PFS (right) among all patients in COMPARZ. (d) Demonstrates angiogenesis score by IMDC risk group. (e) Demonstrates angiogenesis score by mutation status of PBRM1 and BAP1. TKI, tyrosine kinase inhibitor; OS, overall survival; PFS, progression-free survival; IMDC, International Renal Cell Carcinoma Database Consortium; HR, hazard ratio; CI, confidence interval. All HR and CI values for PFS and OS were extracted from Cox proportional hazard regression models. Sample number per group indicated below each graph. RECIST 1.0 objective response is categorized as: PD, progressive disease; CR, complete response; PR, partial response; or SD, stable disease.
Next, we assessed the impact of somatic mutations on angiogenesis program expression levels. Tumors harboring PBRM1 mutations demonstrated higher angiogenesis gene expression (Wilcoxon test, p=4.00E-4; Fig. 2e). These findings are consistent with recent in vitro and murine studies, which suggest that PBRM1 inactivation leads to further upregulation of HIF-1 via STAT3(14,15) as well as a recent report by McDermott et al(16). In line with our earlier findings, we found that patients in cluster 3 had the highest frequency of PBRM1 mutations (54.2%) compared to other clusters (Chi-Square test, p=0.009). Patients with BAP1 mutations had lower angiogenesis gene expression (Wilcoxon test, p=0.01; Fig. 2e). SETD2, KDM5C, TERT promoter and TP53 mutations were not associated with significant differences in angiogenesis gene expression (data not shown). We do not report the effect of VHL loss on angiogenesis gene score as data regarding methylation status of VHL was not available;. Utilizing the TCGA KIRC cohort,(4) we validated the association of BAP1 mutation status (Wilcoxon test, p=4.0E-6) with lower angiogenesis gene expression, and found that PBRM1 mutant tumors demonstrated a trend towards higher angiogenesis scores; however, this did not reach statistical significance (Wilcoxon test, p=0.12) (Supplementary Fig. 2c,d). In summary, PBRM1 and BAP1 mutational status correlate with angiogenesis gene expression and, overall, patients in the Angiohigh group demonstrate improved TKI response, OS, and PFS. However, the association between angiogenesis and survival is weakest in cluster 4.
Tumor immune infiltration is associated with differences in TKI efficacy
Recognizing the possible role of the tumor microenvironment (TME) in response to targeted therapy, we next performed pathway analyses to understand the underlying pathways in cluster 4, which exhibited the worst outcomes. We also used gene set enrichment analysis (GSEA) to identify differentially expressed genes between clusters 4 and 1–3. Consistent with the aggressive nature of these tumors, we saw enrichment of MYC targets, cell cycle and proliferation programs among genes upregulated in cluster 4. Strikingly, we identified enrichment for several hallmark inflammation signatures, such as inflammatory and IFN-ɣ responses (Fig. 3a, Supplementary Fig. 3a). Using ESTIMATE(17), we found that cluster 4 had the highest Immune Score, a marker of total immune infiltration, among all clusters (Kruskal-Wallis test, p=2.20E-16) (Fig. 3b). Using immunohistochemistry (IHC), PD-L1 positivity among tumors was found more frequently in cluster 4 where 60% of tumors demonstrated PD-L1 expression on tumor cells versus clusters 1–3 where 66% or more were PD-L1-null (Fisher’s Exact test, p=1.71E-8) (Fig. 3c). These findings suggest that cluster 4 is characterized by an immune infiltrated and suppressed TME.
Figure 3. Cluster 4 demonstrates enrichment in inflammatory pathways and macrophage infiltration.
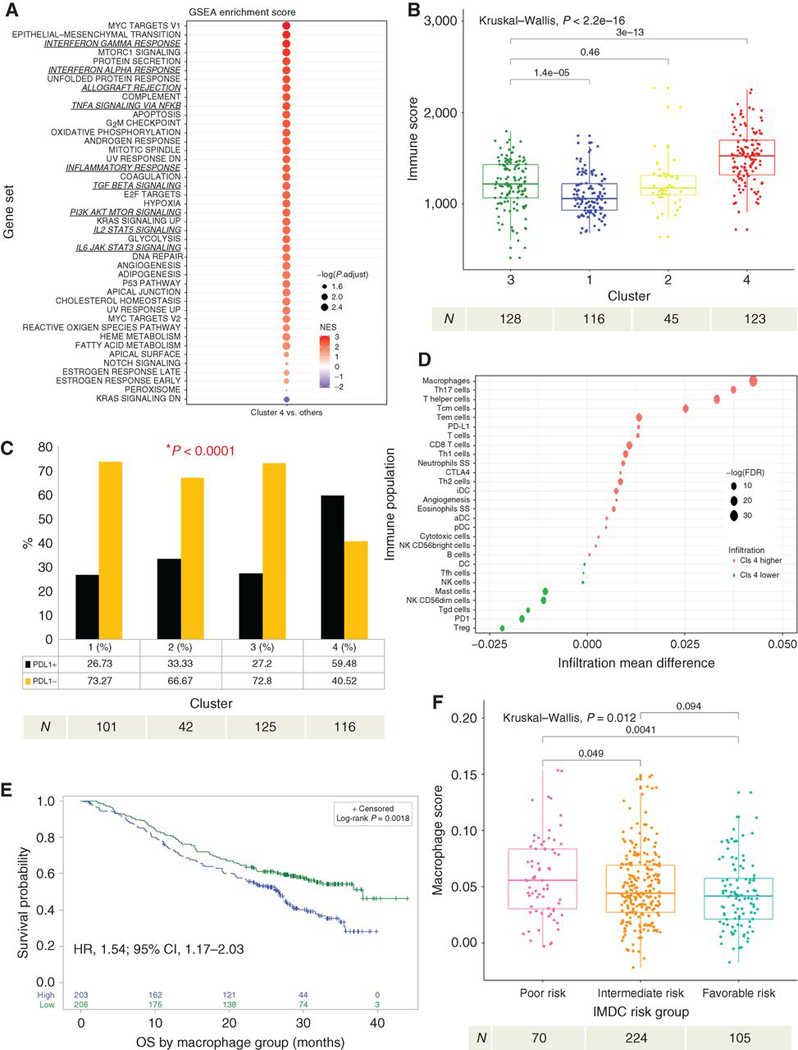
(a) GSEA analysis of hallmark gene sets comparing cluster 4 vs clusters 1–3. Enrichment scores are ranked and colored based on the NES and sized by the log10 transformed value of the adjusted p-value. (b) Demonstrates a comparison ofESTIMATE Immune Score within each cluster. (c) Demonstrates differences in the proportion of overall PD-L1 tumoral positivity by IHC in each cluster. P-value was derived using the Fisher’s Exact test. (d) Demonstrates ssGSEA immune deconvolution of cluster 4 versus clusters 1–3 with the mean infiltration differences noted on the x-axis and specific immune populations on the y-axis. The size of the circles represents the log of the FDR and color represents the directionality of the association. (e) Kaplan-Meier analysis demonstrating the impact of macrophage infiltration (Macrophagehigh vs Macrophagelow, based on median score) on OS among all patients in COMPARZ. (f) Demonstrates differences in macrophage infiltration by IMDC risk group. NES, normalized enrichment score; OS, overall survival; PFS, progression-free survival; GSEA, gene set enrichment analyses; ssGSEA, single sample GSEA; IHC, immunohistochemistry; FDR, false discovery rate; HR, hazard ratio; CI, confidence interval; IMDC, International Renal Cell Carcinoma Database Consortium. All HR and CI values for OS were extracted from Cox proportional hazard regression models. Sample number per group indicated below each graph.
Next, we performed immune deconvolution analyses via single-sample GSEA (ssGSEA)(18) to better characterize the tumor immune microenvironment in cluster 4 compared to clusters 1–3. Cluster 4 demonstrated enrichment for many immune populations (Fig. 3d), with macrophages showing the most significant (Wilcoxon test, q=8.52 E-33) infiltration difference and GSEA score (Normalized enrichment score (NES)=2.33, Kolmogorov-Smirnov test, p=0.0015) compared to clusters 1–3 (Supplementary Fig. 3b). Differentially expressed genes of cluster 4 compared to clusters 1–3 also demonstrated enrichment for immune and macrophage-related genes (Supplementary Fig. 3c). We then utilized dual macrophage (CD68+) and PD-L1 immunohistochemistry (IHC) staining to orthogonally validate this finding. Cluster 4 demonstrated a higher proportion of PD-L1 positive macrophages compared to clusters 1–3 (Fisher’s Exact test, p=3.50E-7; Supplementary Fig. 3d). Supplementary Table 3 summarizes the immune deconvolution results by cluster for comparison.
We then evaluated the impact of macrophage enrichment on survival within the COMPARZ cohort (regardless of cluster) using ssGSEA. We observed significantly worse OS (HR1.54; 95%CI: 1.17–2.03; p=1.98E-3) among subjects with high macrophage infiltration (Macrophagehigh, relative to the median macrophage score) (Fig. 3e). Furthermore, patients with progressive disease (PD), as defined by RECIST 1.0 criterion, had significantly higher macrophage infiltration (Kruskal-Wallis test, p=0.02) (Supplementary Fig. 3g). However, there was no significant difference in PFS between high and low macrophage infiltration subject groups although the same trend was found (HR 1.22; 95%CI: 0.95–1.56; p=0.11) (Supplementary Fig. 3h). Next, we hypothesized that type 2 macrophages, which are considered to be immunosuppressive,(19) are responsible for driving these associations with TKI response. Using CIBERSORT(20), we found that a high type 2 macrophage infiltration (M2high, relative to the median M2 score), was associated with poor OS (HR 1.38; 95%CI: 1.06–1.81; p=0.019) and PFS (HR 1.40; 95%CI 1.09–1.78; p=7.90E-3) compared to the M2low group (Supplementary Fig.3e). This association was attenuated when we evaluated the impact of both macrophage types(M1highM2high , relative to the median M1M2 score) on OS (HR 1.29; 95%CI: 0.99–1.70; p=0.063) and PFS (HR 1.29;95%CI 1.01–1.66; p=0.040) (Supplementary Fig. 3f). Of note, somatic mutations in BAP1, PBRM1, and TP53 were not associated with significant differences in macrophage infiltration (data not shown).
Utilizing ESTIMATE Immune Score(17) total immune infiltration was similar among IMDC risk groups (Kruskal-Wallis test, p=0.11) (Supplementary Fig. 3i). However, the extent of macrophage infiltration by ssGSEA score increased with worsening IMDC risk grouping (Kruskal-Wallis test, p=0.012; Fig. 3f) with the poor risk group demonstrating the highest macrophage score. In summary, cluster 4 demonstrates an immune infiltrated and regulated TME that is highly infiltrated with PD-L1 positive macrophages. Furthermore, Macrophagehigh infiltration alone is associated with worse OS and decreased objective response in TKI treated patients.
Flow cytometry and immunostaining analysis of ccRCC tumors prospectively collected at MSKCC
We utilized a cohort of 12 ccRCC patients whose primary tumor specimens were collected prospectively and analyzed via flow cytometry. Our gating strategy is demonstrated in Supplementary Fig. 4c. All patients went on to receive first-line TKI therapy (5 pazopanib, 7 sunitinib) for metastatic disease. We confirmed a trend towards higher proportion of activated tumor-associated macrophage (CD45+HLADR+CD3-CD19-CD14+CD16+) infiltration in TKI non-responders compared to responders (Wilcoxon one-tailed test, p=0.052) (Fig. 4a,b). In keeping with our genomic analyses, immunofluorescence staining of tumors from non-responders were more immune infiltrated overall compared to responders, and in areas with the highest CD45+ cell infiltrates, we noticed a higher density of CD68+ macrophages in non-responders (Fig. 4c).
Figure 4. IHC and IF validation of TKI response and macrophage infiltration.
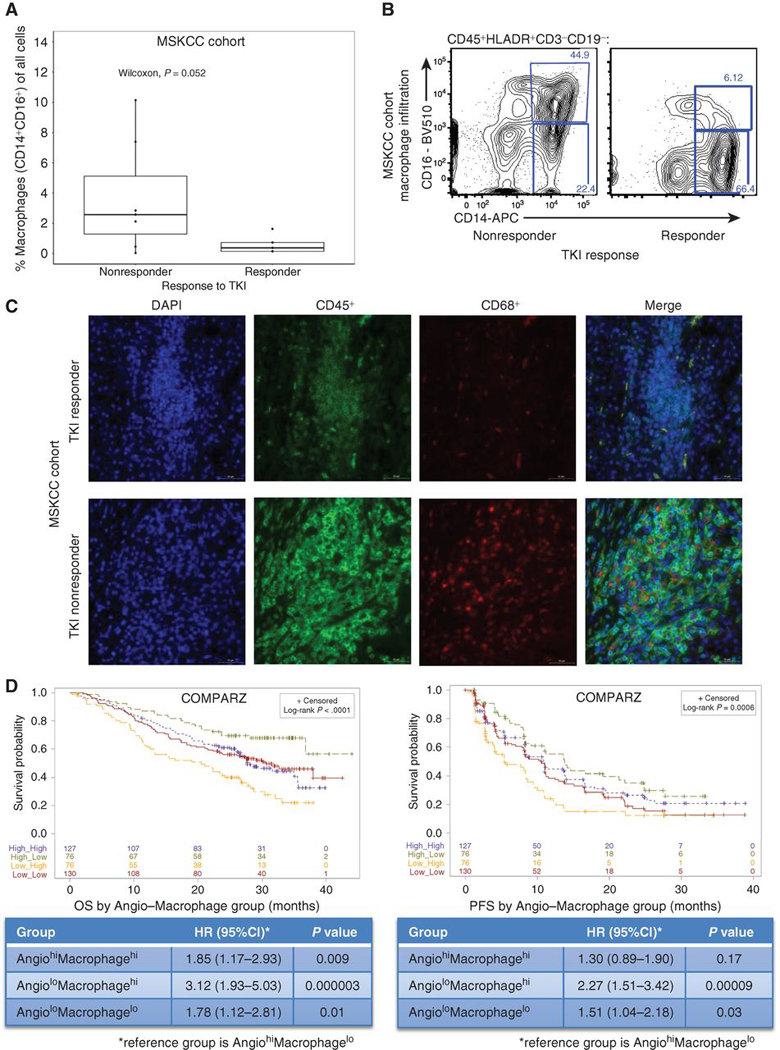
(a) Demonstrates macrophage infiltration (CD16+CD14+) by TKI response (responder defined as time to treatment failure of > 6 months vs ≤ 6 months for non-responders) in the MSKCC cohort. (b) Representative flow cytometry results demonstrating higher macrophage (CD16+CD14+) infiltration in a TKI non-responder versus responder in the MSKCC cohort. (c) Representative immunofluorescence demonstrating the difference in overall immune (CD45+) and macrophage infiltration (CD68+) in a TKI non-responder (RCC540) and responder (RCC563) in the MSKCC cohort. (d) Kaplan-Meier analyses demonstrating the impact of angiogenesis and macrophage score grouping on OS (left) and PFS (right) among all patients in COMPARZ. TKI, tyrosine kinase inhibitor; IF, immunofluorescence; IHC, immunohistochemistry; OS, overall survival; PFS, progression-free survival; HR, hazard ratio; CI, confidence interval. All HR and CI values for PFS and OS were extracted from Cox proportional hazard regression models.
Combined effects of angiogenesis and macrophage infiltration on survival among TKI-treated patients
Next, we sought to integrate the notable associations we observed for aspects of angiogenesis (angiogenesis score) and the immune TME (macrophage infiltration) and set out to compare four groups based on angiogenesis and macrophage enrichment scores, categorizing patients individually as either Angiolow / Angiohigh and Macrophagelow / Macrophagehigh. Strikingly, these groups demonstrated significant differences in median OS (p=1.74E-5) and PFS (p=0.0006; Fig. 4d). Patients in the AngiolowMacrophagehigh group demonstrated the worst outcomes compared to the AngiohighMacrophagelow group, which demonstrated the best survival outcomes, for OS (HR 3.12; 95%CI: 1.93–5.03; p=2.91E-6) and PFS (HR 2.27; 95%CI 1.51–3.42; p=8.58E-5) (Figure 4d). These findings suggest that angiogenesis and macrophage infiltration may be important mechanisms defining TKI response. Not surprisingly, cluster 4 is enriched with the Angiolow/highMacrophagehigh groups and cluster 3 demonstrates enrichment in AngiohighMacrophagelow/high groups (Chi-square test, p=3.37E-44) (Supplemental Fig. 4a). Similarly, the poor risk IMDC group was also enriched with Angiolow/highMacrophagehigh groups (Supplemental Fig. 4b). Furthermore, colony-stimulating factor-1 receptor (CSF1R) expression, involved in the development, survival and proliferation of monocytes and macrophages,(21) is highest among macrophagehigh groups (Supplementary Fig. 4d). Within the non-TKI treated KIRC TCGA cohort, we demonstrated that angiogenesis score (Supplementary Fig. 4e) is prognostic of cancer-specific survival (CSS), however macrophage infiltration is not (Supplementary Fig. 4f) associated with CSS.
Integrated genomic model improves prediction of clinical benefit in TKI-treated ccRCC patients
An integrated analysis of our data is shown in Fig. 5a. Cluster 4 is uniquely enriched with inflammasome and myeloid gene expression, cluster 3 is enriched with the angiogenesis expression program and has moderate immune-related gene expression while clusters 1 and 2 appear to have decreased expression of both angiogenesis and immune pathways. We then sought to assess how our genomic findings can improve the performance of IMDC risk prognostic model to stratify patients receiving first-line TKI therapy. Utilizing standard IMDC risk grouping alone for the COMPARZ biomarker population (n=409) predicted 2-year OS and PFS with a c-index of 0.63 and 0.60, respectively. Using a stepwise Cox proportional hazard model we determined the molecular variables that demonstrate prognostic value (p<0.1) in the presence of IMDC risk grouping and included TP53 and PBRM1 mutational status, angiogenesis score, and macrophage infiltration (Supplementary Table 2). Utilizing molecular variables alone, incorporating angiogenesis, macrophage infiltration, and PBRM1 and TP53 mutational status achieved a c-index of 0.63 for OS. Angiogenesis and macrophage infiltration were the strongest predictors of PFS with a c-index of 0.61. Notably, integration of molecular and IMDC variables improved the c-index for OS from 0.63 to 0.69 and PFS from 0.60 to 0.65. (Fig. 5b).
Figure 5. Summary oncoprint highlights the immune infiltration within cluster 4 compared to others and combininggenomic markers with IMDC improves survival prediction.
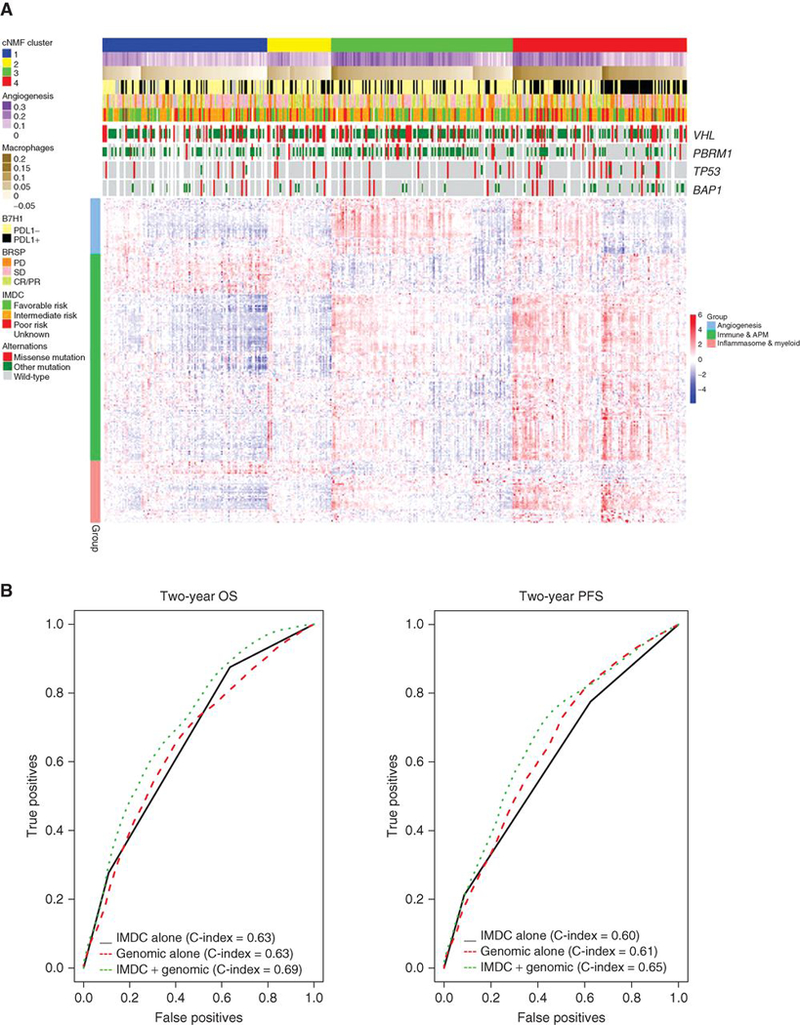
(a) (Upper heat map) Angiogenesis and macrophage scores, PD-L1 tumoral expression positivity by IHC, mutational status, the best response to TKI therapy by RECIST 1.0, IMDC and mutational status by cluster. (Lower heat map) Demonstrates angiogenesis, immune and antigen presenting machinery (APM), and inflammasome and myeloid gene expression differences by cluster. (b) Demonstrates multivariable model and c-index with the addition of genomic markers for OS (left) and PFS (right). OS, overall survival; PFS, Progression-free survival; IMDC, International Renal Cell Carcinoma Database Consortium; HR, Hazard Ratio; IHC, immunohistochemistry. RECIST 1.0 objective response is categorized as: PD, progressive disease; CR, complete response; PR, partial response; or SD, stable disease.
The effect of angiogenesis and macrophage infiltration on TKI response may differ by TKI received
TKIs for ccRCC are utilized for their potent inhibition of kinases responsible for tumor angiogenesis (VEGFR-2). However, TKIs also have significant off-target effects that may affect therapeutic efficacy. Notably, sunitinib is a more potent inhibitor of kinases involved in hematopoiesis (c-Ki, Flt3, CSF1R) compared to pazopanib.(21–24) In vivo and in vitro, sunitinib has been shown to decrease the concentration of myeloid-derived suppressor cells (MDSCs) and reverse T cell suppression by IFNγ in the TME.(25) The effects of pazopanib on the immune TME are less well understood and may differ, based on differences in target kinome Utilizing ssGSEA immune deconvolution analysis, we observed significant differences in interaction between TKI response and TME profiles when comparing patients treated with pazopanib versus sunitinib. Sunitinib-treated responders, defined as a complete response (CR) or partial response (PR), had increased angiogenesis, cytotoxic T cell and CD8+ T cell infiltration compared to those who had progressive disease (PD). By contrast, pazopanib-treated responders had lower macrophage infiltration compared to those who had PD, whereas angiogenesis score did not seem to discriminate TKI response (Fig. 6a). The combination of angiogenesis and macrophage infiltration significantly discriminates survival differences among pazopanib treated patients with AngiolowMacrophagehigh demonstrating the worst OS (HR 1.86; 95%CI: 1.00–3.46; p=0.05) and PFS (HR 6.01; 95%CI: 2.73–13.20; p=8.00E-6) compared to the AngiohighMacrophagelow group. However, among patients treated with sunitinib, the combination did not significantly discriminate OS (p=0.08) or PFS (p=0.07) (Fig. 6b,c). We tested angiogenesis alone by drug type and found that the Angiohigh group was associated with improved OS (HR 1.54; 95%CI: 1.07–2.25; p=0.022) and PFS (HR 1.56; 95%CI: 1.10–2.22; p=0.012) in the sunitinib cohort only (Supplementary Fig. 5a,b). On the contrary, the Macrophagehigh group had significantly worse OS (HR 2.62; 95%CI: 1.71–4.00; p=8.56E-6) and PFS (HR 1.85; 95%CI: 1.30–2.63; p=6.74E-4) compared to Macrophagelow group in the pazopanib cohort only, and survival did not differ between the sunitinib Macrophage groups (Supplementary Fig. 5c,d). In summary, the different components of the TME may affect response to the specific TKI used for treatment.
Figure 6. Immune infiltration differences and TKI response differ by specific type of TKI received.
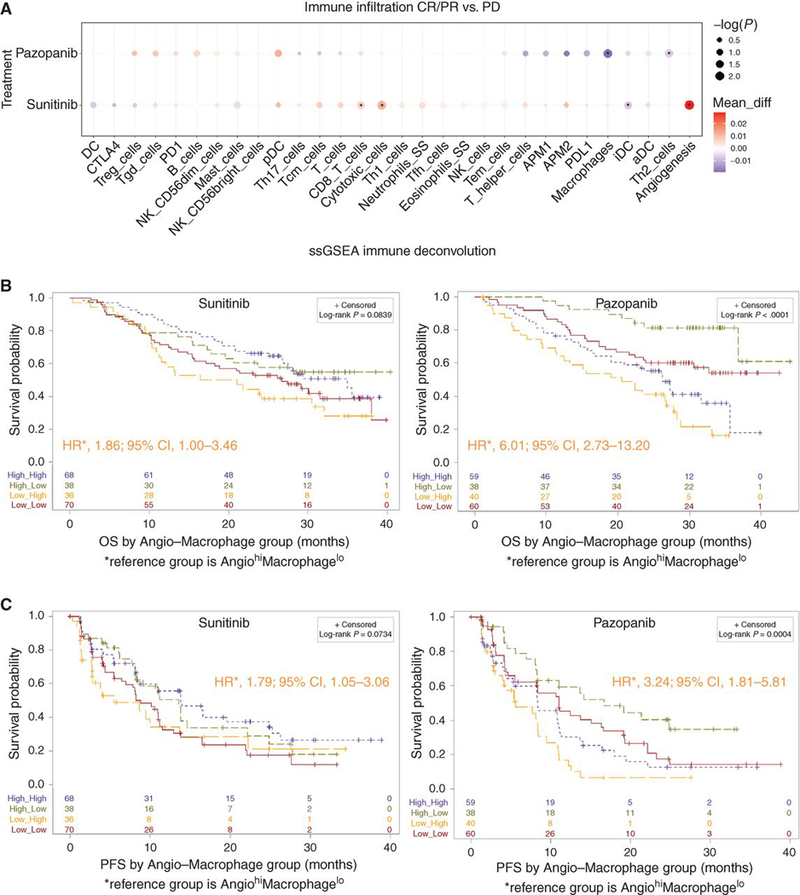
(a) Demonstrates differences in angiogenesis and immune infiltration by drug (sunitinib vs pazopanib) and response to therapy (CR/PR vs PD) where the x-axis demonstrates specific immune cell populations, differences in infiltration within each drug category are represented by the size (log10 transformed nominal p-value) and color (difference in mean ssGSEA score) of the circles; asterisks represent significant differences in infiltration between drug categories (p<0.05). (b) Kaplan-Meier analyses demonstrating the impact of angiogenesis and macrophage scores (Angiogenesishigh/lowMacrophagehigh/low, relative to the median) on OS among patients treated with sunitinib (left) and pazopanib (right). (c) Kaplan-Meier analyses demonstrating the impact of angiogenesis and macrophage scores (Angiogenesishigh/lowMacrophagehigh/low, relative to the median) on PFS among patients treated with sunitinib (left) and pazopanib (right). TKI, tyrosine kinase inhibitor; ssGSEA, single sample Gene Set Enrichment Analyses; OS, overall survival; PFS, Progression-free survival; HR, hazard ratio; CI, confidence interval. All HR and CI values for PFS and OS were extracted from Cox proportional hazard regression models. RECIST 1.0 objective response is categorized as: PD, progressive disease; CR, complete response; PR, partial response; or SD, stable disease.
DISCUSSION
We performed a comprehensive molecular analysis integrating somatic mutations, RNA and protein expression with clinical outcomes to evaluate predictors of TKI efficacy in the largest cohort of metastatic RCC reported to date. Archival tumor specimens were collected prospectively in patients receiving pazopanib versus sunitinib on the COMPARZ phase III trial. We identified four distinct molecular subgroups that differed significantly in response and survival. Detailed characterization of these clusters emphasized the central role of the TME for the outcome with TKI therapy and identified angiogenesis and macrophage infiltration as critical determinants of TKI response. Independent of IMDC risk category, we found a superior outcome for patients with higher angiogenesis scores (HR for PFS and OS 0.68 and 0.68, respectively). While these associations may merely constitute a prognostic signal, we also detected association with objective response (Fig 2a), a finding validated in the Beuselinck validation cohort (Fig. 2b), suggesting that angiogenesis score may indeed be associated with VEGFR directed TKI response. Varying effects on the TME, particularly the upregulation of angiogenesis, may also underlie the different clinical impact of mutation status for PBRM1 and BAP1, two of the most commonly altered genes in this disease after VHL and cumulatively altered in >50% of patients with metastatic clear cell RCC. Loss-of-function mutations in the two genes correlated inversely with outcomes in patients treated on COMPARZ, confirming findings in other TKI treated datasets.(5,13) We noted upregulation and suppression of angiogenesis observed with loss-of-function mutations in PBRM1 and BAP1, respectively, providing a plausible explanation for the different effects observed in clinical behaviors.
Critically, these findings are consistent with a recent report by McDermott et al(16) where they evaluated the randomized phase 2 Immotion150 study of atezolizumab (anti-PD-L1) alone or combined with bevacizumab (anti-VEGF) versus sunitinib in 305 patients with treatment-naive metastatic renal cell carcinoma. Patients with high angiogenesis gene score demonstrated a PFS advantage in the angio high arm (HR 0.31; 95%CI: 0.19–0.55; p<0.001). Similar to our analyses on COMPARZ, the authors also noted that PBRM1 mutated tumors also had higher angiogenic gene expression. The IMDC prognostic model has been multiply validated and is broadly applied in standard practice and clinical trial design.(9) While it encompasses some “host” factors that indirectly reflect systemic inflammatory effects of the cancer (e.g. anemia, neutrophilia, and thrombocytosis) it is agnostic to any molecular features of the individual cancer that may underlie such changes. With an increasing understanding of tumor biology and our growing ability to decipher the details of such on a molecular level, one should argue that integration of such information is the logical next step to improve our ability to prognosticate patients, possibly to guide the rational choice of agents.
In our analysis, cluster 4 was associated with the worst survival and enriched in the IMDC poor risk group (46%). This cluster was characterized by a high frequency of BAP1 and TP53 mutations, moderate angiogenesis, high immune infiltration, and notably higher proportion of cases with PD-L1 expression on tumor cells by IHC when compared to clusters 1–3. BAP1 mutations have been associated with poor outcomes among patients with ccRCC.(26,27) Much of the above suggests notable overlap between cluster 4 as defined here and an ‘inflamed subtype’ of RCC proposed in a recent report by Wang et al(28). who used an elegant approach across various xenograft models and via transcriptomic analyses defined a hyper-infiltrated molecular variant of RCC, enriched for aggressive phenotypes, including BAP1 deficient tumors.
Further, cluster 4 is similar to the ccrcc4 group identified by Beuselinick, et al.,(6) which was associated with sarcomatoid differentiation, upregulation of MYC and cellular immune pathways, and poor response to sunitinib. Cluster 3 demonstrated the best survival and comprised about one-third of the IMDC favorable and intermediate risk groups. This cluster was characterized by enrichment in PBRM1 mutations, high angiogenesis, and moderate immune infiltration. This cluster appears to be similar to the ccA molecular subtype reported by Brannon, et al.(11) and the ccrcc2 cluster reported by Beuselinck, et al.(6) both of which are characterized by high angiogenesis and improved survival outcomes.
Independent of clusters, we investigated differences in the angiogenesis program and immune TME across all subjects in COMPARZ. We demonstrated that enrichment in angiogenesis gene expression was associated with improved TKI response, OS, and PFS. These findings are consistent with results from Beuselinck, et al.(29) where high angiogenesis (VEGFA, VEGFR1, VEGFR2, VEGFR2, and HIF2A) was associated with improved response to sunitinib. Within the immune TME, the strongest signal was seen for tumor-infiltrating macrophages. Due to a lack of available gene signatures for MDSCs, we were unable to assess this population using ssGSEA immune deconvolution.(30) In the overall cohort, the Macrophagehigh group demonstrated worse PFS and was enriched among the IMDC poor risk group. As a resistance mechanism, tumors may express the chemokine colony stimulating factor-1 (CSF1) to help recruit peripheral monocytes that eventually differentiate into tumor-associated macrophages (TAM).(31) TAMs, also produce VEGF and other angiogenic proteins that may sustain angiogenesis and promote a state of immunosuppression that may promote TKI-resistance.(31,32),(33)
With angiogenesis score and macrophage infiltration in the TME showing the strongest associations with survival outcomes, we sought to better understand the combined effect. Our multivariate Cox regression analysis demonstrated that loss of function TP53 and PBRM1 mutations, angiogenesis and macrophage infiltration were independently prognostic for OS and PFS after adjusting for IMDC classifications. Utilizing a combination of these molecular markers we improved our ability to stratify OS and PFS (Figure 5b). Specifically, the incorporation angiogenesis and macrophage infiltration improved the baseline c-index for OS from 0.63 with IMDC risk stratification alone to 0.69 after the addition of molecular markers. This is in comparison to a recent report demonstrating a c-index of 0.63 after the addition of ccA and ccB molecular subtypes(11) to a baseline IMDC model with a c-index of 0.60.(12) Importantly, we also found different associations between treatment and survival when we considered angiogenesis and macrophage infiltration.
While the primary analysis of the COMPARZ trial suggested similar efficacy for both TKIs,(7) we demonstrated distinctly different interactions with the TME for each agent. High macrophage infiltration was a strong adverse prognostic factor in pazopanib treated patients. In contrast, we found that macrophage infiltration among sunitinib-treated patients did not differentiate survival outcomes. This is consistent with the known roles of sunitinib in reducing accumulation of immunosuppressive myeloid-derived suppressor cells and T regulatory cells within primary tumors, and thus enhancing the infiltration and cytotoxicity of CD8+ and CD4+ tumor-infiltrating lymphocytes.(25,34,35) These findings were also validated in the Beuselinck cohort where sunitinib treated patients demonstrated differences in objective response by angiogenesis alone and not macrophage infiltration. In contrast, reduced macrophage and Th2 gene signatures correlate with improved survival in pazopanib treated patients. The mechanism of action of pazopanib is poorly elucidated but our results prompt questions about how these anti-inflammatory populations might counteract the anti-tumor functions of pazopanib. These findings warrant further investigation and should motivate separate analyses for other TKIs routinely used in this disease; ultimately, they could inform the rational choice of agent based on baseline analysis of tumor tissue. Our results give biologic insights into possible mechanisms by which the TME might affect the efficacy of specific drugs. Furthermore, these findings need to be validated and explored in immunotherapy trials. Further, with several agents being applied in combinations trials with checkpoint-inhibitors(1) it is important to consider these notable differences in the TME interaction as we interpret trial results and conduct correlative analyses. Further, better understanding of the TME may inform the development of non-TKI based combinations. In our study, patients in the Angiohigh/lowMacrophagehigh groups demonstrated the highest CSF1R expression by RNAseq (Kruskal-Wallis test, p=2.02E-16). CSF1R inhibitors could be a potential therapeutic avenue to explore in patients with high macrophage infiltration. However, we recognize that expression of CSF1R does not guarantee response to these inhibitors and that there are other potential targets such as FLT3 and c-Myc that may be responsible for some of the changes seen in the tumor immune microenvironment and need to be explored further.(24)
Our study is not without limitations. First, our Beuselinck and MSKCC validation cohorts were small, however, despite these small numbers we still see an initial signal consistent with the major findings of our study. Furthermore, flow cytometry studies can only be performed prospectively. We recognize that these findings are based on a detailed characterization of a single region of the primary tumor and ccRCC demonstrates significant intratumor heterogeneity.(36) Serie et al.(37) recently demonstrated, among 111 patients, that ccA/ccB molecular subtypes differed between the primary and matched metastatic tumors in 43% of cases. Therefore, future studies need to assess regional differences in angiogenesis and macrophage infiltration in primary tumors and between matched primary-metastatic tumor pairs. Finally, because both arms in the COMPARZ analysis receive anti-VEGF therapy, we cannot definitively conclude that our TME subgroups represent the optimal predictive biomarkers.
In conclusion, our angiogenesis and macrophage infiltration grouping demonstrate prognostic value among patients treated with TKI therapy. We speculate that patients in the AngiohighMacrophagelow group may benefit most from pazopanib therapy alone, while the AngiohighMacrophagehigh/low group may benefit from a combination of sunitinib and macrophage-directed immunotherapy (e.g. CSF1R inhibition). Furthermore, the AngiolowMacrophagehigh group may benefit from targeted CSF1R inhibition.(21) In our study, the favorable risk group was most enriched in cluster 3 (33%), which has the highest angiogenesis and lowest macrophage infiltration, and least enriched with cluster 4 (25%). These findings are supported by the recently presented results comparing ipilimumab plus nivolumab versus sunitinib (CheckMate 214), which demonstrated improved outcomes among the favorable IMDC risk group with sunitinib.(38) Our findings highlight the importance of angiogenesis and macrophage infiltration in response to TKI therapy which should be exploited further to personalize treatments, develop novel therapies, and improve outcomes among patients with metastatic RCC.
METHODS
Clinical Cohorts.
COMPARZ cohort.
We analyzed data from patients who were enrolled in the COMPARZ clinical trial, which was conducted in accordance with the Declaration of Helsinki. All patients provided written informed consent for participation in the clinical trial.(7) Formalin-fixed paraffin-embedded (FFPE) tumor blocks were collected at baseline from 486 patients, of whom 453 patients had sufficient tissue available and provided consent for analysis: 221 in the pazopanib arm and 232 in the sunitinib arm. Response to treatment was assessed using RECIST 1.0.(10)
Clear cell RCC (KIRC) TCGA validation cohort.
Data were abstracted from 500 patients with ccRCC profiled by the Cancer Genome Atlas (TCGA).(4) Of these, 424 (84.8%) had clinical data including cancer-specific survival (CSS), 465 (93%) RNAseq , and 499 (99.8%) mutational data for VHL, PBRM1, BAP1, KDM5C, and SETD2. Systemic therapy treatment and response were not reliably documented and therefore not used in our analyses. RNAseq and mutation data were downloaded from the NIH Genomic Data Commons (https://gdc.cancer.gov/).
Beuselinck validation cohort.
This cohort was comprised of 121 patients undergoing nephrectomy from 1994 to 2011 and were subsequently treated with standard doses of sunitinib after the development of metastatic ccRCC.(6) Of the 121 patients, 29 (24%) had prior cytokine immunotherapy (IL-2 or Interferon). Overall, 53 patients representing 53 tumor tissue samples had transcriptomic data (HuGene 1.0ST Affymetrix array) available for review. Gene expression data (E-MTAB-3267) was downloaded from ArrayExpress (https://www.ebi.ac.uk/arrayexpress/). Response to treatment was assessed using RECIST 1.0.(10)
MSKCC validation cohort.
Tumor and adjacent normal tissue were collected from 49 ccRCC patients at the time of nephrectomy for flow cytometry and mirror FFPE blocks made for immunofluorescence. 12 (24.5%) patients went on receive TKI therapy (7 sunitinib/5 pazopanib). TKI response was determined by the time to treatment failure (TTF), defined as progression of disease, recurrence death from disease, or start of second-line therapy. TTF of ≤ 6 months were considered non-responders and TTF > 6 months considered responders.
Immunohistochemistry (IHC) for clinical samples (COMPARZ).
PD-L1 expression quantification in the FFPE samples from the COMPARZ trial was performed using IHC per previously validated protocols and has been described in detail by Choueiri TK, et al.(39) Briefly, patients were categorized as PD-L1/B7H1 positive when any tumor cell positivity was detected (H-score (HS) > 0). In all cases showing any possible staining for PD-L1, a dual-color PD-L1/CD68+ stain was performed on adjacent sections to differentiate PD-L1 expression by tumor cells from that by tumor-associated macrophages (TAM). The number of TAMs expressing PD-L1 was noted separately and semiquantitatively graded as absent, rare, moderate, or numerous. The TAM PD-L1 staining was not included in the final PD-L1 HS. Patients were categorized as TAM PD-L1 positive when patients had absent, rare, moderate or numerous TAM PD-L1 staining.
Next-generation sequencing (COMPARZ).
All patients had previously given consent for sequencing purposes. DNA from the primary tumors and matched normal tissue was extracted using DNA easy kit (Qiagen) according to a standard protocol and subjected to analysis. Germline mutations were ruled out by analysis of adjacent non-tumoral tissue or normal germline for every sample. A minimum of 40 ng of DNA was required for IMPACT sequencing. Samples from 377 (92%) patients were extracted with adequate DNA yields and sequenced using the MSK-IMPACT assay(40), a hybridization capture-based next-generation sequencing assay for targeted deep sequencing (approx. 500x) of all exons and selected introns of 410 oncogenes, tumor suppressor genes, and members of pathways deemed actionable by targeted therapies. Details on the MSK-IMPACT panel of targeted genes are provided in Supplementary Table 1.
Microarray analyses (COMPARZ).
409 patients had microarray and clinical data available for analyses. RNA from the primary tumors was extracted by AltheaDx in 2013 according to using Qiagen RNAeasy FFPE kit with a modified deparaffinization step. Gene expression profiles were derived via Affymetrix GeneChip HTA 2.0 (Affymetrix).
Computational analysis of microarray and RNAseq data.
For the KIRC TCGA cohort only, RNA-seq gene level count values were computed by the summarizeOverlaps function from the R package “GenomicAlignments”(41) with UCSC KnownGene(42) in hg19 as the base gene model. The Union counting mode was used and only mapped paired reads were considered. FPKM (Fragments Per Kilobase Million) values were then computed from gene level counts by using fpkm function from the R package “DESeq2.”(43)
RNA microarray data from the COMPARZ trial was normalized to log2 value. Probes without corresponding gene symbol found were excluded from further analysis. For genes matched with multiple probes, the probe with maximum Median Absolute Deviation (MAD) is chosen for representing the expression of the gene. The log2 normalized expression values were used for cNMF clustering and immune deconvolution analyses. For DEG and individual gene analyses, the quantile normalization values were used. QC of micro array did not demonstrate any clusters or similarity.
Gene signatures.
A previously published angiogenesis signature(44) was utilized to measure an overall angiogenesis score. Two distinct computational methods, ssGSEA(18) and CiberSort(20), were chosen for immune deconvolution analyses. ssGSEA takes the sample gene expression values as the input and computes an overexpression measure for the given gene list of immune cell type relative to all other genes in the transcriptome. On the other hand, CiberSort also takes gene expression values as the input but uses a gene expression signature matrix of particular immune cell types instead to compute the infiltration level of each immune cell type. The LM22 immune cell signature which is validated and published along with CiberSort was used. Marker genes of immune cell types for ssGSEA were obtained from Bindea et al.(45) and Senbabaoglu et al.(46) Infiltration levels for different immune cell types and angiogenesis scores were quantified using the ssGSEA implementation R package “gsva.”(18,47) ESTIMATE,was used to calculate an Immune Score which is the estimate of immune cells in tumor tissue, is calculated through the “estimate” R package(17) based on given gene expression profile in FPKM or normalized log2 transformed values.
Clustering analysis.
Consensus Nonnegative Matrix Factorization (cNMF) analysis was performed through the R “NMF” package (version 0.20.6).(48) The top 1,500 genes with highest MAD were included for cNMF analysis. The number of clusters was evaluated between 2 to 6 with each being replicated 30 times for consensus clustering. After considering the Cophenetic coefficient, Silhouette distribution, Residual Sum of Squares, and reported clustering in TCGA KIRC(4) and Beuselinck(6) studies, a k = 4 clustering was determined.
Analysis of Differentially Expressed Genes (DEG).
The R package “limma” (version 3.29.0) was used for DEG.(49) Limma powers differential expression analyses for RNA-sequencing and microarray studies. Limma returned empirical Bayes moderated-t p-values and adjusted P-values (Q-value) to correct for multiple comparisons testing using the Benjamini-Hochberg method to control the false discovery rate (FDR). Genes with an FDR less than 1% (Q < 0.01) and fold change greater than 20% were subjected to IPA analysis.
Ingenuity pathway analysis (IPA).
IPA (Ingenuity, CA) was used for running Canonical Pathway and Diseases & Biofunctions analyses over the genes differentially expressed between clusters 4 and clusters 1–3.
Gene Set Enrichment Analysis (GSEA).
Differentially expressed gene (DEG) analysis results were used in GSEA(50) analyses against the MSigDB Hallmark gene sets (http://software.broadinstitute.org/gsea/msigdb).
Flow cytometry for clinical samples (MSKCC).
Clear cell RCC patient tissue specimens were prepared by mechanical disruption using a razor blade followed by treatment with 280 U/mL Collagenase Type 3 (Worthington Biochemical) and 4 ug/mL DNase I (Sigma) at 37°C for 1 hour with periodic vortexing. Digested tissues were passed through 70 um filters. Resulting cells were resuspended in 44% Percoll – 66% Percoll gradient (Sigma) and centrifuged for 30 minutes at 1,900 g with no brake. Mononuclear cells were collected and immediately stained for flow cytometry analysis following Fc blocking (company) and live/dead staining (company). The antibodies used for flow cytometry were: HLA-DR (L243, Biolegend #307618), CD14 (HCD14; Biolegend #325608), CD45 (2D1; eBioscience 11–9459-42), CD16 (3G8; Biolegend 302008), CD56 (HCD56; Biolegend 318318), and CD3 (7D6; Invitrogen MHCD0317). Tumor-associated macrophages (TAM) were identified as CD45+CD3–Lin-HLA-DR+CD14+CD16+. Data are reported as the percent of all cells.
Immunofluorescence (IF) for clinical samples (MSKCC).
Unstained pathologic slides of 6 renal tumors from previously untreated patients who underwent either radical or partial nephrectomy for sporadic, resectable ccRCC were obtained and reviewed by a genitourinary pathologist prior to IF. Paraffin-embedded tissue sections underwent heat-induced antigen retrieval in 10mM sodium citrate buffer. Standard IF was performed with primary antibodies against human CD68 (Thermo Scientific, catalog #ms-397-p) and CD45 (CST, clone #D9M8I). Species-specific secondary antibodies (All Abcam) were used. A Leica upright confocal microscope was used to capture images. Due to the small number of cases analyzed, we report the overall pattern of staining of tumors from non-responders (n=5) compared to responders (n=1), and in areas with the highest CD45+ cell infiltrates, we reported a high or low density of CD68+ macrophages.
Statistical analysis.
Differences in patient characteristics and genomic status were tested using Fisher’s exact test and Chi-Square test (SAS 9.4, SAS Institute Inc., Cary, NC, USA) for categorical variables and the Wilcoxon rank sum test (R package “ggpubr” version 0.1.5, Alboukadel Kassambara (2017). ggpubr: ‘ggplot2’ Based Publication Ready Plots. R package version 0.1.5. https://CRAN.R-project.org/package=ggpubr) for continuous variables between sample groups. The Kruskal-Wallis test (R package “ggpubr” & SAS 9.4) was used for comparisons between three or more groups of continuous variables. Survival time was calculated from the first TKI treatment. Patients who were lost to follow-up or alive at the time of the study were treated as censored events. Survival curves were calculated according to the Kaplan–Meier method, and differences between curves were assessed using the log-rank test. The hazard ratio (HR) estimates and 95% confidence intervals (CI) were determined by the Cox proportional hazards regression modeling (SAS 9.4). To find clinical criteria related to PFS or OS, univariate modeling was performed on all the pathologic and clinical covariates. Covariates showing a significant association to prognosis (log-rank P < 0.10) at the univariate level were selected to be analyzed in multivariate models, after the exclusion of redundant covariates (see multivariate analysis) (SAS 9.4, SAS Institute Inc., Cary, NC, USA). All statistical analyses were post hoc; Statistical significance was set at p < 0.05.
Multivariate analysis.
OS and PFS were calculated from the date of start of TKI therapy to date of death or last follow-up up to 2 years. Patients alive at 2 years were censored with OS and PFS at 2 years. Variables that demonstrated prognostic value (P < 0.1) were carried forward. Clinicopathologic and genomic factors identified were then introduced into the multivariate analysis via backward stepwise Cox proportional hazard model (Supplementary Table 2). The discrimination of the nomogram for 2-year OS and PFS was measured by the concordance index (C-index) and observed survival probabilities respectively. Intermediate and poor risk IMDC groups were compared to the favorable group. For macrophage and angiogenesis gene expression scores, a z-score was calculated using log-transformed raw read counts. Z-scores were as a continuous variables.(51) Mutational status for PBRM1, BAP1, and TP53 was incorporated with the wild-type as the reference. C-index was calculated for the baseline clinical (IMDC alone), genomic (Genomic), and clinical plus genomic (IMDC + Genomic) models.
Supplementary Material
STATEMENT OF SIGNIFICANCE.
The determinants of response to tyrosine kinase inhibitor (TKI) therapy in metastatic clear cell renal cell carcinoma (RCC) remain unknown. Our study demonstrates that key angiogenic and immune profiles of the tumor microenvironment may affect TKI response. These findings have the potential to inform treatment personalization in patients with RCC.
ACKNOWLEDGMENTS
Funding: Ruth L. Kirschstein Research Service Award T32CA082088 (AS), Weiss Family Kidney Research Fund (AAH), Novartis (RJM, MHV), the Sidney Kimmel Center for Prostate and Urologic Cancers and the National Institutes of Health/National Cancer Institute to Memorial Sloan Kettering Cancer Center through the Cancer Center Support Grant, award number P30 CA008748 (AAH, RJM, MHV).
Footnotes
COMPETING FINANCIAL INTERESTS
RJM has received research grants from Novartis, Pfizer, BMS, GlaxoSmithKline, Genentech, Exelixis, and Eisai, consulting or advisory compensation from Pfizer, and compensation for providing expert testimony for Pfizer. TAC is a cofounder of Gritstone Oncology and receives research support from Bristol Myers Squibb, AstraZeneca, and Illumina. MV is a consultant for Eisai, Exelixis, Novartis, Pfizer, Calithera, and Corvus Pharmaceuticals.
Data availability. Access to the Beuselinck and KIRC TCGA cohort clinicopathologic, genomic, and transcriptome data are detailed in our methods section. Trial datasets for this trial will be available at https://www.clinicalstudydatarequest.com/Default.aspx after the medicine and indication have received EU and US regulatory approval on or after Jan 2014 and after the manuscript describing the trial results has been accepted for publication or published and no later than 18 months after the Study Completion Date (estimated June 30, 2018).
Abbreviations. Manuscript abbreviations are summarized in Supplementary Table 4.
REFERENCES
- 1.Choueiri TK, Motzer RJ. Systemic Therapy for Metastatic Renal-Cell Carcinoma. The New England journal of medicine 2017;376(4):354–66 doi 10.1056/NEJMra1601333. [DOI] [PubMed] [Google Scholar]
- 2.Gore ME, Larkin JM. Challenges and opportunities for converting renal cell carcinoma into a chronic disease with targeted therapies. British journal of cancer 2011;104(3):399–406 doi 10.1038/sj.bjc.6606084. [DOI] [PMC free article] [PubMed] [Google Scholar]
- 3.Brugarolas J Molecular genetics of clear-cell renal cell carcinoma. Journal of clinical oncology : official journal of the American Society of Clinical Oncology 2014;32(18):1968–76 doi 10.1200/jco.2012.45.2003. [DOI] [PMC free article] [PubMed] [Google Scholar]
- 4.Comprehensive molecular characterization of clear cell renal cell carcinoma. Nature 2013;499(7456):43–9 doi 10.1038/nature12222. [DOI] [PMC free article] [PubMed]
- 5.Hsieh JJ, Chen D, Wang PI, Marker M, Redzematovic A, Chen YB, et al. Genomic Biomarkers of a Randomized Trial Comparing First-line Everolimus and Sunitinib in Patients with Metastatic Renal Cell Carcinoma. European urology 2017;71(3):405–14 doi 10.1016/j.eururo.2016.10.007. [DOI] [PMC free article] [PubMed] [Google Scholar]
- 6.Beuselinck B, Job S, Becht E, Karadimou A, Verkarre V, Couchy G, et al. Molecular subtypes of clear cell renal cell carcinoma are associated with sunitinib response in the metastatic setting. Clinical cancer research : an official journal of the American Association for Cancer Research 2015;21(6):1329–39 doi 10.1158/1078-0432.ccr-14-1128. [DOI] [PubMed] [Google Scholar]
- 7.Motzer RJ, Hutson TE, Cella D, Reeves J, Hawkins R, Guo J, et al. Pazopanib versus sunitinib in metastatic renal-cell carcinoma. The New England journal of medicine 2013;369(8):722–31 doi 10.1056/NEJMoa1303989. [DOI] [PubMed] [Google Scholar]
- 8.Ruiz-Morales JM, Swierkowski M, Wells JC, Fraccon AP, Pasini F, Donskov F, et al. First-line sunitinib versus pazopanib in metastatic renal cell carcinoma: Results from the International Metastatic Renal Cell Carcinoma Database Consortium. European journal of cancer (Oxford, England : 1990) 2016;65:102–8 doi 10.1016/j.ejca.2016.06.016. [DOI] [PubMed] [Google Scholar]
- 9.Heng DY, Xie W, Regan MM, Warren MA, Golshayan AR, Sahi C, et al. Prognostic factors for overall survival in patients with metastatic renal cell carcinoma treated with vascular endothelial growth factor-targeted agents: results from a large, multicenter study. Journal of clinical oncology : official journal of the American Society of Clinical Oncology 2009;27(34):5794–9 doi 10.1200/JCO.2008.21.4809. [DOI] [PubMed] [Google Scholar]
- 10.Therasse P, Arbuck SG, Eisenhauer EA, Wanders J, Kaplan RS, Rubinstein L, et al. New guidelines to evaluate the response to treatment in solid tumors. European Organization for Research and Treatment of Cancer, National Cancer Institute of the United States, National Cancer Institute of Canada. Journal of the National Cancer Institute 2000;92(3):205–16. [DOI] [PubMed] [Google Scholar]
- 11.Brooks SA, Brannon AR, Parker JS, Fisher JC, Sen O, Kattan MW, et al. ClearCode34: A prognostic risk predictor for localized clear cell renal cell carcinoma. European urology 2014;66(1):77–84 doi 10.1016/j.eururo.2014.02.035. [DOI] [PMC free article] [PubMed] [Google Scholar]
- 12.de Velasco G, Culhane AC, Fay AP, Hakimi AA, Voss MH, Tannir NM, et al. Molecular Subtypes Improve Prognostic Value of International Metastatic Renal Cell Carcinoma Database Consortium Prognostic Model. The oncologist 2017;22(3):286–92 doi 10.1634/theoncologist.2016-0078. [DOI] [PMC free article] [PubMed] [Google Scholar]
- 13.Carlo MI, Manley B. Genomic Alterations and Outcomes with VEGF-Targeted Therapy in Patients with Clear Cell Renal Cell Carcinoma. Kidney Cancer 2017(1):49–56. [DOI] [PMC free article] [PubMed] [Google Scholar]
- 14.Nargund AM, Pham CG, Dong Y, Wang PI, Osmangeyoglu HU, Xie Y, et al. The SWI/SNF Protein PBRM1 Restrains VHL-Loss-Driven Clear Cell Renal Cell Carcinoma. Cell reports 2017;18(12):2893–906 doi 10.1016/j.celrep.2017.02.074. [DOI] [PMC free article] [PubMed] [Google Scholar]
- 15.Gao W, Li W, Xiao T, Liu XS, Kaelin WG Jr. Inactivation of the PBRM1 tumor suppressor gene amplifies the HIF-response in VHL−/− clear cell renal carcinoma. Proceedings of the National Academy of Sciences of the United States of America 2017;114(5):1027–32 doi 10.1073/pnas.1619726114. [DOI] [PMC free article] [PubMed] [Google Scholar]
- 16.McDermott DF, Huseni MA, Atkins MB, Motzer RJ, Rini BI, Escudier B, et al. Clinical activity and molecular correlates of response to atezolizumab alone or in combination with bevacizumab versus sunitinib in renal cell carcinoma. Nature medicine 2018. doi 10.1038/s41591-018-0053-3. [DOI] [PMC free article] [PubMed] [Google Scholar]
- 17.Yoshihara K, Shahmoradgoli M, Martinez E, Vegesna R, Kim H, Torres-Garcia W, et al. Inferring tumour purity and stromal and immune cell admixture from expression data. Nature communications 2013;4:2612 doi 10.1038/ncomms3612. [DOI] [PMC free article] [PubMed] [Google Scholar]
- 18.Barbie DA, Tamayo P, Boehm JS, Kim SY, Moody SE, Dunn IF, et al. Systematic RNA interference reveals that oncogenic KRAS-driven cancers require TBK1. Nature 2009;462(7269):108–12 doi 10.1038/nature08460. [DOI] [PMC free article] [PubMed] [Google Scholar]
- 19.Franklin RA, Li MO. Ontogeny of Tumor-associated Macrophages and Its Implication in Cancer Regulation. Trends Cancer 2016;2(1):20–34 doi 10.1016/j.trecan.2015.11.004. [DOI] [PMC free article] [PubMed] [Google Scholar]
- 20.Newman AM, Liu CL, Green MR, Gentles AJ, Feng W, Xu Y, et al. Robust enumeration of cell subsets from tissue expression profiles. Nature methods 2015;12(5):453–7 doi 10.1038/nmeth.3337. [DOI] [PMC free article] [PubMed] [Google Scholar]
- 21.Cannarile MA, Weisser M, Jacob W, Jegg AM, Ries CH, Ruttinger D. Colony-stimulating factor 1 receptor (CSF1R) inhibitors in cancer therapy. J Immunother Cancer 2017;5(1):53 doi 10.1186/s40425-017-0257-y. [DOI] [PMC free article] [PubMed] [Google Scholar]
- 22.Kumar R, Crouthamel MC, Rominger DH, Gontarek RR, Tummino PJ, Levin RA, et al. Myelosuppression and kinase selectivity of multikinase angiogenesis inhibitors. British journal of cancer 2009;101(10):1717–23 doi 10.1038/sj.bjc.6605366. [DOI] [PMC free article] [PubMed] [Google Scholar]
- 23.Papaetis GS, Syrigos KN. Sunitinib: a multitargeted receptor tyrosine kinase inhibitor in the era of molecular cancer therapies. BioDrugs : clinical immunotherapeutics, biopharmaceuticals and gene therapy 2009;23(6):377–89 doi 10.2165/11318860-000000000-00000. [DOI] [PubMed] [Google Scholar]
- 24.Davis MI, Hunt JP, Herrgard S, Ciceri P, Wodicka LM, Pallares G, et al. Comprehensive analysis of kinase inhibitor selectivity. Nature biotechnology 2011;29(11):1046–51 doi 10.1038/nbt.1990. [DOI] [PubMed] [Google Scholar]
- 25.Finke J, Ko J, Rini B, Rayman P, Ireland J, Cohen P. MDSC as a mechanism of tumor escape from sunitinib mediated anti-angiogenic therapy. International immunopharmacology 2011;11(7):856–61 doi 10.1016/j.intimp.2011.01.030. [DOI] [PMC free article] [PubMed] [Google Scholar]
- 26.Bi M, Zhao S, Said JW, Merino MJ, Adeniran AJ, Xie Z, et al. Genomic characterization of sarcomatoid transformation in clear cell renal cell carcinoma. Proceedings of the National Academy of Sciences of the United States of America 2016;113(8):2170–5 doi 10.1073/pnas.1525735113. [DOI] [PMC free article] [PubMed] [Google Scholar]
- 27.Joseph RW, Kapur P, Serie DJ, Parasramka M, Ho TH, Cheville JC, et al. Clear Cell Renal Cell Carcinoma Subtypes Identified by BAP1 and PBRM1 Expression. The Journal of urology 2016;195(1):180–7 doi 10.1016/j.juro.2015.07.113. [DOI] [PMC free article] [PubMed] [Google Scholar]
- 28.Wang T, Lu R, Kapur P, Jaiswal BS, Hannan R, Zhang Z, et al. An Empirical Approach Leveraging Tumorgrafts to Dissect the Tumor Microenvironment in Renal Cell Carcinoma Identifies Missing Link to Prognostic Inflammatory Factors. Cancer discovery 2018;8(9):1142–55 doi 10.1158/2159-8290.CD-17-1246. [DOI] [PMC free article] [PubMed] [Google Scholar]
- 29.Beuselinck B, Verbiest A, Couchy G, Job S, de Reynies A, Meiller C, et al. Pro-angiogenic gene expression is associated with better outcome on sunitinib in metastatic clear-cell renal cell carcinoma. Acta oncologica (Stockholm, Sweden) 2017:1–11 doi 10.1080/0284186x.2017.1388927. [DOI] [PubMed] [Google Scholar]
- 30.Veglia F, Perego M, Gabrilovich D. Myeloid-derived suppressor cells coming of age. Nature immunology 2018;19(2):108–19 doi 10.1038/s41590-017-0022-x. [DOI] [PMC free article] [PubMed] [Google Scholar]
- 31.Aparicio LM, Fernandez IP, Cassinello J. Tyrosine kinase inhibitors reprogramming immunity in renal cell carcinoma: rethinking cancer immunotherapy. Clinical & translational oncology : official publication of the Federation of Spanish Oncology Societies and of the National Cancer Institute of Mexico 2017. doi 10.1007/s12094-017-1657-7. [DOI] [PMC free article] [PubMed] [Google Scholar]
- 32.Toge H, Inagaki T, Kojimoto Y, Shinka T, Hara I. Angiogenesis in renal cell carcinoma: the role of tumor-associated macrophages. International journal of urology : official journal of the Japanese Urological Association 2009;16(10):801–7 doi 10.1111/j.1442-2042.2009.02377.x. [DOI] [PubMed] [Google Scholar]
- 33.Gordon SR, Maute RL, Dulken BW, Hutter G, George BM, McCracken MN, et al. PD-1 expression by tumour-associated macrophages inhibits phagocytosis and tumour immunity. Nature 2017;545(7655):495–9 doi 10.1038/nature22396. [DOI] [PMC free article] [PubMed] [Google Scholar]
- 34.Guislain A, Gadiot J, Kaiser A, Jordanova ES, Broeks A, Sanders J, et al. Sunitinib pretreatment improves tumor-infiltrating lymphocyte expansion by reduction in intratumoral content of myeloid-derived suppressor cells in human renal cell carcinoma. Cancer immunology, immunotherapy : CII 2015;64(10):1241–50 doi 10.1007/s00262-015-1735-z. [DOI] [PMC free article] [PubMed] [Google Scholar]
- 35.Ozao-Choy J, Ma G, Kao J, Wang GX, Meseck M, Sung M, et al. The novel role of tyrosine kinase inhibitor in the reversal of immune suppression and modulation of tumor microenvironment for immune-based cancer therapies. Cancer research 2009;69(6):2514–22 doi 10.1158/0008-5472.can-08-4709. [DOI] [PMC free article] [PubMed] [Google Scholar]
- 36.Gerlinger M, Rowan AJ, Horswell S, Math M, Larkin J, Endesfelder D, et al. Intratumor heterogeneity and branched evolution revealed by multiregion sequencing. The New England journal of medicine 2012;366(10):883–92 doi 10.1056/NEJMoa1113205. [DOI] [PMC free article] [PubMed] [Google Scholar]
- 37.Serie DJ, Joseph RW, Cheville JC, Ho TH, Parasramka M, Hilton T, et al. Clear Cell Type A and B Molecular Subtypes in Metastatic Clear Cell Renal Cell Carcinoma: Tumor Heterogeneity and Aggressiveness. European urology 2017;71(6):979–85 doi 10.1016/j.eururo.2016.11.018. [DOI] [PMC free article] [PubMed] [Google Scholar]
- 38.B. E, Tannir NM, McDermott DF CheckMate 214: Efficacy and safety of nivolumab + ipilimumab (N+I) v sunitinib (S) for treatment-naïve advanced or metastatic renal cell carcinoma (mRCC), including IMDC risk and PD-L1 expression subgroups. . Annals of Oncology. Volume 282017. p 621–2. [Google Scholar]
- 39.Choueiri TK, Figueroa DJ, Fay AP, Signoretti S, Liu Y, Gagnon R, et al. Correlation of PD-L1 tumor expression and treatment outcomes in patients with renal cell carcinoma receiving sunitinib or pazopanib: results from COMPARZ, a randomized controlled trial. Clinical cancer research : an official journal of the American Association for Cancer Research 2015;21(5):1071–7 doi 10.1158/1078-0432.ccr-14-1993. [DOI] [PubMed] [Google Scholar]
- 40.Cheng DT, Mitchell TN, Zehir A, Shah RH, Benayed R, Syed A, et al. Memorial Sloan Kettering-Integrated Mutation Profiling of Actionable Cancer Targets (MSK-IMPACT): A Hybridization Capture-Based Next-Generation Sequencing Clinical Assay for Solid Tumor Molecular Oncology. The Journal of molecular diagnostics : JMD 2015;17(3):251–64 doi 10.1016/j.jmoldx.2014.12.006. [DOI] [PMC free article] [PubMed] [Google Scholar]
- 41.Lawrence M, Huber W, Pages H, Aboyoun P, Carlson M, Gentleman R, et al. Software for computing and annotating genomic ranges. PLoS computational biology 2013;9(8):e1003118 doi 10.1371/journal.pcbi.1003118. [DOI] [PMC free article] [PubMed] [Google Scholar]
- 42.Rosenbloom KR, Armstrong J, Barber GP, Casper J, Clawson H, Diekhans M, et al. The UCSC Genome Browser database: 2015 update. Nucleic acids research 2015;43(Database issue):D670–81 doi 10.1093/nar/gku1177. [DOI] [PMC free article] [PubMed] [Google Scholar]
- 43.Love MI, Huber W, Anders S. Moderated estimation of fold change and dispersion for RNA-seq data with DESeq2. Genome biology 2014;15(12):550 doi 10.1186/s13059-014-0550-8. [DOI] [PMC free article] [PubMed] [Google Scholar]
- 44.Masiero M, Simoes FC, Han HD, Snell C, Peterkin T, Bridges E, et al. A core human primary tumor angiogenesis signature identifies the endothelial orphan receptor ELTD1 as a key regulator of angiogenesis. Cancer cell 2013;24(2):229–41 doi 10.1016/j.ccr.2013.06.004. [DOI] [PMC free article] [PubMed] [Google Scholar]
- 45.Bindea G, Mlecnik B, Tosolini M, Kirilovsky A, Waldner M, Obenauf AC, et al. Spatiotemporal dynamics of intratumoral immune cells reveal the immune landscape in human cancer. Immunity 2013;39(4):782–95 doi 10.1016/j.immuni.2013.10.003. [DOI] [PubMed] [Google Scholar]
- 46.Senbabaoglu Y, Gejman RS, Winer AG, Liu M, Van Allen EM, de Velasco G, et al. Tumor immune microenvironment characterization in clear cell renal cell carcinoma identifies prognostic and immunotherapeutically relevant messenger RNA signatures. Genome biology 2016;17(1):231 doi 10.1186/s13059-016-1092-z. [DOI] [PMC free article] [PubMed] [Google Scholar]
- 47.Hanzelmann S, Castelo R, Guinney J. GSVA: gene set variation analysis for microarray and RNA-seq data. BMC bioinformatics 2013;14:7 doi 10.1186/1471-2105-14-7. [DOI] [PMC free article] [PubMed] [Google Scholar]
- 48.Gaujoux R, Seoighe C. A flexible R package for nonnegative matrix factorization. BMC bioinformatics 2010;11:367 doi 10.1186/1471-2105-11-367. [DOI] [PMC free article] [PubMed] [Google Scholar]
- 49.Ritchie ME, Phipson B, Wu D, Hu Y, Law CW, Shi W, et al. limma powers differential expression analyses for RNA-sequencing and microarray studies. Nucleic acids research 2015;43(7):e47 doi 10.1093/nar/gkv007. [DOI] [PMC free article] [PubMed] [Google Scholar]
- 50.Subramanian A, Tamayo P, Mootha VK, Mukherjee S, Ebert BL, Gillette MA, et al. Gene set enrichment analysis: a knowledge-based approach for interpreting genome-wide expression profiles. Proceedings of the National Academy of Sciences of the United States of America 2005;102(43):15545–50 doi 10.1073/pnas.0506580102. [DOI] [PMC free article] [PubMed] [Google Scholar]
- 51.Malone BM, Tan F, Bridges SM, Peng Z. Comparison of four ChIP-Seq analytical algorithms using rice endosperm H3K27 trimethylation profiling data. PloS one 2011;6(9):e25260 doi 10.1371/journal.pone.0025260. [DOI] [PMC free article] [PubMed] [Google Scholar]
Associated Data
This section collects any data citations, data availability statements, or supplementary materials included in this article.