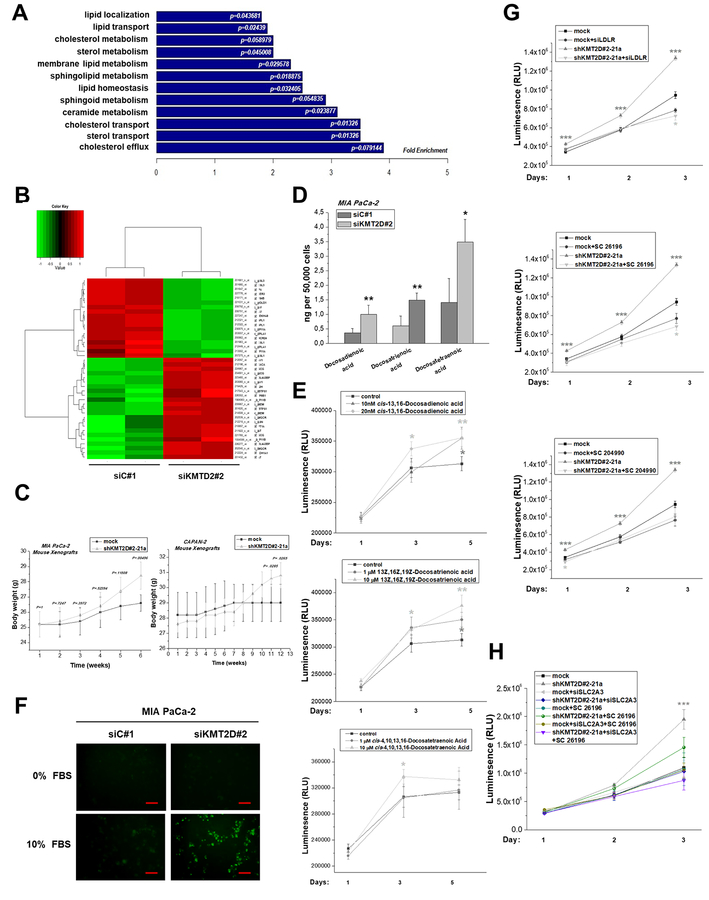
Figure 5. KMT2D inhibition alters the lipid composition and cholesterol content in pancreatic cancer.
(A) GO-based annotation was used to perform functional enrichment analysis using the DAVID (v6.7) tools. Fold enrichment of genes (associated to lipid metabolic processes) regulated by KMT2D levels is measured by the bar length while P value represents the significance of the enrichment. (B) Heatmap summarizing the differentially expressed lipid metabolism-related genes in MIA PaCa-2 cells upon KMT2D suppression. Data was filtered using a P value cutoff of .05 and a fold change cut-off of 1.5. (C) Body weight graphs of mouse xenografts bearing MIA PaCa-2 or CAPAN-2 shKMT2D#2–21a clonal cell lines and mock-transfected cells (n=5 mice per group). (D) Column graph illustrating quantitative changes of the top 3 FAs regulated by KMT2D. (E) Time- and dose-dependent effect of exogenously added FAs on cell proliferation, as assessed by CellTiter Glo Luminescence Cell Viability Assay. (F) Detection of cholesterol uptake within MIA PaCa-2 cultured cells, as assessed by fluorescence microscopy. Scale bars represent 50 μm. (G, H) Time-dependent effect of LDLR or SLC2A3 silencing, SC 26196 and SC 204990 inhibitors on cell proliferation in high and low KMT2D-expressing cells, as assessed by CellTiter Glo Luminescence Cell Viability Assay. Statistical analyses were performed using one-way ANOVA. Asterisks denote statistically significant differences, * P<.05, ** P<.01, *** P<.001

