Abstract
Objective:
Determine the reliability of a new tablet-based software that utilizes postoperative computed tomography (CT) to determine angular insertion depth (AID), cochlear duct length (CDL) and the cochlear place frequency of individual electrodes in cochlear implant (CI) recipients.
Patients:
Twenty adult CI recipients with lateral-wall electrode arrays of varying lengths.
Intervention:
Cochlear and electrode array measurements were made by two otolaryngologists using a tablet-based software. The user manually identifies the modiolus, round window, and each electrode contact to calculate AID. The user also manually identifies cochlear landmarks to calculate the CDL. The AID and CDL are applied to the Greenwood function to obtain an estimate of the cochlear place frequency for each electrode.
Main Outcome Measure(s):
The primary outcome measure was the reliability of the instrument, as assessed with intra- and inter-rater reliability of measured AID and CDL. The resultant differences in the estimated cochlear place frequency of the most apical electrode were also evaluated.
Results:
A broad range of AIDs were observed (390° to 659°). Intraclass correlation coefficients for intra- (0.991) and inter-rater reliability (0.980) of AID of the most apical electrode contact were excellent. Intra- (0.820) and inter-rater reliability (0.784) of CDL were also excellent. The estimated cochlear place frequency for the most apical electrode differed by an average of 6.7% (0–18.7%) across the two raters.
Conclusions:
There is excellent agreement amongst clinicians in the determination of AID and CDL, resulting in small changes in estimated cochlear place frequency of the most apical electrode using this new software.
Introduction
The variability in cochlear implant (CI) recipient postoperative speech perception can be influenced by intrinsic physiologic factors such as duration of hearing loss [1,2], age at implantation [3] and residual cochlear health [4]. While these are non-modifiable variables, other factors known to impact outcomes, such as angular insertion depth (AID) [3,5], can potentially be controlled for in the surgical planning process and incorporated in device mapping procedures.
Prior studies have consistently shown deeper insertions to be associated with improved audiologic outcomes for lateral-wall electrode arrays in the electric only condition [6–9]. Estimating AID takes into account the variance in linear insertion depth and cochlear size, and provides valuable information pertaining to electrode location in relation to the tonotopic organization of the cochlea. One potential explanation for the association between greater AID and better performance for lateral-wall arrays is that the default frequency filter assignments for apical electrodes are closely aligned with the cochlear place frequency. Given the possible association between AID and speech perception, there has been increasing interest in developing technology that can accurately measure AID and, in turn, generate an estimate of the cochlear place frequency for each electrode.
Algorithms utilizing intraoperative and postoperative skull x-ray and computed tomography (CT) have been used previously to calculate AID [10–16]. Skull radiographs can provide an accurate and reliable measurement of AID but are highly reliant on head positioning due to their two-dimensional nature [17]. Although x-ray techniques offer a promising alternative for populations that do not routinely undergo postoperative CT, such as children, CT remains the gold standard for determining AID. A new tablet-based software package uses postoperative CT to calculate AID and cochlear duct length (CDL). The AID and CDL are used to estimate the cochlear place frequency for each electrode based on the Greenwood function [18]. The AID and CDL measures are dependent on user identification of the modiolus, round window, cochlear dimensions and individual electrodes. The manual method and use of postoperative CT images, which are associated with metallic artifact due to electrode presence [17,19], may introduce variability in the results. The primary aim of the present study was to evaluate the intra- and inter-rater reliability of this tool in determining AID and CDL. We also sought to assess the resultant variability in estimates of the cochlear place frequency for the most apical electrode.
Materials and Methods
Study procedures were approved by the Institutional Review Board, and subjects provided consent to participate. Subjects were adult CI recipients of the MED-EL Flex 24 (24 mm), Flex 28 (28 mm), or Flex SOFT (31.5 mm) electrode arrays. A postoperative temporal bone CT was obtained in all cases.
The postoperative CT was uploaded to a new tablet-based software (OTOPLAN®) to calculate the AID and CDL, and estimate the cochlear place frequency for each electrode. OTOPLAN was developed by CAScination AG (Bern, Switzerland) in collaboration with MED-EL Corporation (Innsbruck, Austria) and is not labeled for use in the US. The software algorithm uses the location of the user-identified modiolus (defined as the center of the modiolus in the three-dimensionally rendered cochlear view), round window, and individual electrodes (FIG. 1) to determine the AID for each electrode. These measurements are made in the cochlear view manually determined by the user. The user-identified cochlear dimensions were used to calculate CDL according to the elliptic-circular approximation (ECA) method, which has been shown to improve accuracy over other methodologies [20]. In short, this method determines the basal turn length of the lateral wall by using patient specific measurement of the cochlear diameter A- and width B-values, which subsequently allows for the derivation of the CDL. The software uses the AID and CDL values to estimate the cochlear place frequency based on the Greenwood function [18].
FIG. 1.
Postoperative computed tomography images in the tablet-based software depicting the cochlear view and calculation of cochlear dimensions. Distance between colored circles represent diameter A-value (green), height H-value (red) and width B-value (blue).
Two raters identified the elements and cochlear dimensions for each CT scan to assess the inter- and intra-rater reliability of the AID and CDL results. The raters were a board-certified neuro-otologist (BPO) and an otolaryngology resident (MWC). Each rater determined AID and CDL for all 20 CTs using the tablet-based software, blinded to electrode array and the other rater’s results. At a minimum of 2 weeks after initial AID and CDL determination, one rater (MWC) re-evaluated all 20 CTs in a blinded fashion to assess intra-rater reliability. For inter- and intra-rater reliability measurements with continuous data, intra-class correlation coefficient (ICC) for absolute agreement with 95% confidence interval was used. ICC values were interpreted in accordance with the following scale: poor (<0.40), fair (0.40–0.59), good (0.60–0.74) and excellent (0.75–1.00) [21]. Statistical analysis was performed with SPSS 25 for Windows (IBM Corp, Armonk, New York).
Results
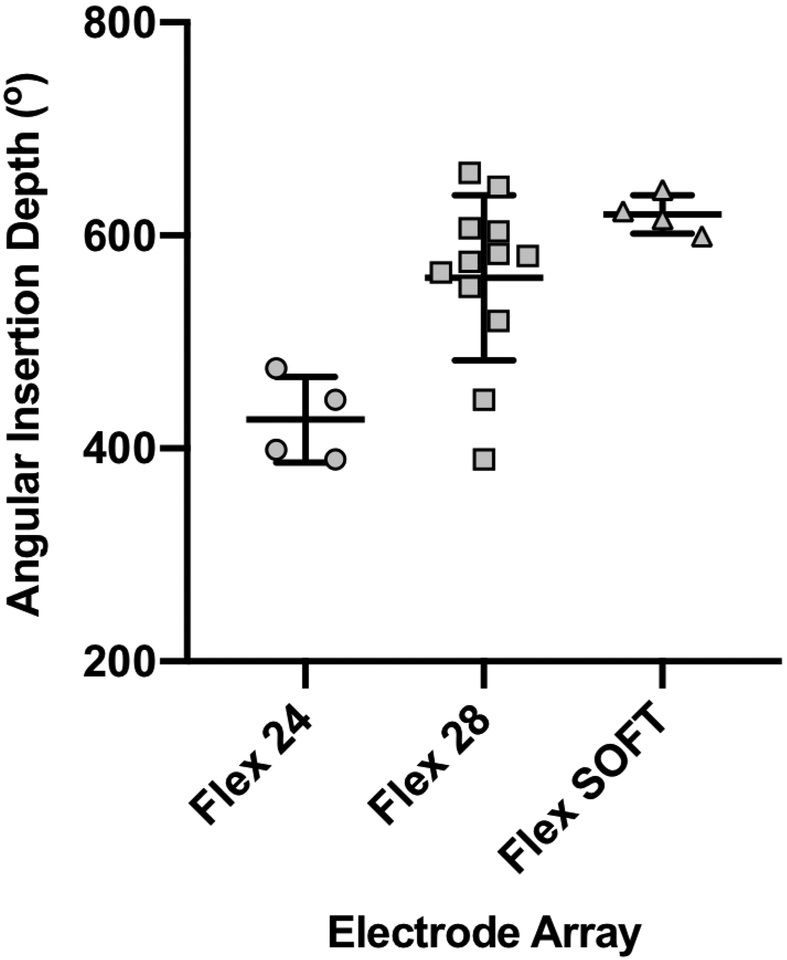
The CT scans of 20 subjects were reviewed. All cases underwent a round window approach, with a full insertion of either the Flex 24 (n=4), Flex 28 (n=12), or Flex SOFT (n=4) electrode array. The average mean AID of the two raters was 546±89.7° (range 390°−659°) across 20 patients. The median AID averaged across raters was 422° (interquartile [IQ] range 392°−468°) for Flex 24, 578° (IQ range 528°−606°) for Flex 28, and 619° (IQ range 603°−643°) for Flex SOFT (FIG. 2).
FIG. 2.
Median angular insertion depth (AID) for Flex 24, Flex 28 and Flex SOFT electrode arrays determined by the software algorithm.
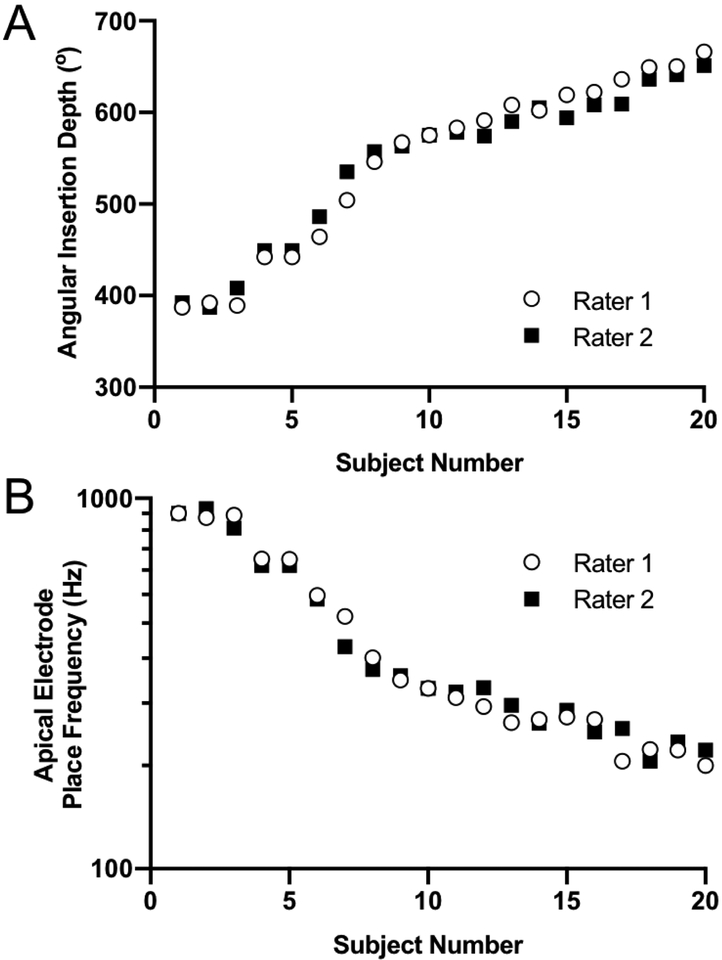
Rater measurements of AID for each subject are depicted in FIG. 3A. The average absolute difference between the two raters was 9.9 ±8.29° (range 0°−31°). The average absolute difference between one rater’s first and second measurement of AID was 7.0±6.76° (range 0°–20°). The ICC for inter-rater (0.980; 95% CI: 0.945–0.992) and intra-rater (0.991; 95% CI: 0.976–0.997) reliability of AID were excellent. The estimated cochlear place frequency of the apical electrode for each subject is depicted in FIG 3B. Inter-rater variability in AID and CDL shifted the acoustic place frequency by an average of 6.7% (0–18.7%).
FIG. 3.
Inter-rater comparisons of the apical electrode contact (A) angular insertion depth and (B) cochlear place frequency determined by the Greenwood equation for each subject.
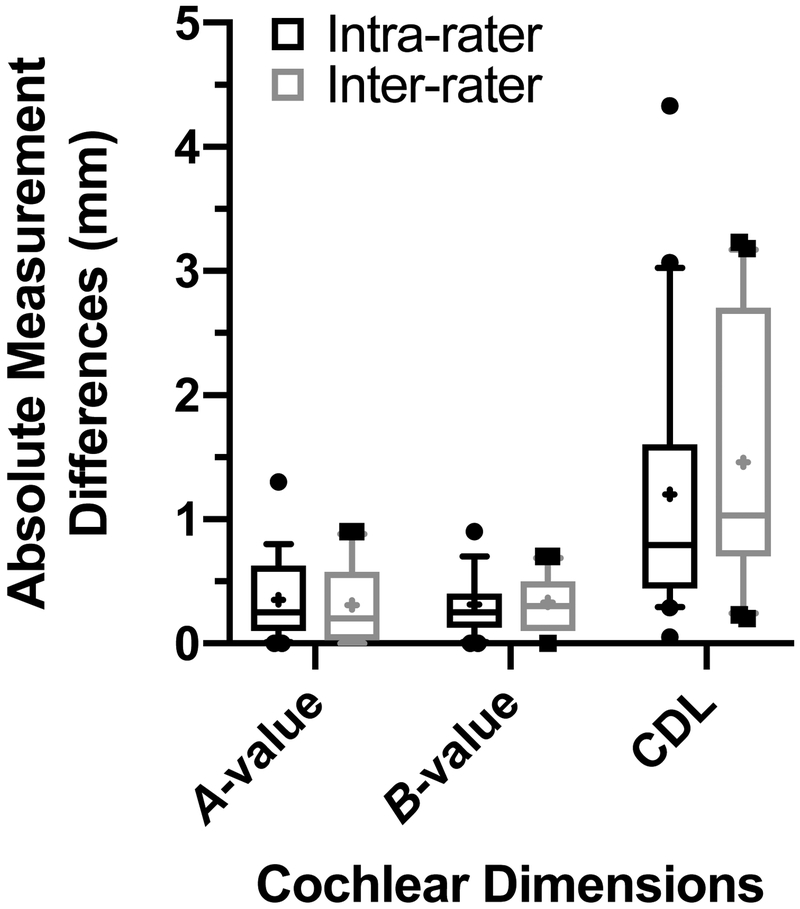
Inter- and intra-rater absolute differences in cochlear dimension measurements using the tablet-based software are shown in FIG. 4. The average absolute difference between each raters CDL measurement was 1.5±1.08mm (FIG. 4). The average absolute difference between one rater’s first and second measurement of CDL was 1.2±1.08mm. This also resulted in excellent ICC for inter-rater (0.784; 95% CI: 0.452–0.914) and intra-rater (0.820; 95% CI: 0.544–0.929) reliability of CDL.
FIG. 4.
Absolute intra- and inter-rater differences in postoperative computed tomography cochlear measurements using the tablet-based software. Mean value represented by + symbol. CDL; cochlear duct length.
Discussion
The primary aim of the present study was to assess the reliability of the AID and CDL calculations made using a new tablet-based software. The results demonstrate excellent inter- and intra-rater reliability of both AID and CDL. The subsequent impact of differences in AID and CDL on estimates of cochlear place frequency for the most apical electrode was assessed; we observed an average difference of 6.7% between rater measurements. These findings have clinical implications in that this software can be used to reliably determine electrode location to inform image-guided mapping strategies for CI recipients.
Postoperative CT is limited by artifact; therefore, we assessed the variability in CDL results to review the impact of human error in the software algorithm. Automated measures are likely the most reliable method to reduce variability and increase accuracy [22,23]. The current software uses the ECA model to determine CDL, dependent upon manual A- and B-values determined with postoperative CT, which introduces uncertainty into the estimates since these landmarks can be obscured by the electrode artifact. Despite these limitations, minimal measurement error was observed between users, which has implications for providing reliable information pertaining to electrode array position in relation to the tonotopic map of the cochlea. However, measurements of these values on preoperative imaging with higher resolution of landmarks may improve estimates of the cochlear place frequency.
The determination of AID confers important prognostic information due to the relationship between insertion depth and speech perception in CI recipients [5,9]. AID offers the best measure for electrode array depth, as it accounts for both linear insertion and cochlear size. This new tablet-based software allows clinicians to quickly and reliably measure AID with lateral-wall arrays, with angular depths in this study comparable to those previously reported [5,17,24–26]. The intracochlear location of most commercially available electrode arrays result in a mismatch between the electrically presented frequency information and the cochlear place frequency [26]; however, the current default mapping procedures do not incorporate AID and CDL into the frequency filter assignments. Accurate measurements of AID and CDL may allow for patient-specific, place-based programming procedures. Further research is needed to determine whether use of the Greenwood function is most effective in such modified mapping procedures as opposed to a spiral ganglion map [27].
The data presented herein support the reliability of this tool in determining AID and estimating cochlear place frequency; however, a cadaveric study is required to assess the accuracy of these measurements. Additionally, we reviewed lateral-wall electrode arrays from MED-EL Corporation supported by the software platform. Modiolar hugging electrode arrays may provide additional artifact near the modiolus, making it more challenging to accurately identify this landmark manually.
This study demonstrates the reliability of a new tablet-based software in the determination of AID and CDL with lateral-wall arrays. These metrics provide prognostic information for postoperative speech perception with default electric frequency filter assignments. The clinical implications of incorporating the cochlear place frequency in individual electrode frequency filter assignments is under investigation.
Financial Disclosures/Conflicts of Interest:
This project was funded in part by the NIH through NIDCD (T32 DC005360). The senior authors, HCP, KDB and BPO serve on the surgical advisory board for MED-EL Corporation. MTD is supported by a research grant from MED-EL Corporation. MWC and EB declare that involvement in research was conducted in the absence of any commercial or financial relationships that could be construed as a potential conflict of interest.
References
- 1.Rubinstein JT, Parkinson WS, Tyler RS, Gantz BJ. Residual speech recognition and cochlear implant performance: effects of implantation criteria. Am J Otol. 1999;20(4):445–452. [PubMed] [Google Scholar]
- 2.Blamey P, Artieres F, Baskent D, et al. Factors affecting auditory performance of postlinguistically deaf adults using cochlear implants: an update with 2251 patients. Audiol Neurootol. 2013;18(1):36–47. [DOI] [PubMed] [Google Scholar]
- 3.Holden LK, Finley CC, Firszt JB, et al. Factors affecting open-set word recognition in adults with cochlear implants. Ear Hear. 2013;34(3):342–360. [DOI] [PMC free article] [PubMed] [Google Scholar]
- 4.Fontenot TE, Giardina CK, Dillon MT, et al. Residual Cochlear Function in Adults and Children Receiving Cochlear Implants: Correlations With Speech Perception Outcomes. Ear Hear. 2018. [DOI] [PMC free article] [PubMed] [Google Scholar]
- 5.O’Connell BP, Hunter JB, Haynes DS, et al. Insertion depth impacts speech perception and hearing preservation for lateral wall electrodes. Laryngoscope. 2017;127(10):2352–2357. [DOI] [PMC free article] [PubMed] [Google Scholar]
- 6.Hochmair I, Arnold W, Nopp P, Jolly C, Muller J, Roland P. Deep electrode insertion in cochlear implants: apical morphology, electrodes and speech perception results. Acta Otolaryngol. 2003;123(5):612–617. [PubMed] [Google Scholar]
- 7.Yukawa K, Cohen L, Blamey P, Pyman B, Tungvachirakul V, O’Leary S. Effects of insertion depth of cochlear implant electrodes upon speech perception. Audiol Neurootol. 2004;9(3):163–172. [DOI] [PubMed] [Google Scholar]
- 8.O’Connell BP, Cakir A, Hunter JB, et al. Electrode Location and Angular Insertion Depth Are Predictors of Audiologic Outcomes in Cochlear Implantation. Otol Neurotol. 2016;37(8):1016–1023. [DOI] [PMC free article] [PubMed] [Google Scholar]
- 9.Buchman CA, Dillon MT, King ER, Adunka MC, Adunka OF, Pillsbury HC. Influence of cochlear implant insertion depth on performance: a prospective randomized trial. Otol Neurotol. 2014;35(10):1773–1779. [DOI] [PubMed] [Google Scholar]
- 10.Chen JM, Farb R, Hanusaik L, Shipp D, Nedzelski JM. Depth and quality of electrode insertion: a radiologic and pitch scaling assessment of two cochlear implant systems. Am J Otol. 1999;20(2):192–197. [PubMed] [Google Scholar]
- 11.Xu J, Xu SA, Cohen LT, Clark GM. Cochlear view: postoperative radiography for cochlear implantation. Am J Otol. 2000;21(1):49–56. [PubMed] [Google Scholar]
- 12.Schuman TA, Noble JH, Wright CG, Wanna GB, Dawant B, Labadie RF. Anatomic verification of a novel method for precise intrascalar localization of cochlear implant electrodes in adult temporal bones using clinically available computed tomography. Laryngoscope. 2010;120(11):2277–2283. [DOI] [PMC free article] [PubMed] [Google Scholar]
- 13.Kong WJ, Cheng HM, Ma H, Wang YJ, Han P. Evaluation of the implanted cochlear implant electrode by CT scanning with three-dimensional reconstruction. Acta Otolaryngol. 2012;132(2):116–122. [DOI] [PubMed] [Google Scholar]
- 14.Colby CC, Todd NW, Harnsberger HR, Hudgins PA. Standardization of CT depiction of cochlear implant insertion depth. AJNR Am J Neuroradiol. 2015;36(2):368–371. [DOI] [PMC free article] [PubMed] [Google Scholar]
- 15.Svrakic M, Friedmann DR, Berman PM, Davis AJ, Roland JT Jr., Svirsky MA. Measurement of Cochlear Implant Electrode Position From Intraoperative Post-insertion Skull Radiographs: A Validation Study. Otol Neurotol. 2015;36(9):1486–1491. [DOI] [PMC free article] [PubMed] [Google Scholar]
- 16.Fernandes V, Wang Y, Yeung R, Symons S, Lin V. Effectiveness of skull X-RAY to determine cochlear implant insertion depth. J Otolaryngol Head Neck Surg. 2018;47(1):50. [DOI] [PMC free article] [PubMed] [Google Scholar]
- 17.Trieger A, Schulze A, Schneider M, Zahnert T, Murbe D. In vivo measurements of the insertion depth of cochlear implant arrays using flat-panel volume computed tomography. Otol Neurotol. 2011;32(1):152–157. [DOI] [PubMed] [Google Scholar]
- 18.Greenwood DD. A cochlear frequency-position function for several species−−29 years later. J Acoust Soc Am. 1990;87(6):2592–2605. [DOI] [PubMed] [Google Scholar]
- 19.Pearl MS, Roy A, Limb CJ. High-resolution secondary reconstructions with the use of flat panel CT in the clinical assessment of patients with cochlear implants. AJNR Am J Neuroradiol. 2014;35(6):1202–1208. [DOI] [PMC free article] [PubMed] [Google Scholar]
- 20.Schurzig D, Timm ME, Batsoulis C, et al. A Novel Method for Clincial Cochlear Duct Length Estimation toward Patient-Specific Cochlear Implant Selection. OTO Open. 2018:1–8. [DOI] [PMC free article] [PubMed] [Google Scholar]
- 21.Cicchetti DV. Guidelines, criteria, and rules of thumb for evaluating normed and standardized assessment instruments in psychology. Psychol Assess. 1994;6:284–290. [Google Scholar]
- 22.Rivas A, Cakir A, Hunter JB, et al. Automatic Cochlear Duct Length Estimation for Selection of Cochlear Implant Electrode Arrays. Otol Neurotol. 2017;38(3):339–346. [DOI] [PMC free article] [PubMed] [Google Scholar]
- 23.Iyaniwura JE, Elfarnawany M, Ladak HM, Agrawal SK. An automated A-value measurement tool for accurate cochlear duct length estimation. J Otolaryngol Head Neck Surg. 2018;47(1):5. [DOI] [PMC free article] [PubMed] [Google Scholar]
- 24.Tamir S, Ferrary E, Borel S, Sterkers O, Bozorg Grayeli A. Hearing preservation after cochlear implantation using deeply inserted flex atraumatic electrode arrays. Audiol Neurootol. 2012;17(5):331–337. [DOI] [PubMed] [Google Scholar]
- 25.Vermeire K, Nobbe A, Schleich P, Nopp P, Voormolen MH, Van de Heyning PH. Neural tonotopy in cochlear implants: an evaluation in unilateral cochlear implant patients with unilateral deafness and tinnitus. Hear Res. 2008;245(1–2):98–106. [DOI] [PubMed] [Google Scholar]
- 26.Landsberger DM, Svrakic M, Roland JT Jr., Svirsky M The Relationship Between Insertion Angles, Default Frequency Allocations, and Spiral Ganglion Place Pitch in Cochlear Implants. Ear Hear. 2015;36(5):e207–213. [DOI] [PMC free article] [PubMed] [Google Scholar]
- 27.Stakhovskaya O, Sridhar D, Bonham BH, Leake PA. Frequency map for the human cochlear spiral ganglion: implications for cochlear implants. J Assoc Res Otolaryngol. 2007;8(2):220–233. [DOI] [PMC free article] [PubMed] [Google Scholar]


